고정된 트윗

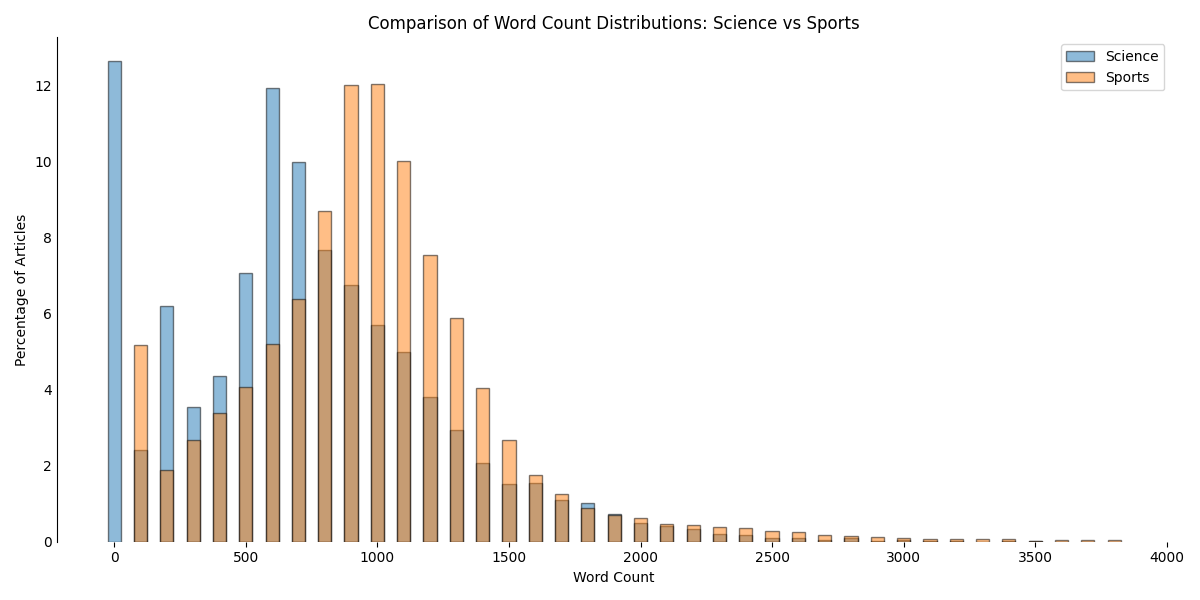
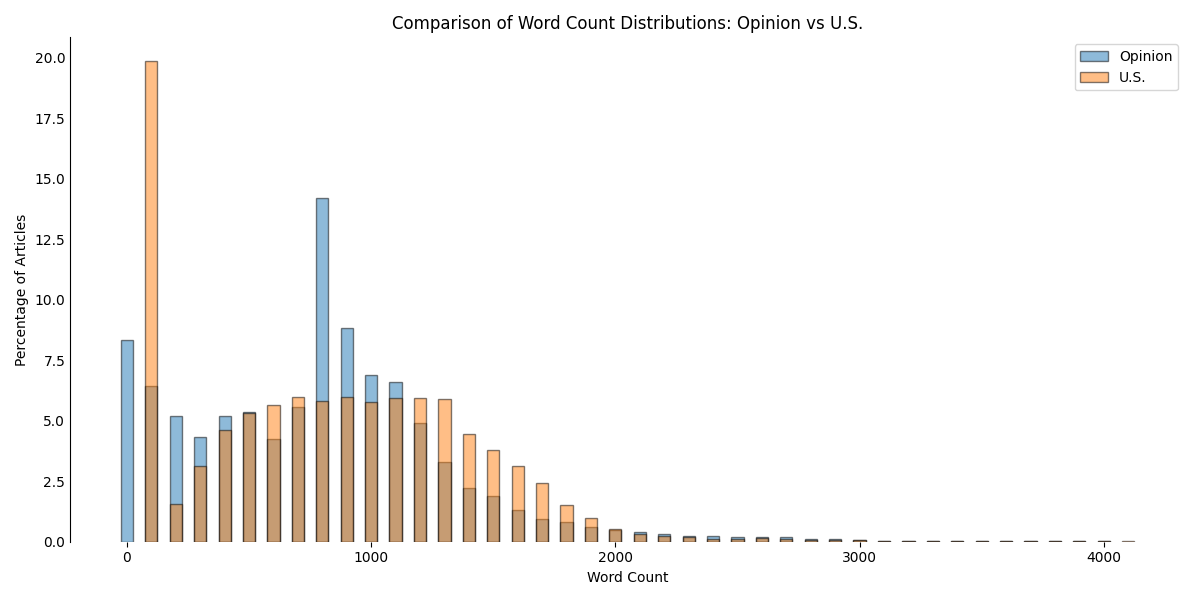
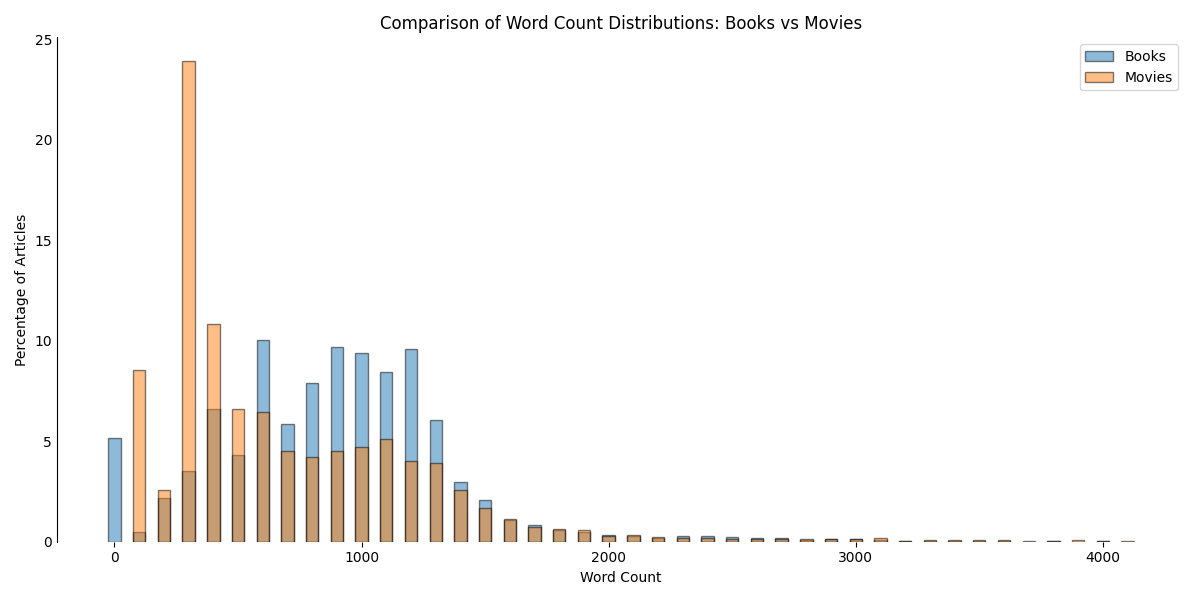
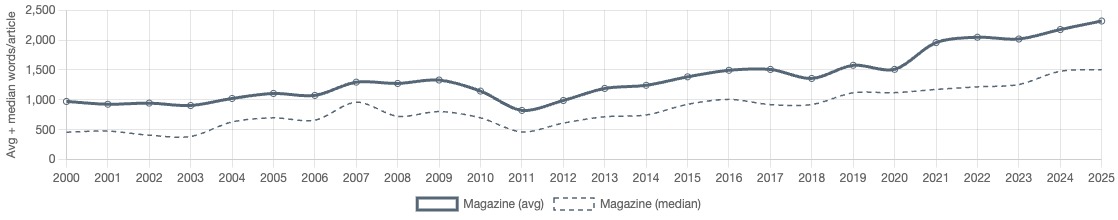
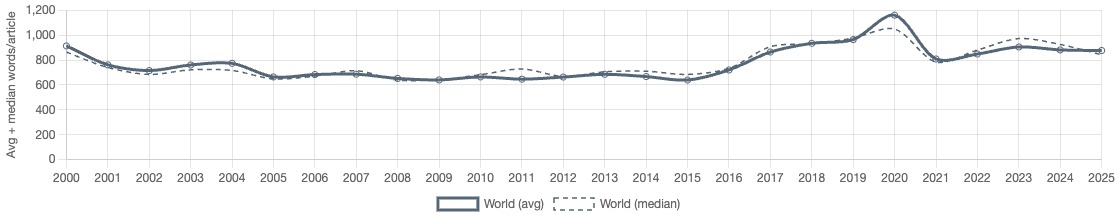
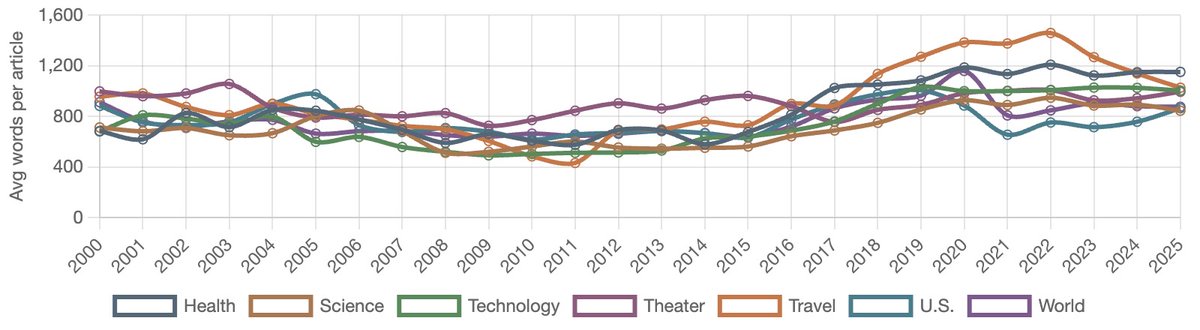
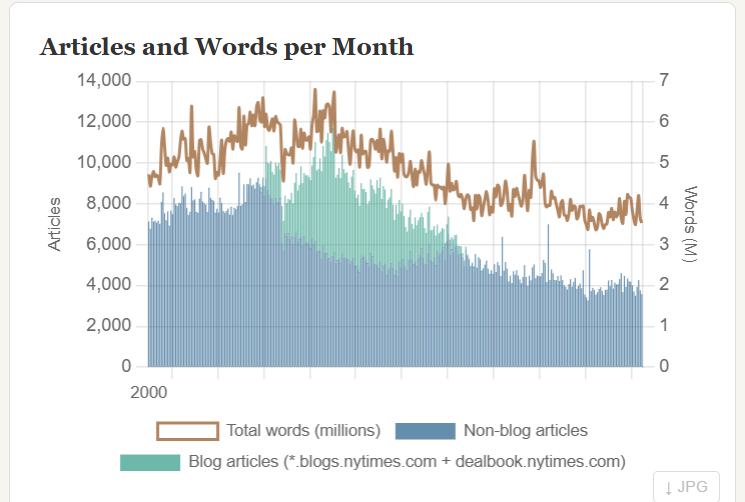
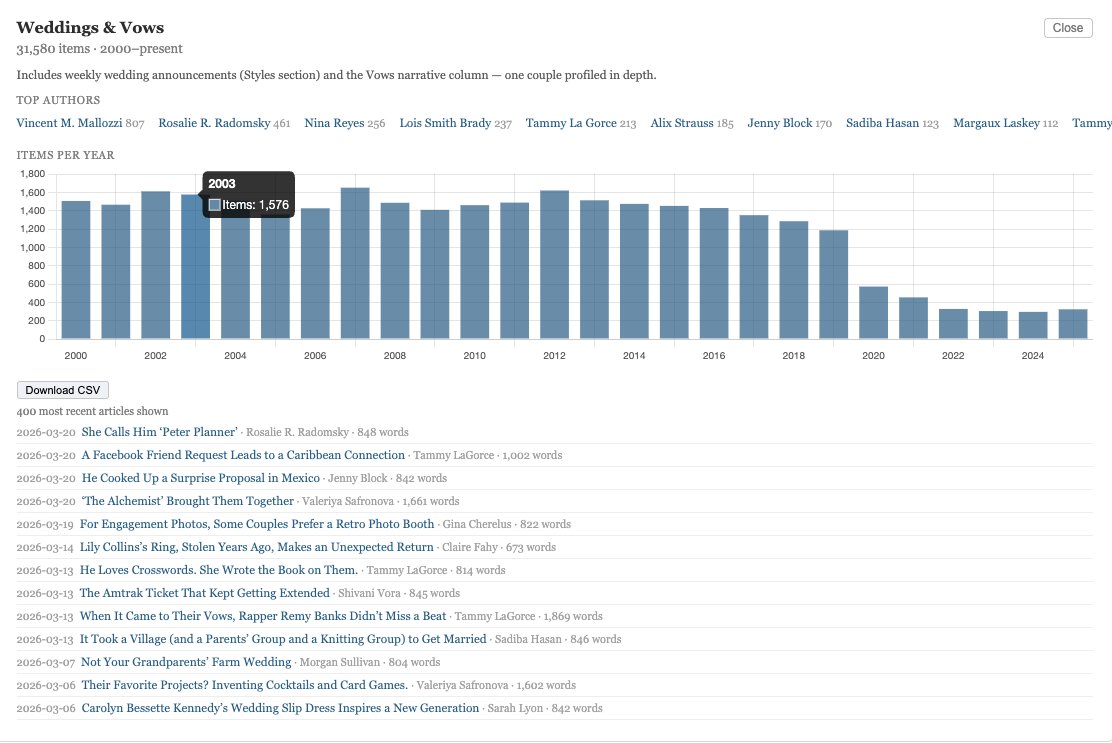
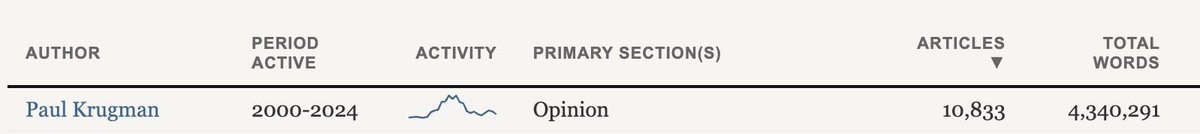
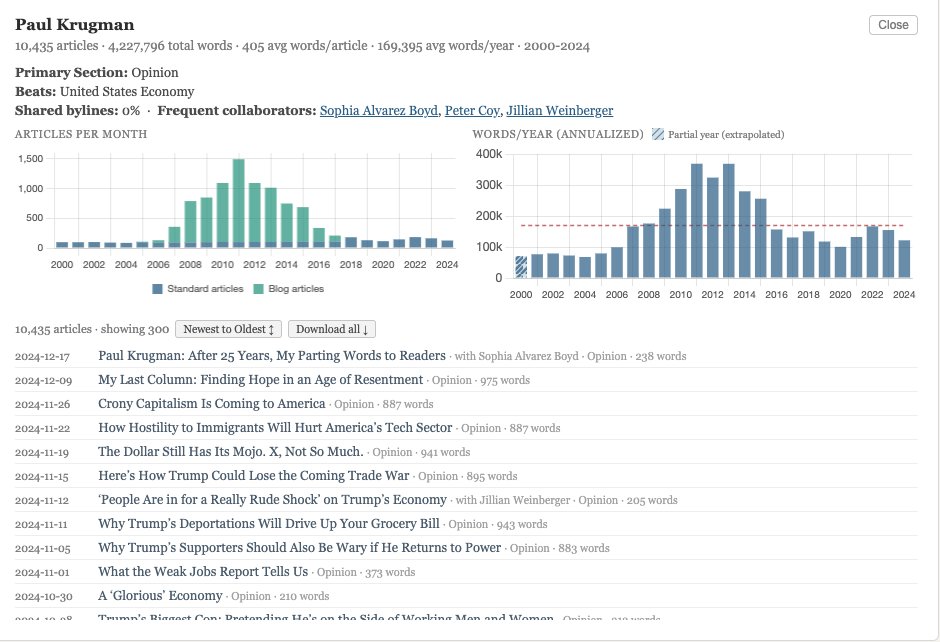
I built a dashboard to explore the last 25+ years of @nytimes coverage. 1.5B words, 2.2M articles, 26K reporters. It's fascinating to look at the world’s preeminent news organization not as daily stories but as patterns of attention, ebbing and flowing. tedalcorn.github.io/nyt/
English