고정된 트윗

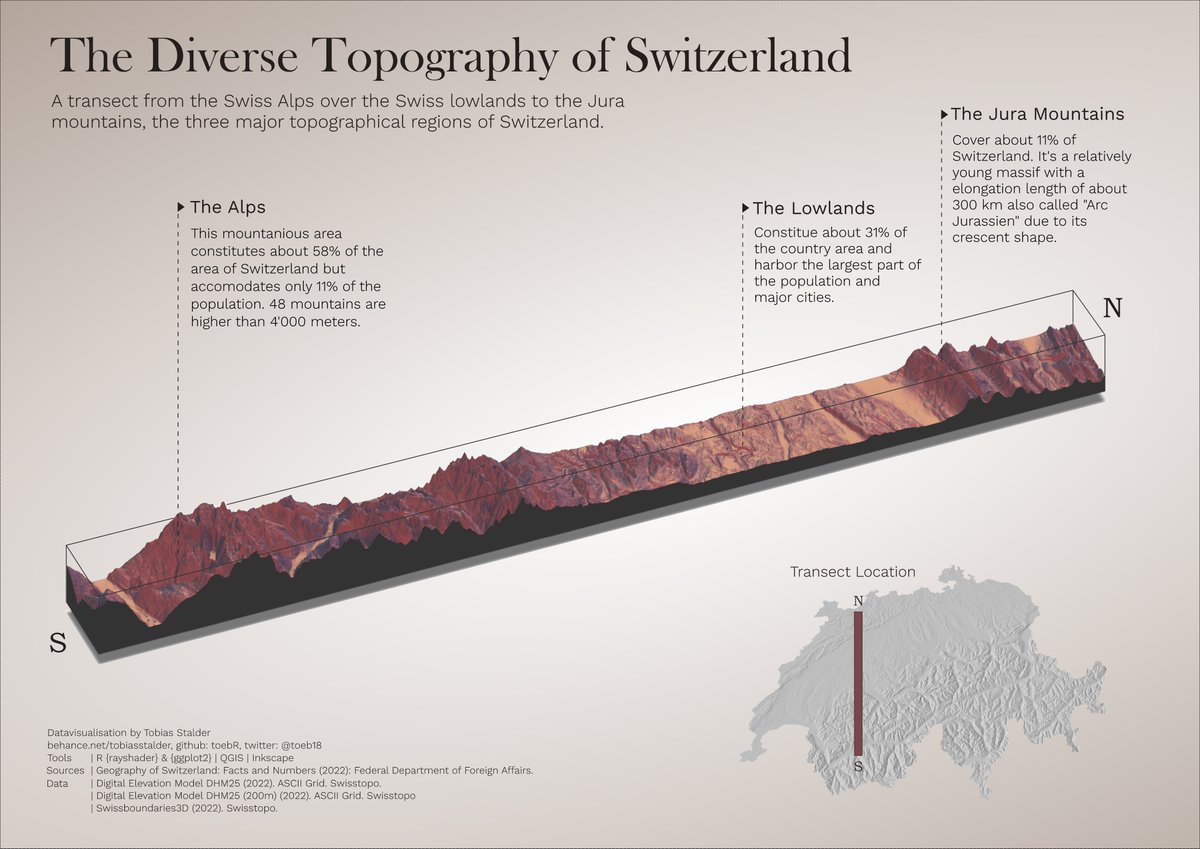
I had fun this weekend in #Rstats with #rayshader & #ggplot2 together with #QGIS and #inkscape.
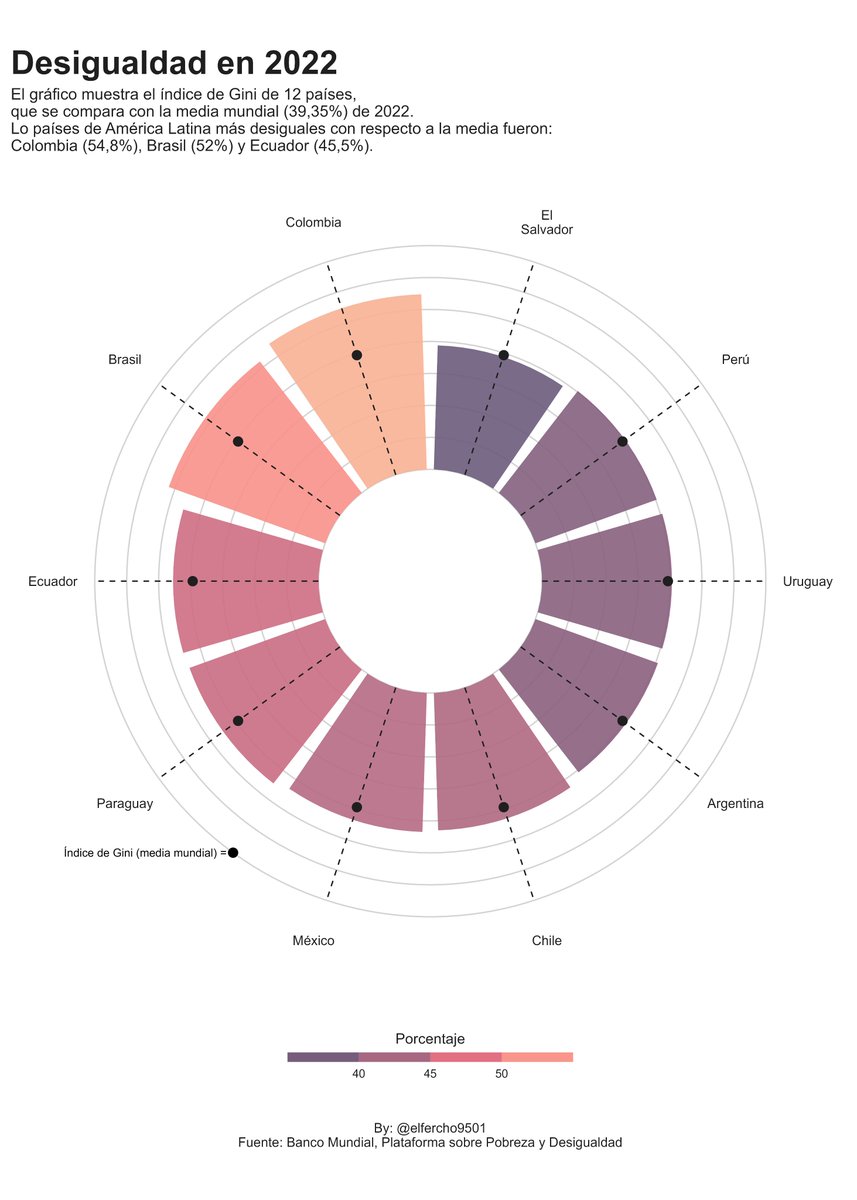
Here is my very first 3D #DataVisualization 🥳
Code for maps in comments.
Thanks @tylermorganwall for troubleshooting.
Data from @swisstopo.
#GIS #gischat #infographic #dataviz #Data
English