Ray Boyne
8.8K posts


Ray Boyne
@AnalysisGaa
Data & Performance Analyst, Dublin (2003-18) Tipperary (2019) 12 All Ireland Football Finals . All Ireland Hurling Final 2019. Kilkenny Senior Hurling 2025
Dublin City, Ireland Katılım Haziran 2010
205 Takip Edilen41K Takipçiler

Donegal 3-20 (29) | Kerry 2-10 (16)
Looks big.
It was.
Effort count: Donegal 96 | Kerry 71
That’s not a stat
that’s control of the game.
Donegal didn’t just have more
they used it better:
✔️ 32 attacking plays → 31 shots → 19 scores
✔️ Efficiency: 61%
✔️ Nearly every attack ends in a shot (31/32)
✔️ Turnovers: 5 (v 13)
Kerry actually had decent moments…
but kept giving it back.
And that’s the killer:
+3 attacks
+8 shots
+8 scores
That doesn’t happen by accident.
Kickouts didn’t save Kerry (59% v 60%)
Accuracy didn’t hurt them (58%)
They just weren’t in the game enough.
Donegal:
win it → use it → score.
Kerry:
win it → lose it → chase.
Different levels of control.
Different outcome.

English

Meath 1-22 (25) | Cork 2-17 (23)
Close on the scoreboard.
Not as close underneath it.
Effort count: Meath 84 | Cork 67
That’s the game.
Cork were actually more efficient (62%)
But Meath just brought more of everything:
✔️ More shots (34 v 29)
✔️ More 2-pointers (4 v 1)
✔️ Better on restarts (58/42 %)
✔️ Gave away less (9 frees v 15)
And when you add in a +17 effort swing…
That shows up in the bits that matter pressure, turnovers, support runs, getting back.
Cork were sharp.
Meath were relentless.
Different routes
but “effort stats” closed it out.

English

The best managers I’ve worked with didn’t have all the answers.
They asked better questions.
“What are you seeing?”
“What are we missing?”
That’s where performance comes from.
🎙️ Spoke about this (and more) here: algoodbody-1.wistia.com/medias/35z0rxy…

English
I had a go at pulling together Division 1 2-point output, total scoring and efficiency
just to see how it lines up with the league table.
There’s something in it. Not perfectly aligned, but not random either.
Different teams seem to be getting to similar outcomes in very different ways.
This is rough work for now I’ll turn it into a couple of graphics and see does it hold.
Happy to be corrected on any of it.

English
“Never forget where you come from.”
I watched Granit Xhaka speak about his upbringing.
One line stayed with me:
“I’ve been a leader since I was four.”
Not because he was told to be.
Because he had to be.
•Leadership wasn’t taught… it was forced through responsibility
•That upbringing created:
•resilience
•accountability
•perspective
And it got me thinking.
Because a lot of us grew up around the same kind of standards even if we didn’t call it that at the time.
My Dad was gone early every morning to the Unidare factory.
My Mam was out cleaning offices before we even woke.
We got ourselves ready for school.
Mam worked a canteen job during the day, came home, made sure we had our family meal, and then headed back out again for evening cleaning shifts.
No speeches.
No big lessons.
Just example.
It’s not really about hardship —
it’s about standards formed early.
What you see in people later:
•emotional control
•edge
•leadership under pressure
👉 That doesn’t come from coaching sessions
👉 It comes from environment + expectation
“Leadership isn’t something you switch on at 25.
It’s something that’s built into you long before anyone is watching.”
A reminder, maybe, for all of us:
The behaviours we measure, coach and talk about now…
often started long before we ever arrived in a dressing room or a workplace.
Responsibility early… shows up later.
Ah Ronan Steede this one got me very emotional 🙌 thank you for sharing.
English


Wouldn't usually be a big fan of AI, it too often makes daft & very obvious errors that aren't nearly often enough caught by end users.
It's choice here to completely remove Roscommon from all considerations one of the few times I've seen it try to do anything positive.
English
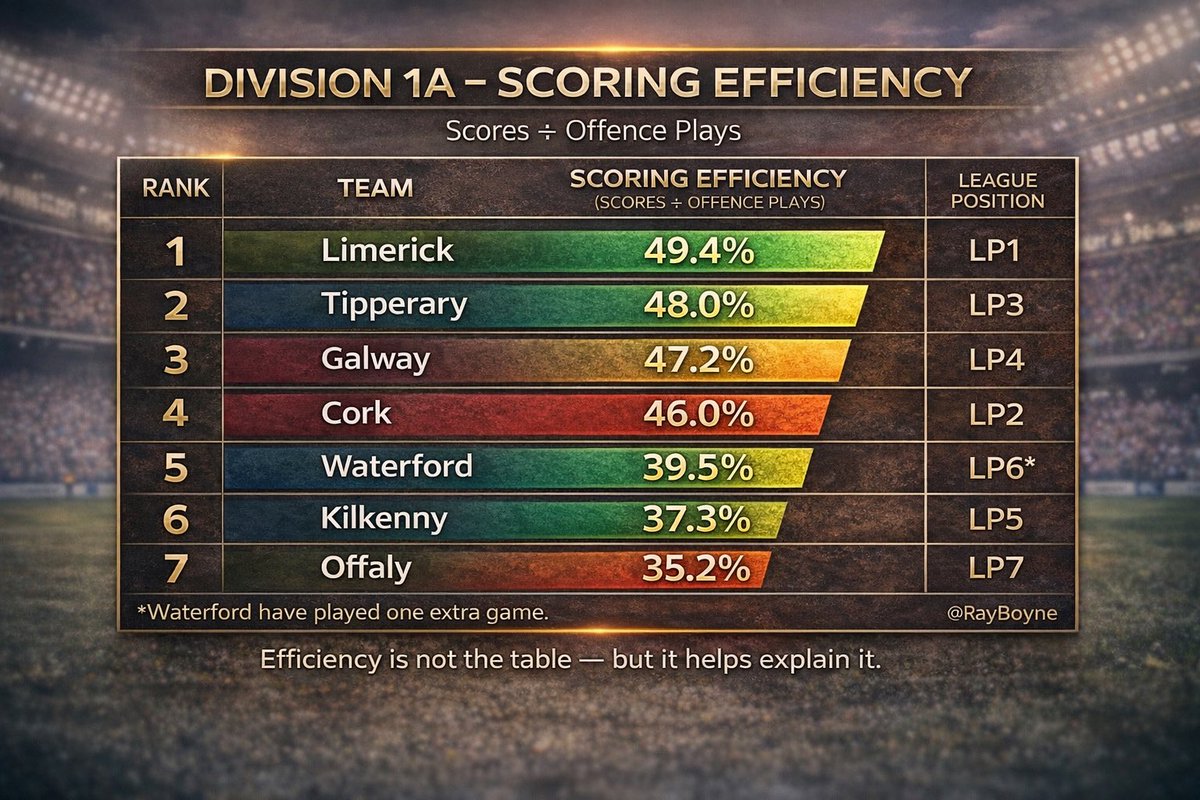
National Hurling League Division 1A. Similar to the recent Division 1 football exercise, this is a look at scoring efficiency.
Scoring efficiency shows how effectively a team turns attacks into scores. Calculated as scores ÷ offence plays, it offers a simple measure of which teams are getting the best return from possession.
English
Performance development often comes back to something very simple.
Simple rarely means easy.
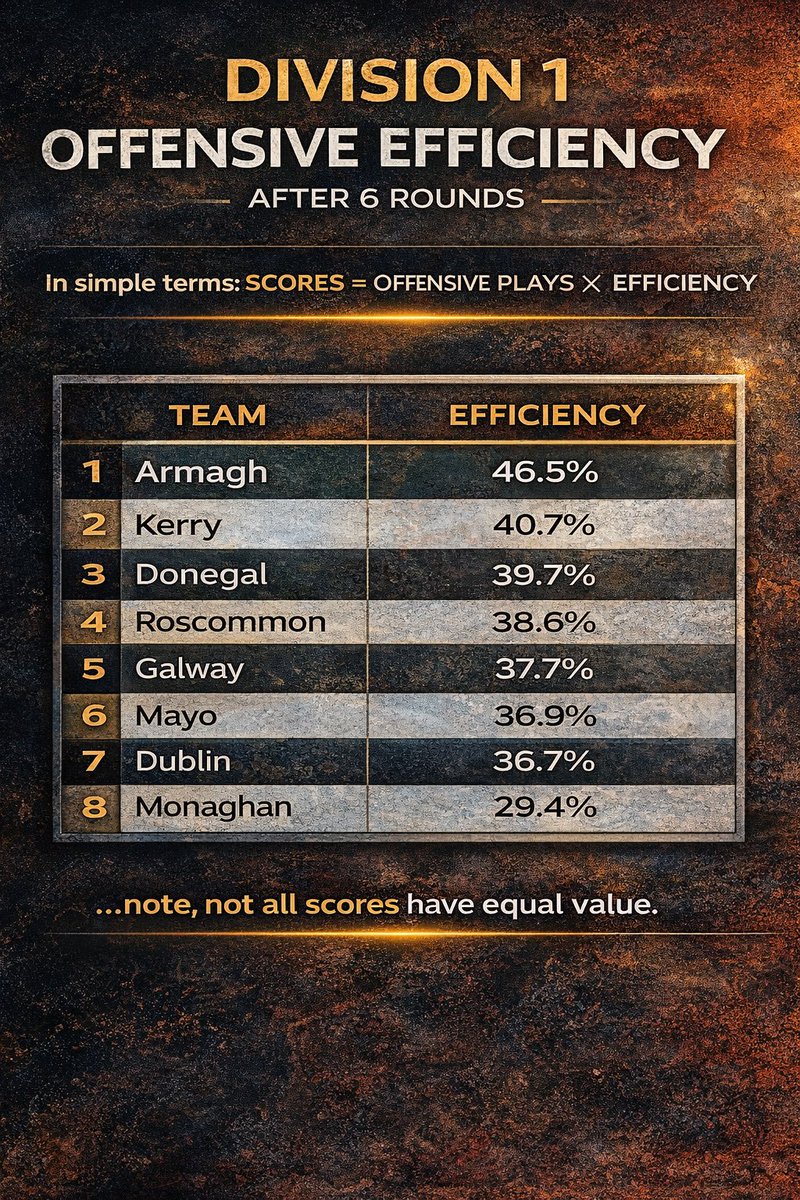
These three graphics look at Division 1 from a slightly different angle.
Armagh currently sit 6th in the table, yet they have produced more scores than any other team in the league and have the highest offensive efficiency.
So that naturally raises a few questions.
If they are already creating that many attacking opportunities…
If they are already turning possession into scores at that rate…
What might happen if even a small number of those 1-pointers became 2-pointers?
Or if the value of each attack increased slightly?
That is where performance development gets interesting.
Sometimes the next step is not doing dramatically more.
Sometimes it is about getting more value from what you are already doing well.
Maybe that is one of the questions for every team heading into championship preparation:
Are we just measuring how often we score?
Or are we also asking what our scores are worth?
No grand claims here.
Just an interesting pattern in the data and perhaps a reminder that in performance, the margins are often found in the value of the opportunity, not just the volume.
Simple is not always easy. But better questions often lead to better outcomes.


English

Understanding Offensive Efficiency
Around 2016, a statistic was born out of the question “When we get the ball, what happens next?” :
How many scores does a team generate from its offensive plays?
At its most basic level, the game can be broken into a sequence of offensive and defensive phases. When a team gains possession, that marks the beginning of an offensive play. That play concludes when the possession ends whether through a score, a missed shot, a turnover, or the ball going out of play.
At that point, the same team transitions into a defensive play, while the opposition begins their offensive phase.
Over the course of a game, both teams therefore tend to have a broadly similar number of offensive and defensive possessions.
From an analytical perspective, this shifts the focus toward how effectively a team converts its attacking opportunities.
The key metric becomes:
Offensive Efficiency = Scores ÷ Offensive Plays
Or expressed simply:
Scores = Offensive Plays × Efficiency
This statistic allows teams to measure how effectively they turn possession into scoring outcomes.
It is also worth noting that not all scores carry equal value, which adds another important layer to how attacking performance can be evaluated.
Score value is the next part of the formula
Offensive Plays → Efficiency → Score Value
English
Armagh are the most frequent scorers in Division 1, the next step may simply be increasing the value of those scores.
Armagh are currently the highest scoring team in Division 1, producing 128 scores and 145 points after six rounds.
But the data reveals something interesting:
89% of those scores are single points.
In the modern game, the teams climbing the table are increasingly combining score frequency with score value goals and two-pointers dramatically increase the return from attacking opportunities.
Armagh are already proving they can create and convert attacks consistently.
The opportunity coming out of the league may simply be to add more variation and value to those scores.
Sometimes the difference between a very good attack and a great one is not how often you score but what type of score you produce

English
The most interesting thing about these numbers isn’t the statistics.
It’s the behaviours hiding behind them
Those France Six Nations numbers are extraordinary, first in almost every attacking and defensive metric.
Points.
Tries.
Metres made.
Line breaks.
Defenders beaten.
Offloads.
Dominant tackles.
Tackle success.
But the interesting thing is this:
Stats don’t create performance.
They reveal it.
The reason teams track these numbers is simple.
Because what gets measured gets done.
When you measure:
•metres made
•dominant tackles
•offloads
•line breaks
•tackle success
you are really measuring something deeper.
You are measuring effort and attitude expressed as data.
Metres made = players working to get over the gain line.
Dominant tackles = players committing to collisions.
Line breaks = players attacking space.
Offloads = players supporting each other.
Tackle success = players refusing to be beaten.
So when a team tops almost every category, what you’re really seeing is not statistics.
You’re seeing a culture where the behaviours that matter are repeated again and again.
That’s why good teams measure things.
Not to admire spreadsheets.
But to make sure the right behaviours show up every weekend.
Because in the end, the scoreboard follows the behaviours.
And behaviours follow what you choose to measure.
Effort.
& Attitude.
What you’re really seeing isn’t statistics.
It’s effort and attitude… measured
English