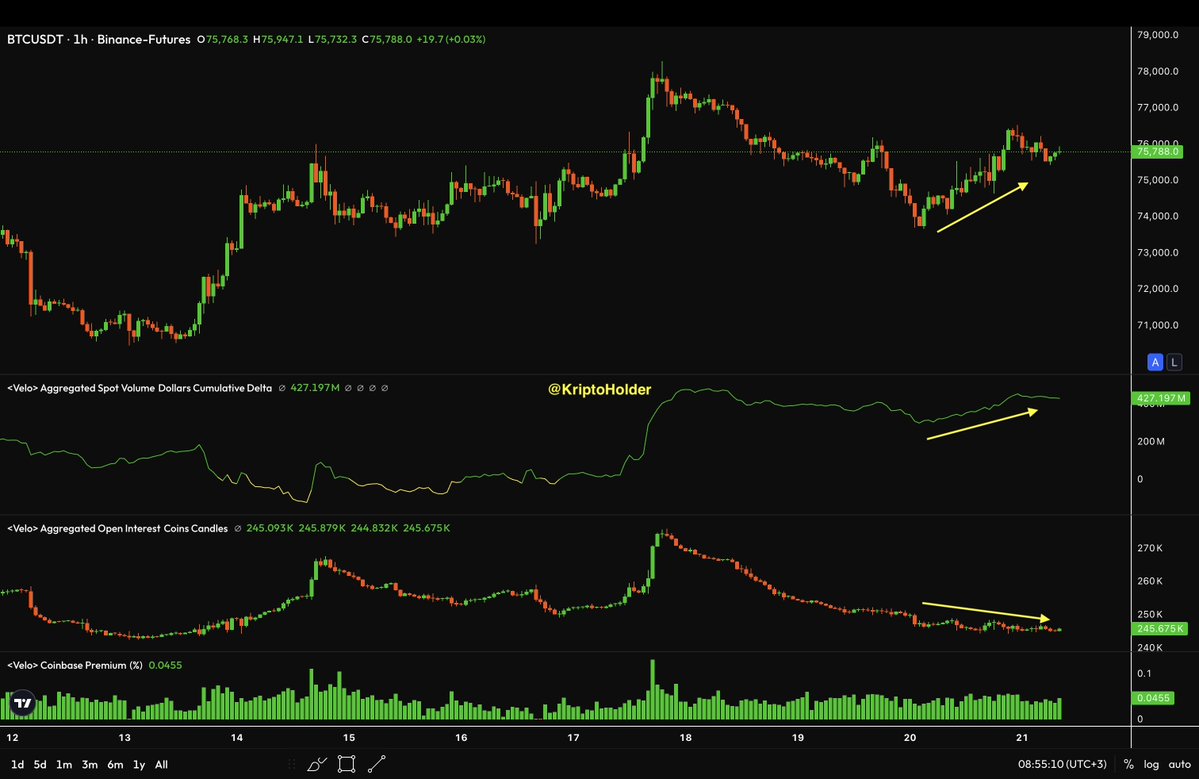
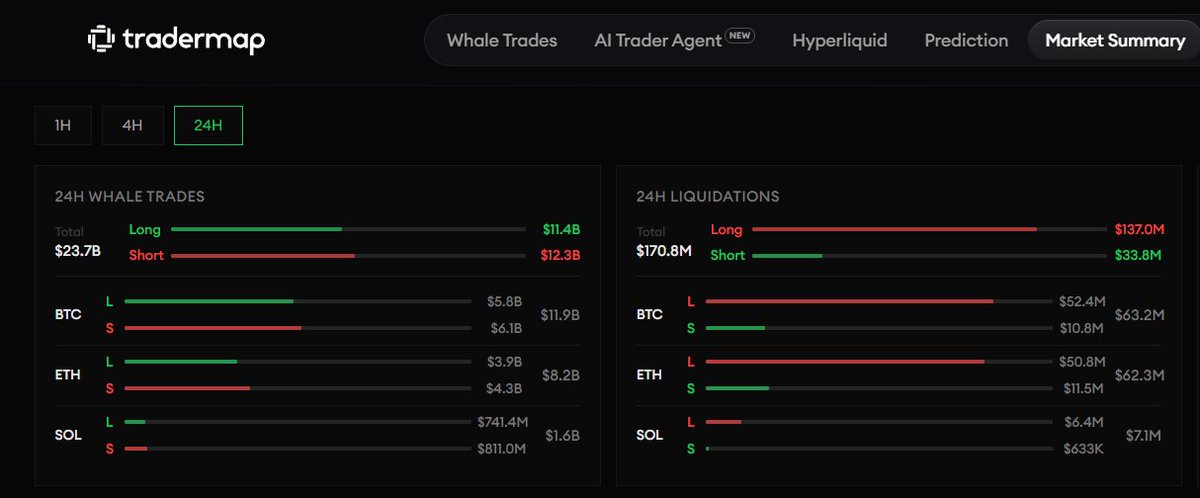
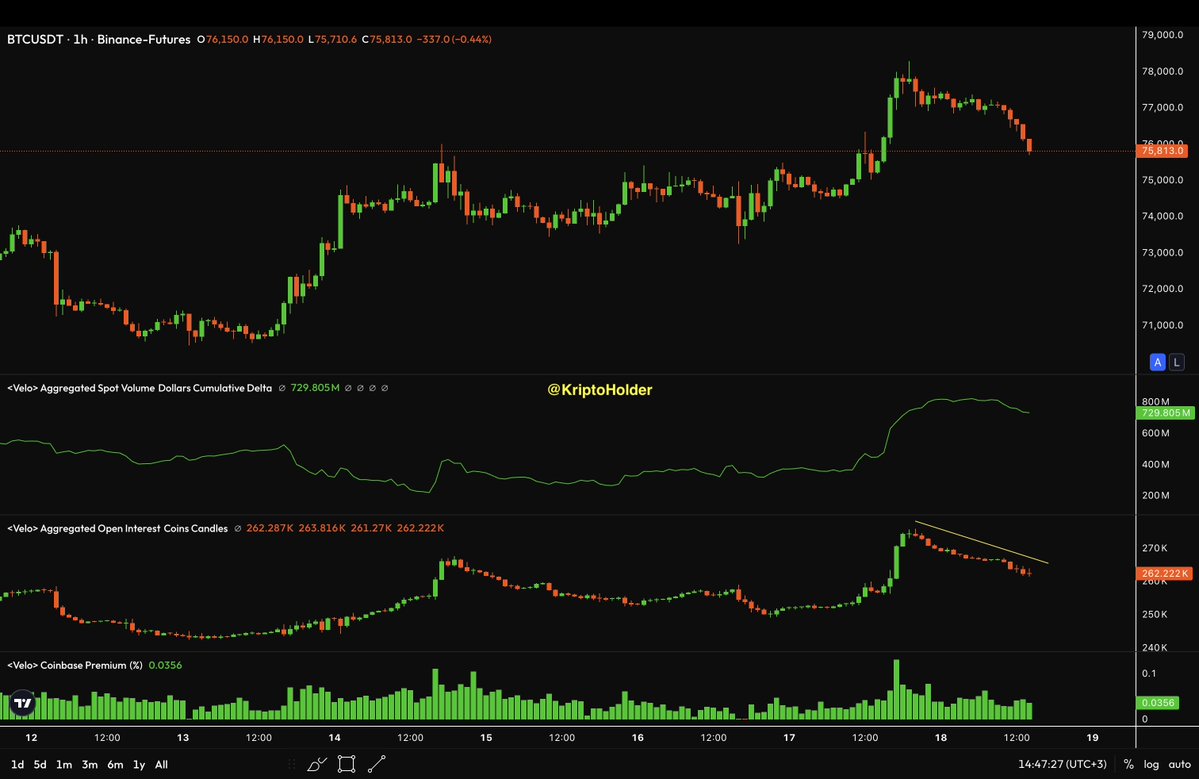
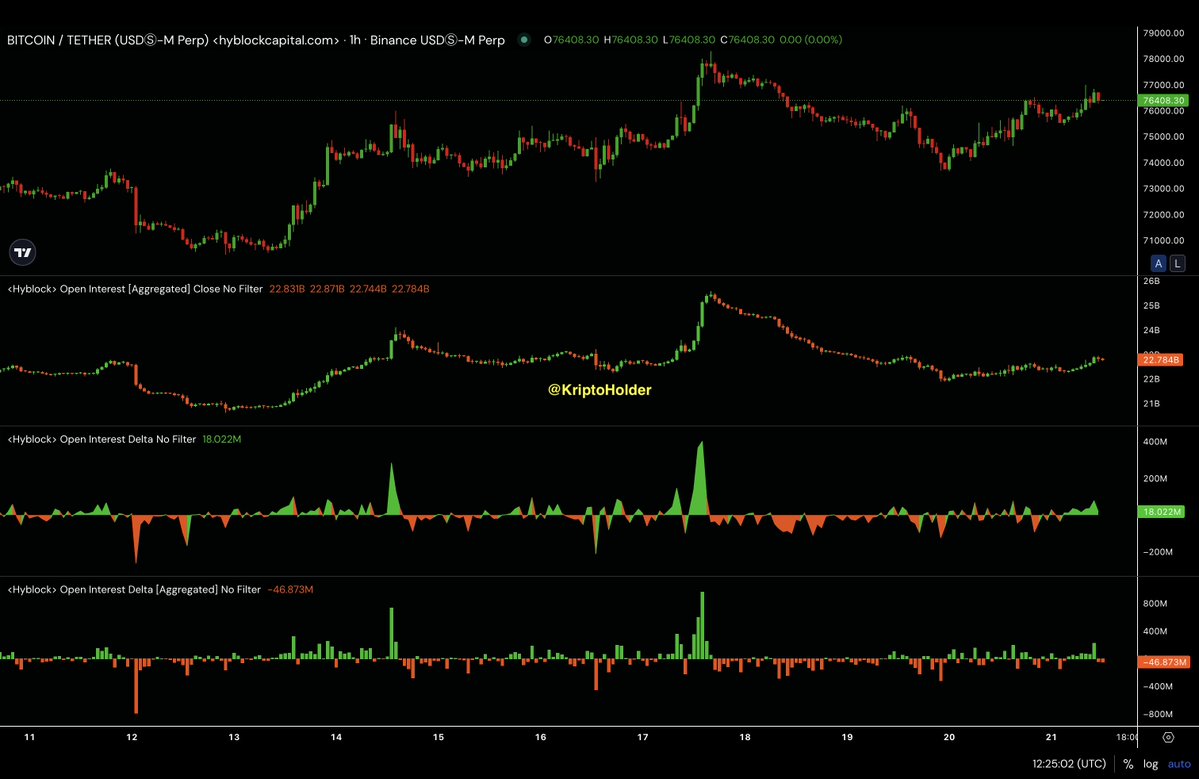
BTC structure is notable.
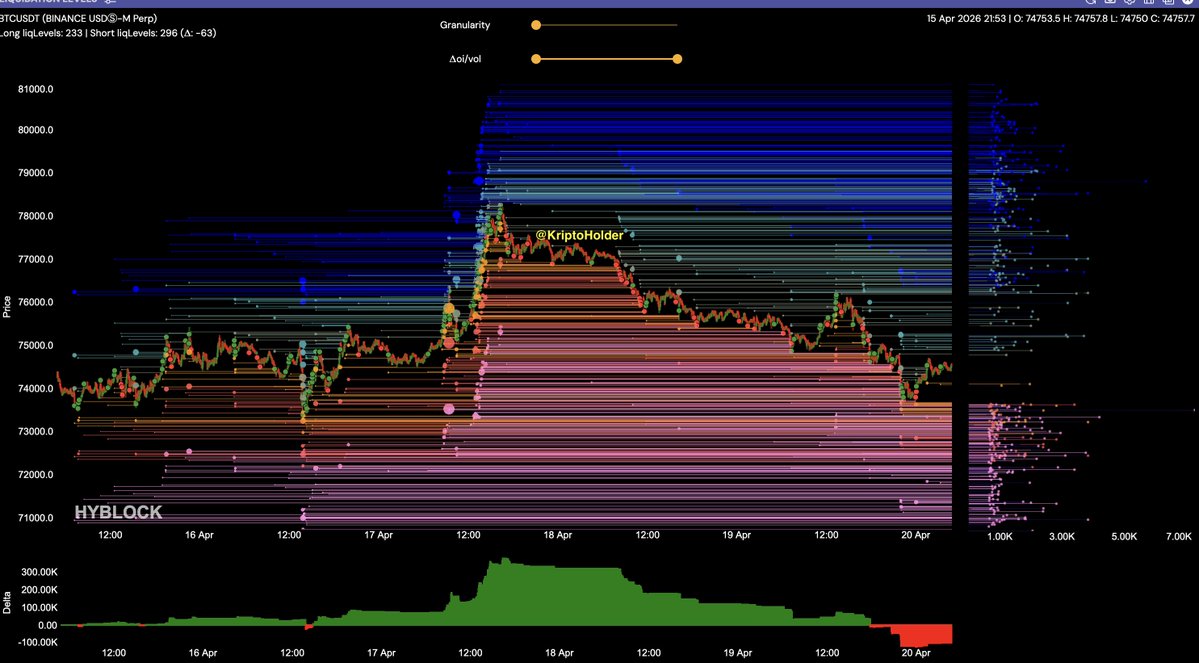
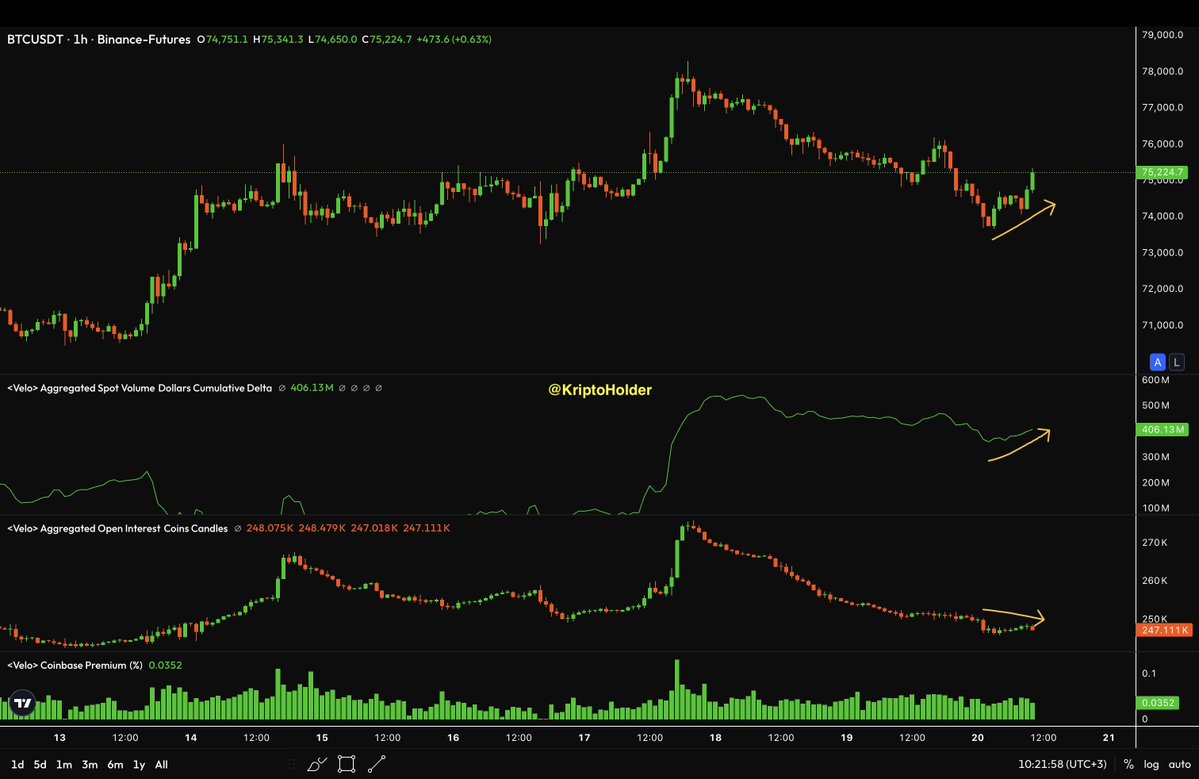
As price moved up, Open Interest peaked. Then OI declined while price held steady — indicating position cleanup (long liquidations / profit taking).
Recently, OI is rising again but not aggressively.
Delta remains neutral → no clear directional positioning.
Summary:
Leverage has been flushed. Market is now in a repositioning phase.
A new OI expansion is needed for a clear trend.
#BTC #Bitcoin
KriptoHolder 🔔@kriptoholder
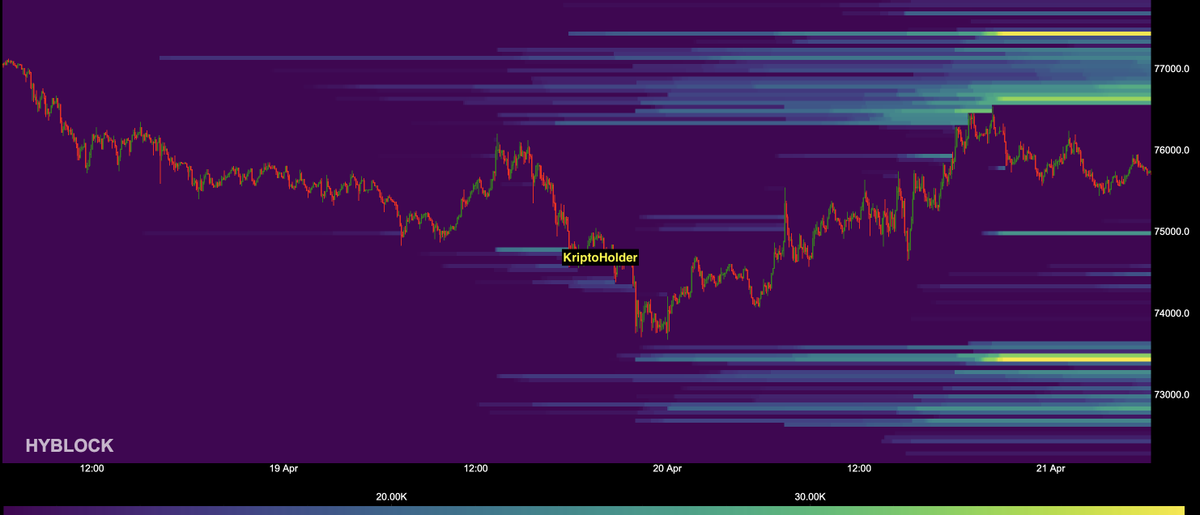
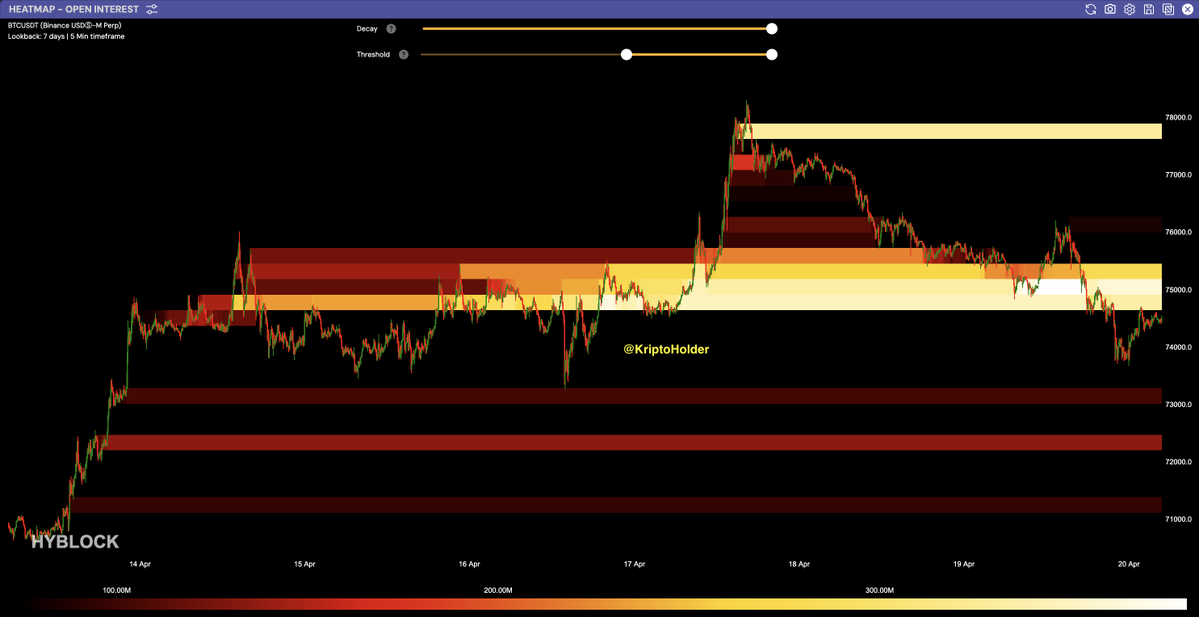
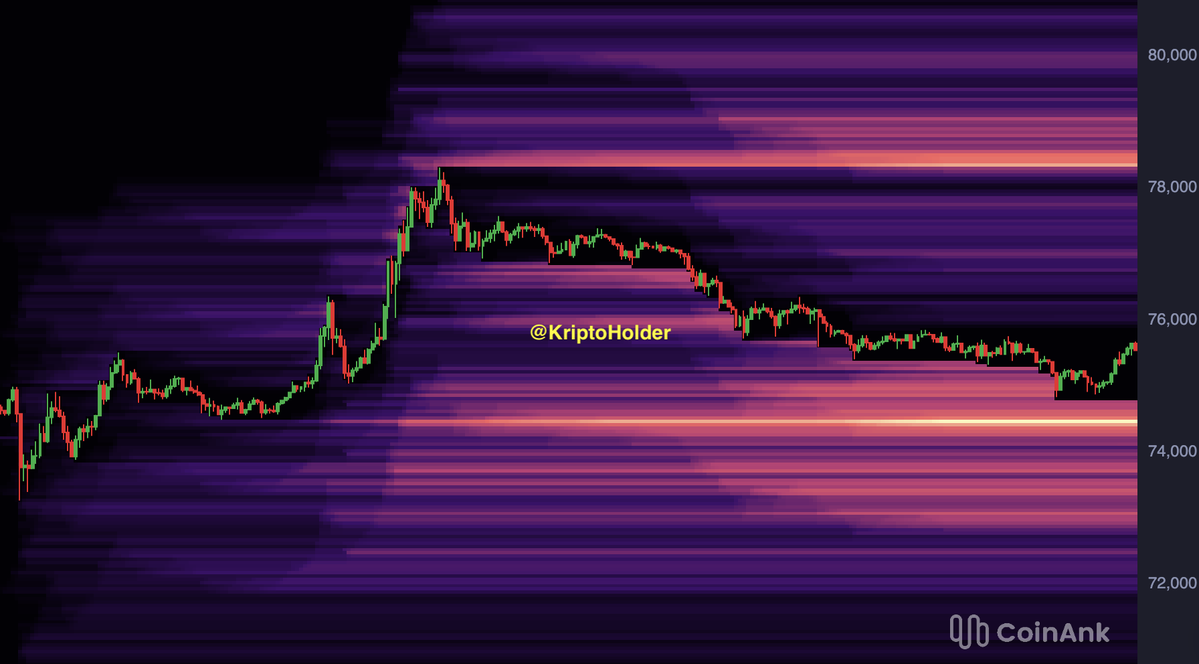
The most concentrated (bright yellow) areas on the BTC liquidity map are: $73K – $73.5K $77K – $77.4K These two levels are the market's main liquidity targets.#BTC #Bitcoin
English