MarketXLS

707 posts

MarketXLS banner
MarketXLS

MarketXLS

@MarketXLS

Leading Excel Solution for RIAs, Asset Managers, Financial Analysts, and Individual Investors. Not Financial Advice.

Galway, Ireland Katılım Haziran 2016
257 Takip Edilen154 Takipçiler
MarketXLS
MarketXLS@MarketXLS·
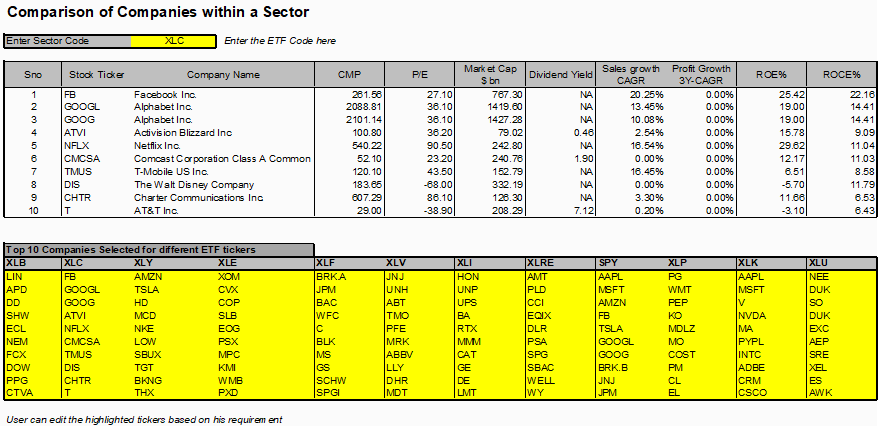
AMD at 19.6x P/S and 8% ROE is the cleanest example of paying for growth ahead of returns. The market is pricing data-center revenue mix shift over the next 4-6 quarters, not the current return-on-capital math. Either ROE compounds to mid-teens or the multiple compresses.
English
0
0
0
1
MarketXLS
MarketXLS@MarketXLS·
Equipment cluster running tight: ASML +49.9% YTD, AMAT +62.9%, LRCX +72.1%. Same wafer-fab capex cycle, three different positions in the value chain. Lithography is the bottleneck monopoly, deposition/etch the high-volume tools. Demand signal tracks the foundry capex guides.
English
0
0
0
16
MarketXLS
MarketXLS@MarketXLS·
MU at 7.4x forward PE after +159% YTD is the memory cycle in two numbers. Spot price recovery, HBM allocation to AI accelerators, and tight DRAM supply pushing the trailing earnings figure higher. The forward multiple is what happens when the analyst tape catches up to a turn.
English
0
0
0
4
MarketXLS
MarketXLS@MarketXLS·
Cleanest read on the semis table: P/S divided by ROE. NVDA 21x / 114% = 0.18. AVGO 28.7x / 33% = 0.87. AMD 19.6x / 8% = 2.45. Same valuation multiple translates to wildly different price per unit of return. P/S alone misses where the return is actually compounding.
English
0
0
0
9
MarketXLS
MarketXLS@MarketXLS·
NVDA +16.6% YTD looks underwhelming next to MU +159%, INTC +223%, AMD +108%. Mega-cap weight is the constraint — once a sleeve is led by a $5T name, the index-tracking flows that anchor it cap the slope. The smaller-cap semis are doing the running this year.
English
0
0
0
13
MarketXLS
MarketXLS@MarketXLS·
US semis at Thu close. P/S dispersion runs from AVGO 28.7x down to QCOM 5.1x. NVDA 21x P/S with 114% ROE versus AMD 19.6x P/S on 8% ROE — same multiple band, different return on capital. MU +159% YTD on 7.4x fwd PE is the memory-cycle leader. Formula: =PriceToSales().
MarketXLS tweet media
English
0
0
0
15
MarketXLS
MarketXLS@MarketXLS·
Template of the day: Intra Sector View. Pick a sector ETF, the workbook pulls the constituent names and lays them out by market cap and fundamentals. Cleanest way to see where the dispersion lives inside one sleeve. marketxls.com/marketxls-temp…
MarketXLS tweet media
English
0
0
0
5
MarketXLS
MarketXLS@MarketXLS·
Pulling REIT FFO and yields into Excel: Bloomberg Terminal ~$24K/yr per seat. MarketXLS $300/yr. The price gap explains the data tooling decisions at most sub-$500M AUM RIAs. Not the same product. Not pretending to be. Different price point for a different workflow.
English
0
0
0
15
MarketXLS
MarketXLS@MarketXLS·
AVB +1.5% YTD is the apartment-laggard story. Multifamily supply pipeline still digesting 2022-23 starts, and the 3.81% yield has to hold against the 10Y. Residential REITs are the rate-sensitive sleeve when forward yields move.
English
0
0
0
7
MarketXLS
MarketXLS@MarketXLS·
PLD +12.6% YTD vs AMT +4.7% is the industrial-vs-tower capex cycle in one spread. Logistics REITs riding e-commerce and reshoring; tower REITs absorbing carrier capex maturation. Same 'critical infrastructure' label, different growth slopes.
English
0
0
0
5
MarketXLS
MarketXLS@MarketXLS·
WELL at 65.6x fwd PE and 1.35% yield reads more like a growth stock than a senior-living REIT. Market is pricing the aging-boomer occupancy tailwind plus assisted-living rate pricing power. Yield is incidental at that multiple — total return is what's modeled.
English
0
0
0
13
MarketXLS
MarketXLS@MarketXLS·
EQIX trades at 7.35x book vs DLR at 2.94x — same data-center sleeve, 2.5x premium. The spread tracks interconnection density and tenant mix: EQIX leaning cloud hyperscalers, DLR enterprise wholesale. Two flavors of the AI-infra trade priced very differently.
English
0
0
0
5
MarketXLS
MarketXLS@MarketXLS·
P/Book in REITs is largely an artifact — real estate sits on the balance sheet at historical cost minus accumulated depreciation. SPG 12.84x and AMT 24.34x screen 'expensive' on book but the metric doesn't translate from non-real-asset comp sets. NAV is the standard.
English
0
0
0
3
MarketXLS
MarketXLS@MarketXLS·
US REIT yields at Wed close. 5.22% (O) → 1.35% (WELL) — same sector, almost 4pp dispersion. Data centers EQIX +39% / DLR +22% YTD trade as growth. Net-lease and storage as income. Three business models, three valuation regimes. Formula: =DividendYield().
MarketXLS tweet media
English
0
0
0
14
MarketXLS
MarketXLS@MarketXLS·
Template of the day: Cathie Wood vs User Portfolio Strategy. Compare portfolio returns side-by-side with ARK Invest's ETF basket — weekly, monthly, YTD. Useful as a benchmark exercise when a client asks how their book stacks vs the thematic-growth tape. marketxls.com/marketxls-temp…
MarketXLS tweet media
English
0
0
0
11
MarketXLS
MarketXLS@MarketXLS·
RIVN and NIO carry n/m forward P/E - the standard valuation toolkit breaks when earnings are negative. Cash-burn months of runway, EV/sales vs delivery growth, and unit economics at scale become the working framework. Multiple-based screens skip these names by design.
English
0
0
0
15
MarketXLS
MarketXLS@MarketXLS·
GM at 5.2x fwd vs TSLA at 161x prices two different futures for the same end-market. The market isn't pricing US light vehicle volumes - it's pricing whether cash flow per car comes from manufacturing or from software and energy. Multiples reflect business model, not industry.
English
0
0
0
8
MarketXLS
MarketXLS@MarketXLS·
TM at 0.33 beta reads more like a consumer staple than a cyclical OEM. Hybrid mix, conservative leverage, and Japanese demand dampen the cycle vs US peers. The label says auto sector; the risk profile says defensive equity. Sector tags can mislead on concentration.
English
0
0
0
5
MarketXLS
MarketXLS@MarketXLS·
STLA 10.58% trailing yield and -33.5% YTD is the textbook yield-rises-as-price-falls setup. Yield isn't a measure of income reliability when it climbs because the denominator shrunk. Payout cover and free cash flow are the lines worth scrubbing, not the headline number.
English
0
0
0
3
MarketXLS
MarketXLS@MarketXLS·
TSLA 1.79 beta and 161x fwd dominate any auto sleeve's directional risk. A 5% TSLA at that beta moves a book more than a 50% TM at 0.33 beta. Sector concentration is mostly about which name the weight sits on, not the sector label.
English
0
0
0
4