Sabitlenmiş Tweet
Tableau Public
6.1K posts
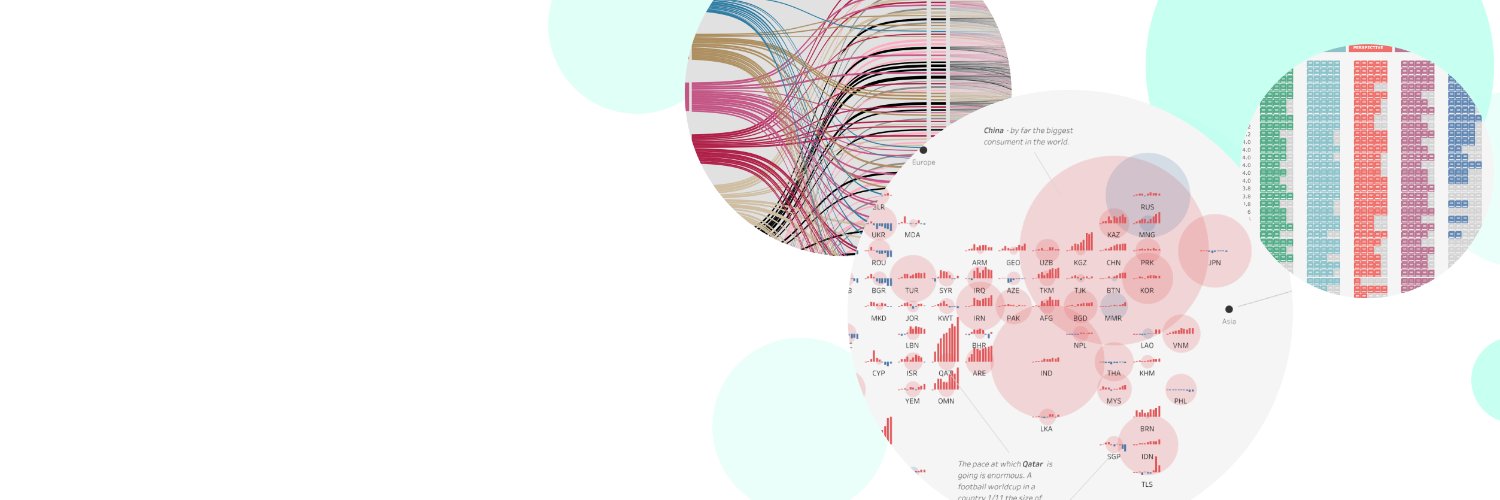

Tableau Public
@tableaupublic
Share, create, and explore @Tableau data visualizations for free on Tableau Public. For more inspiration, view our #VizOfTheDay and connect with our #DataFam ❤️
United States Katılım Mart 2012
1.2K Takip Edilen71.1K Takipçiler
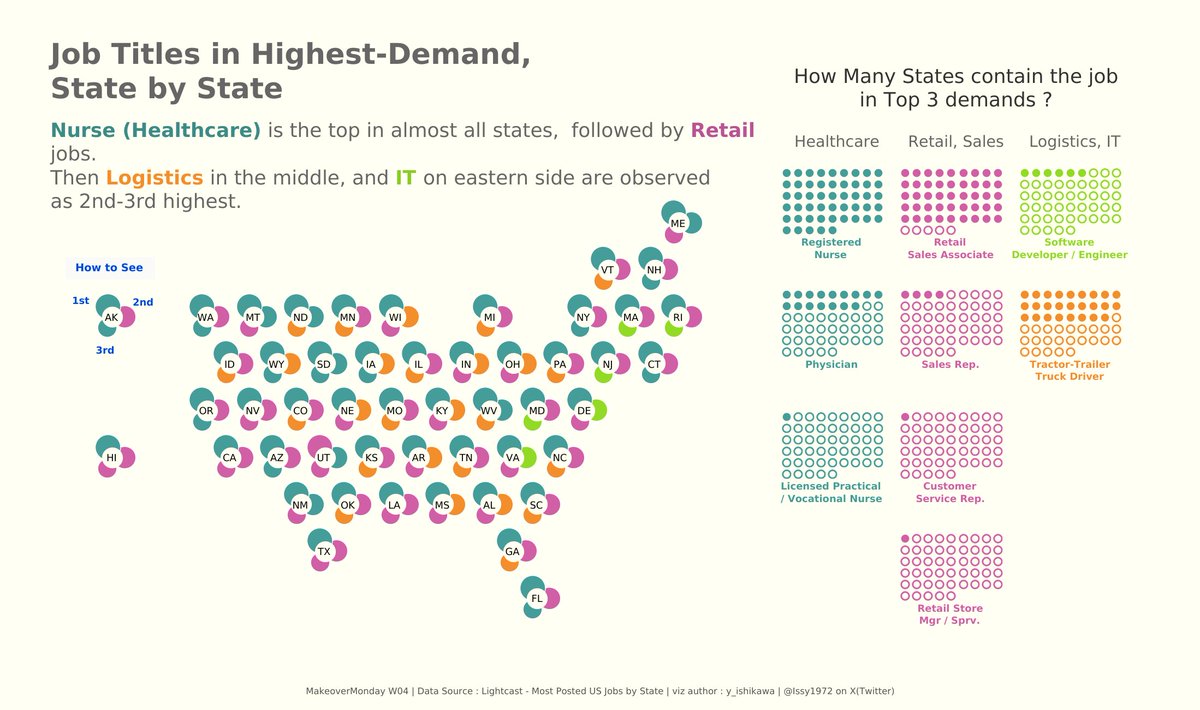
This #VizOfTheDay by @Issy1972 uses a symbol map of U.S. states with dot matrix charts to show how frequently different job titles appear among the top three in-demand roles in a #MakeoverMonday challenge.
Explore the viz on Tableau Public. tabsoft.co/4lJghIj
English
In this #VizOfTheDay, @polygonmap explores whether schools build the life skills students need. Using Alberta’s Education Satisfaction Surveys (2017–2021), small-multiple lollipop charts compare public perceptions across key competencies.
Explore the viz on Tableau Public. tabsoft.co/4uxOYV7

English
This #VizOfTheDay by @4accountability tracks global energy investments from development banks. It highlights financing trends, risk ratings, and more.
Explore the viz on Tableau Public. tabsoft.co/4rHL49N

English
In this #VizOfTheDay, @ScottKimly visualizes Cambodian cuisine using radial diagrams, timelines, maps, charts, and an ingredient heatmap to weave cultural data with personal memory.
Explore this Top 10 #IronViz entry on Tableau Public. tabsoft.co/4uz9PYf

English
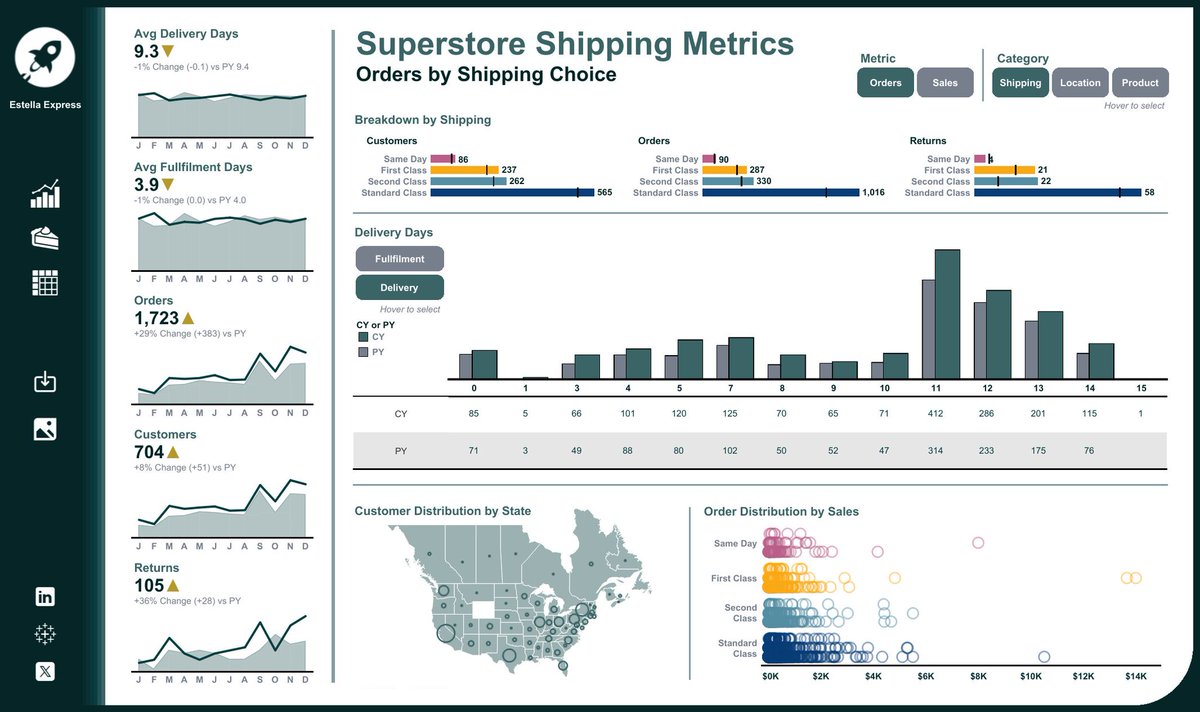
This #VizOfTheDay by @JohnSJohansson tracks shipping metrics using the Superstore dataset, comparing current and previous year performance across sales, orders, and delivery days.
Explore the viz on Tableau Public. tabsoft.co/40uWlz3
English
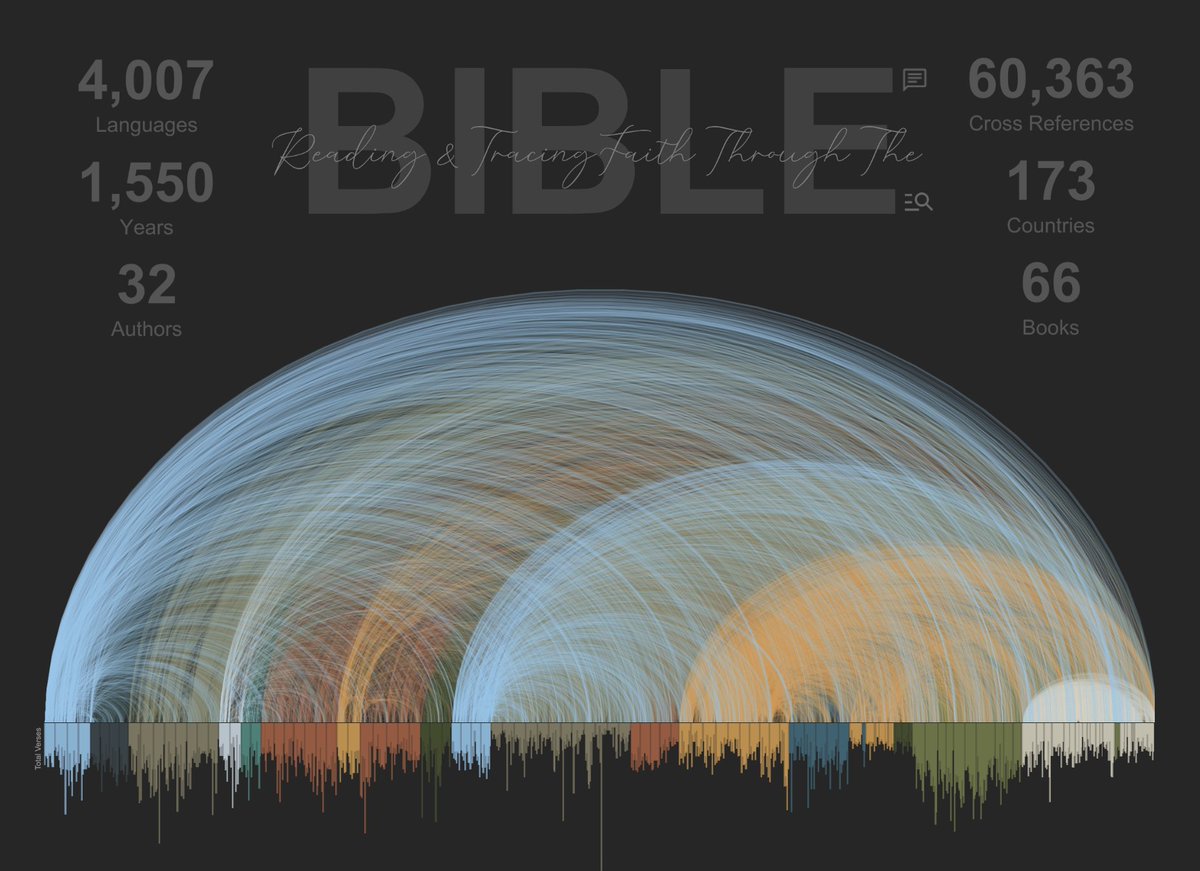
In this #VizOfTheDay, @jreevers5 maps the Bible as a network of sweeping arc connections, revealing how thousands of cross-references link books, themes, and passages across Scripture.
Explore the viz. tabsoft.co/4s4cYh3
English
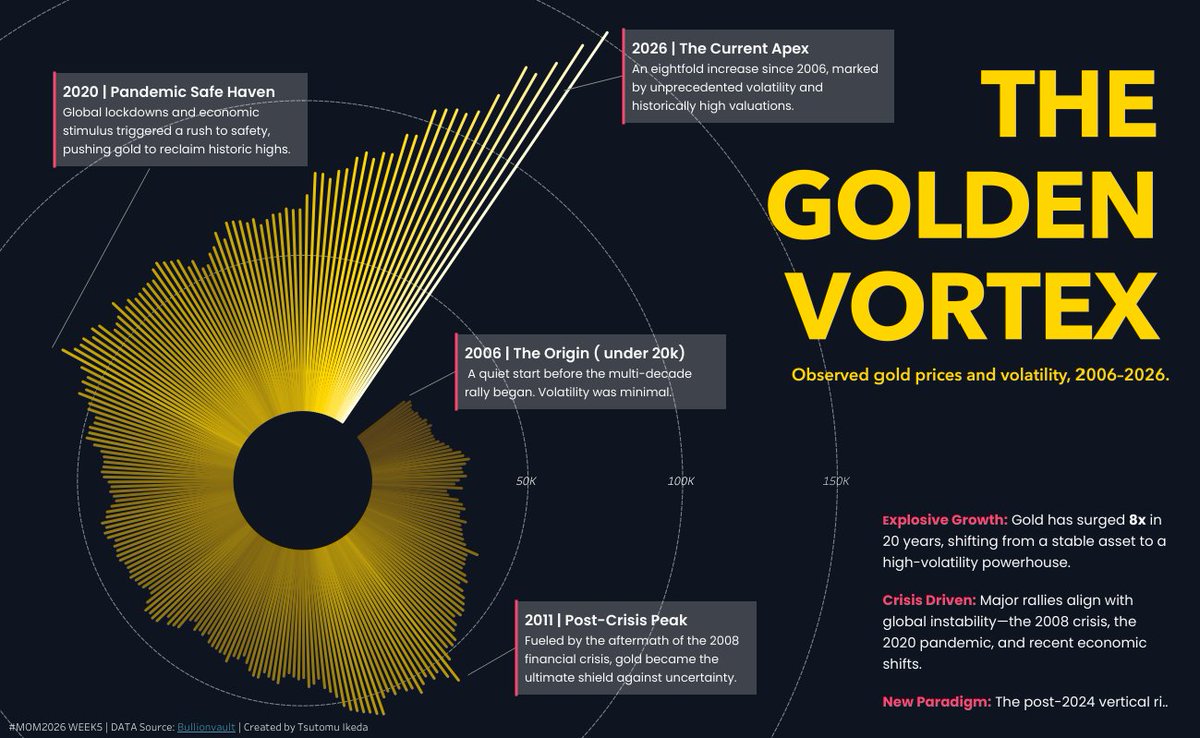
In this #VizOfTheDay, @TIkeda93820944 analyzes gold prices from 2006-2026 using a radial chart that highlights key spikes and nearly 8x growth over two decades.
Explore this #MakeoverMonday entry. tabsoft.co/4bF7KlZ
English
This #VizOfTheDay by Kelsey Oehrke provides a marketing campaign overview, tracking key metrics such as conversion rates to evaluate campaign effectiveness.
Explore the viz. tabsoft.co/4lcBY2U

English
This #VizOfTheDay by Stephen Detzel, a Top 10 #IronViz Qualifiers entry, examines the global banana industry across production, trade, nutrition, and affordability.
Through treemaps, flow maps, ranked bars, and time-series charts, see how bananas are more than just a snack. tabsoft.co/4deL8dj

English
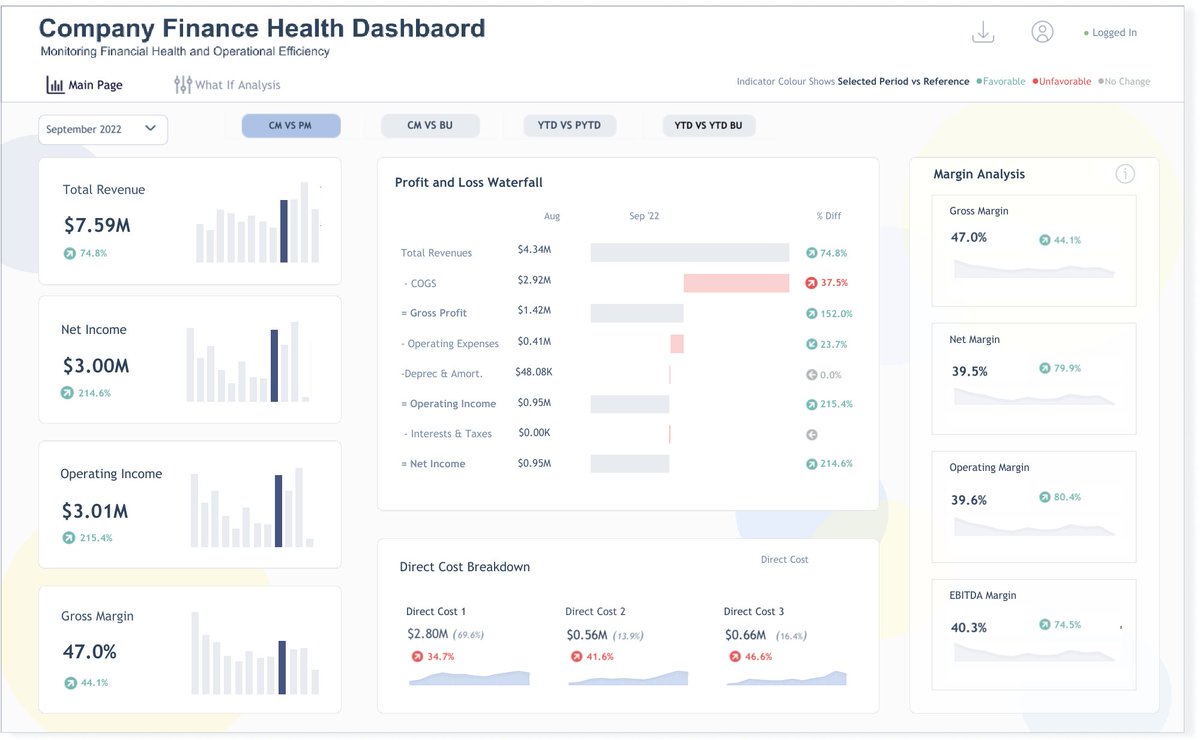
This #VizOfTheDay by Emmanuella Tudome monitors company financial health, tracking revenue, and more. It features a what-if forecast to analyze profit and loss trends.
Explore the viz. tabsoft.co/4rePlRD
English
Explore this #VizOfTheDay by @alphacentauri featuring a custom radar chart with a built-in “microscope,” created without table calculations or extensions.
Check out the viz. tabsoft.co/4rgDlzb

English
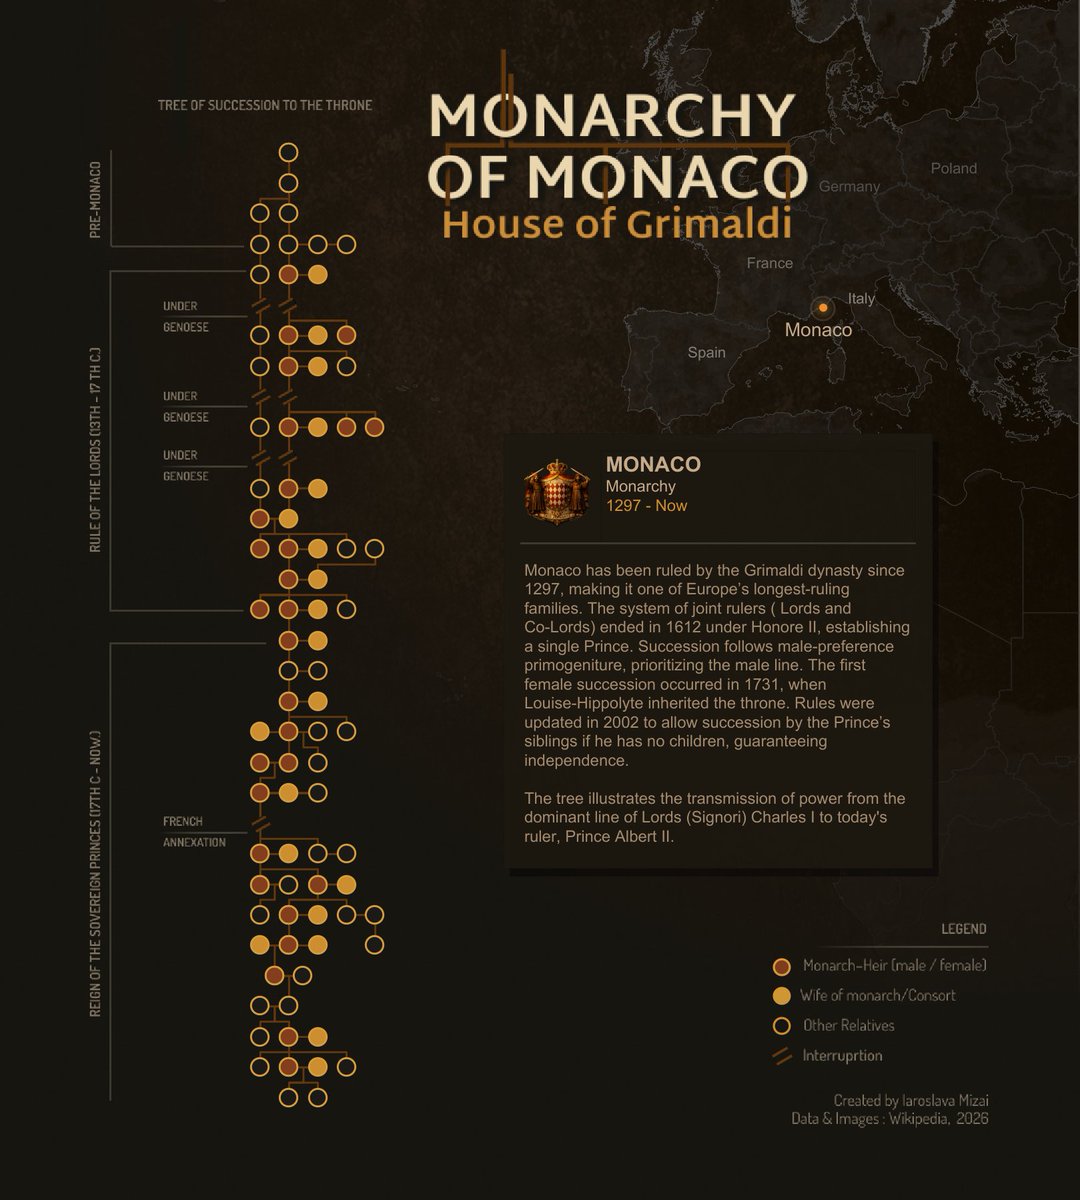
This #VizOfTheDay by Iaroslava Mizai uses a custom node-link diagram to map 700+ years of Monaco’s royal succession, with calculated fields, layered marks, and visual encoding to represent lineage, consorts, and political transitions.
Explore the viz. tabsoft.co/4skj9x8
English
This #VizOfTheDay by @Alicemrooney provides a detailed HR headcount and performance overview, tracking employee growth, salary distributions, and satisfaction ratings across various departments.
Explore the viz. tabsoft.co/4r8F3Cz

English
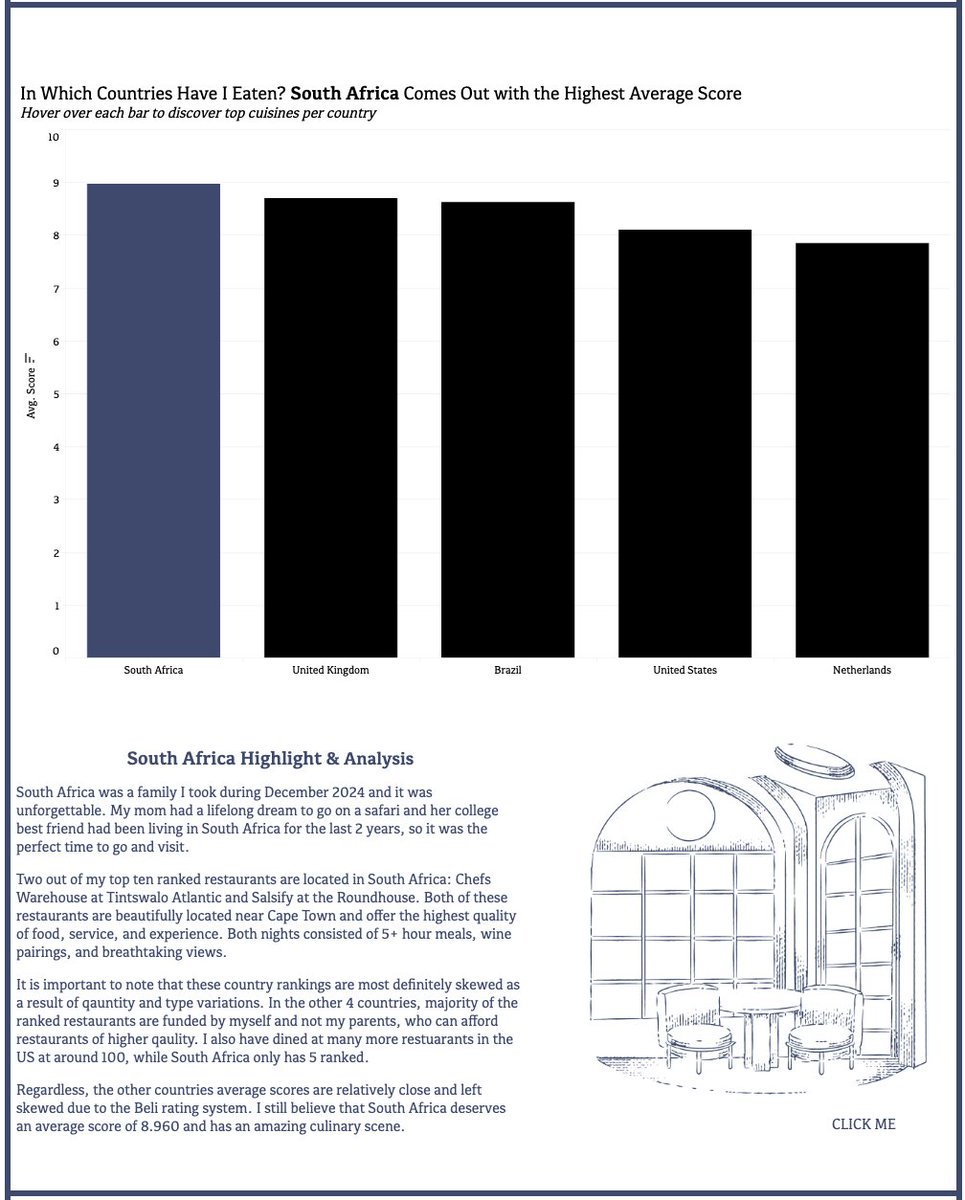
In this #VizOfTheDay, Hanne de Bie analyzes restaurant experiences, ratings, and ordering habits in her student #IronViz winning entry. A three-part navigation flow guides viewers to one key question: why cook at home?
Explore the viz. tabsoft.co/3OKqwzG
English
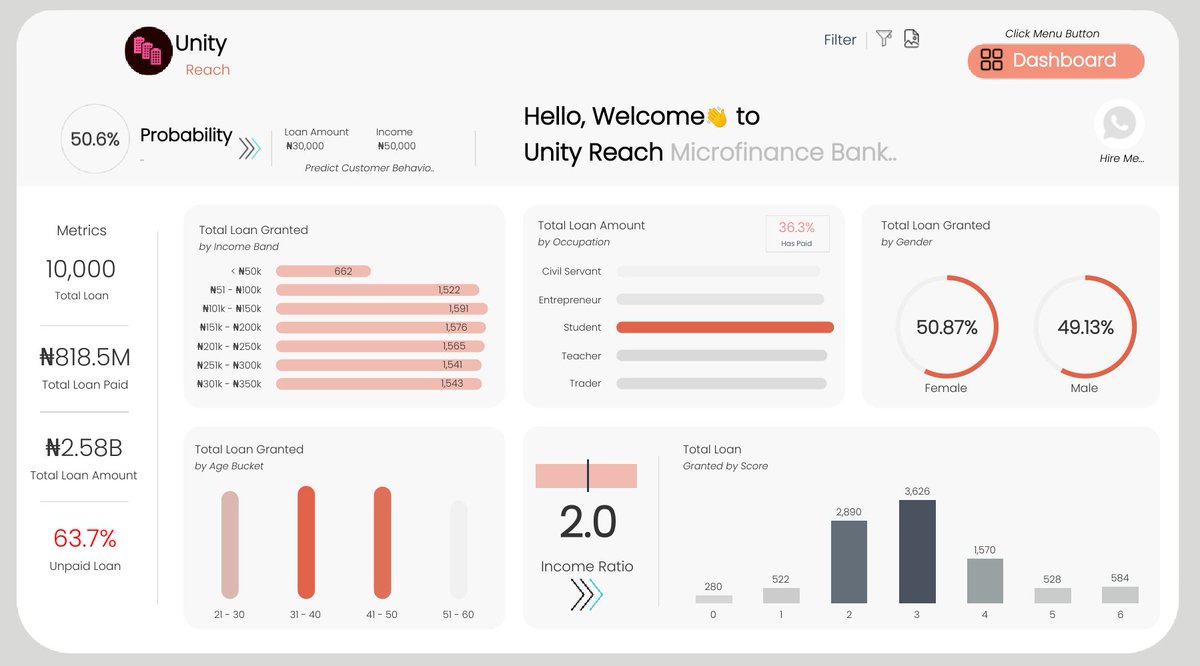
This #VizOfTheDay by @Gospelchinex explores microfinance loan behavior using predictive metrics to visualize a customer's probability to repay based on income, age, and loan history.
Explore the viz. tabsoft.co/4rRSvfu
English
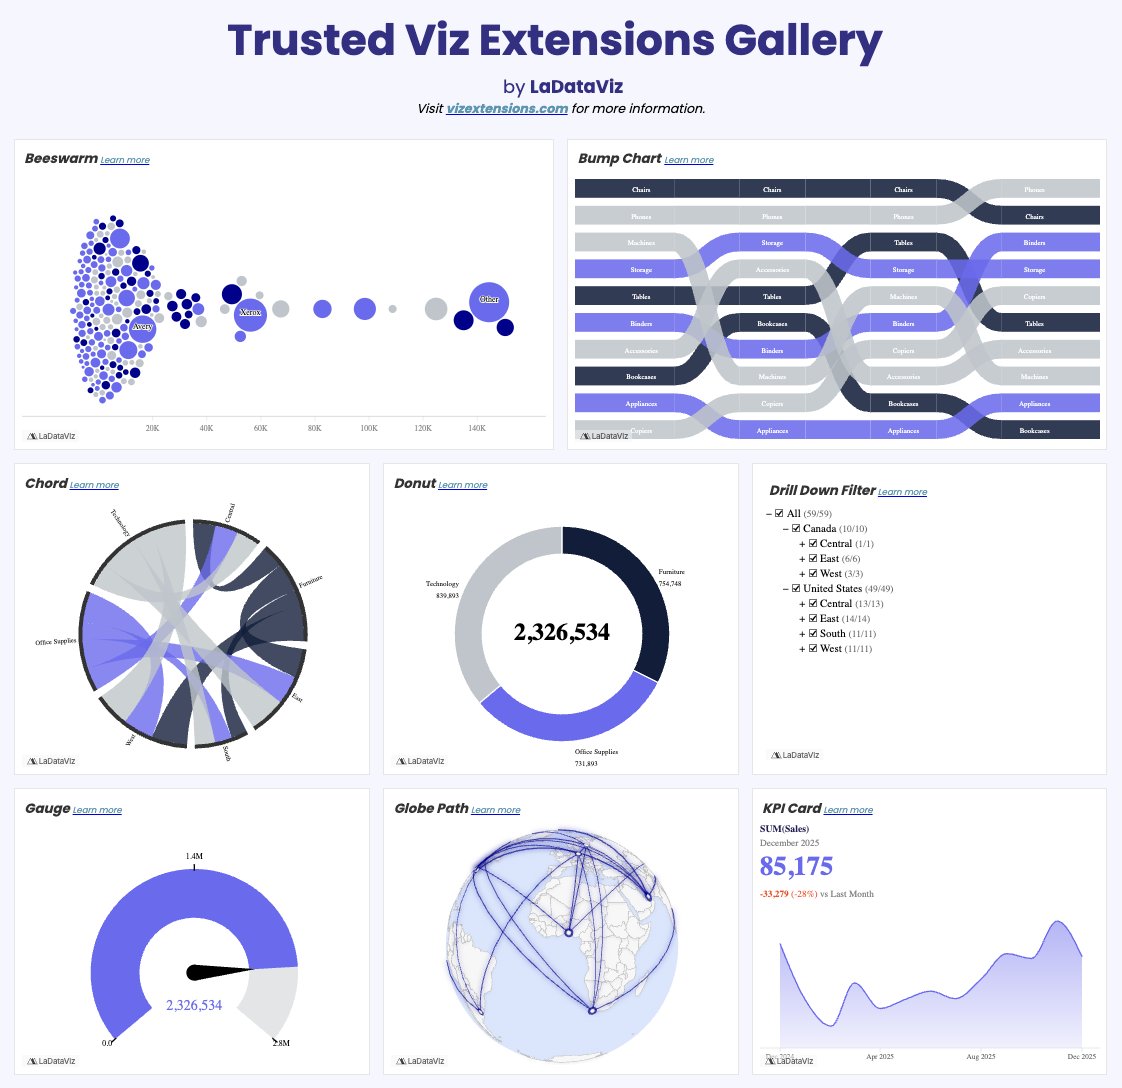
This #VizOfTheDay by @LaDataViz serves as a Viz Extensions Gallery, showcasing a variety of advanced, trusted chart types—from Sankeys and Chord diagrams to Voronoi Treemaps.
Explore the viz. tabsoft.co/4011Bdl
English
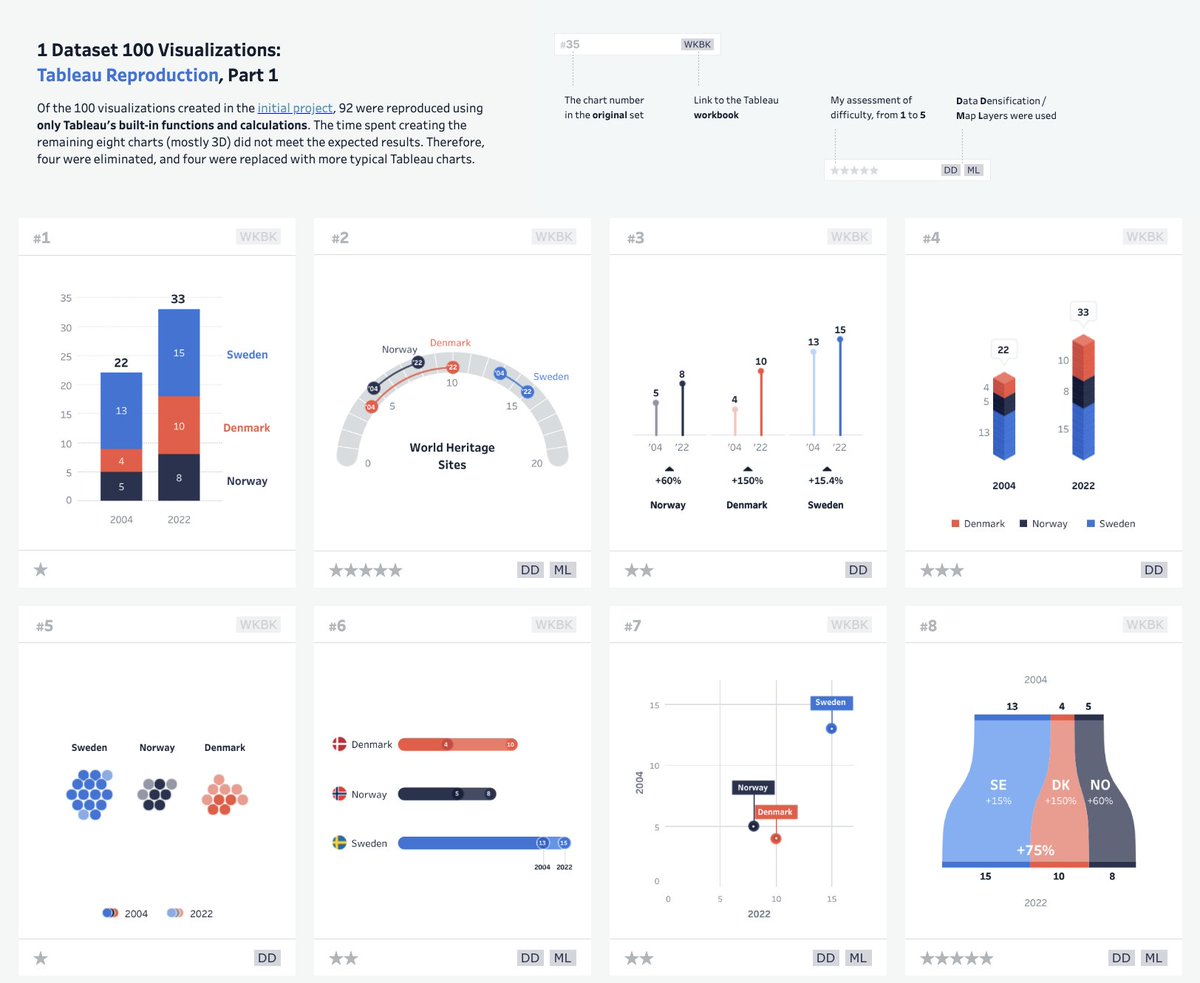
Explore this #VizOfTheDay by @ta___kaya to see how a single dataset can be visualized a hundred different ways—from bars to radials to waffles and beyond.
Check out the viz. tabsoft.co/4tYckTx
English
This #VizOfTheDay by Mykhailo Tsyhanok provides a comprehensive purchase order overview that streamlines procurement workflows and offers accessibility in eight languages, including English, Japanese, and Chinese.
Explore the viz. tabsoft.co/3ZQDrlV

English
What will astronauts eat on the way to Mars? In this #VizOfTheDay, Ann Pregler explores how fresh-grown food could boost morale, appetite, and long-term health on long-duration missions and why zero-gravity lettuce might be mission-critical.
Dive into this finalist #IronViz entry and build your own space salad. Explore the viz. tabsoft.co/3OxdRA0

English