

TradeWithSarthak
86 posts
TradeWithSarthak
@TWS_EDUCATES
We at TradeWithSarthak are providing Institutional level analysis on all major exchanges and across all asset classes.
Katılım Mart 2023
1 Takip Edilen7 Takipçiler
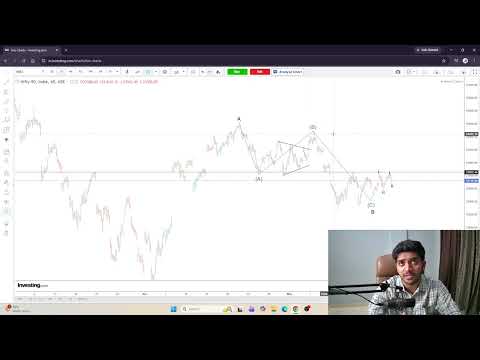
Moving Average Cheat Sheet:
• 5 EMA : ⚡ Momentum
• 10 EMA: 📷 Short-term trend
• 20 EMA: 📷 Strong uptrend support
• 100 SMA: 📷 Dip buy alert
• 200 SMA: 📷 Fair value 🔄💰
English
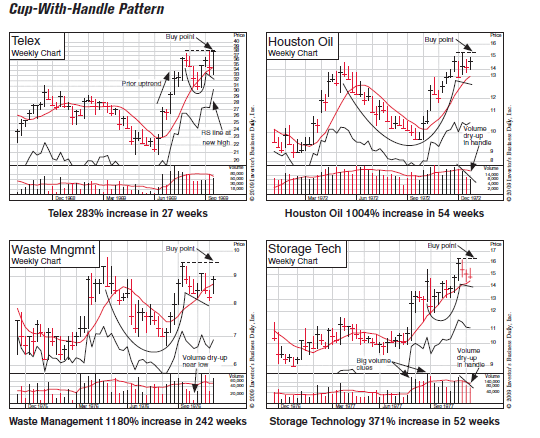
The "Cup-With-Handle" is a masterclass in psychology. ☕📈 Look for:
A prior uptrend
Volume drying up in the handle (less selling pressure)
A breakout at the "Buy Point" Historical gains like Houston Oil’s 1004% are why traders study these patterns. #TradingTips #StockMarketIndia
English

TradeWithSarthak retweetledi

Probability ≠ Certainty ⚖️
Natural Gas moved overnight 🚀
Short sellers panicked 😨
Forced exits = volatility explosion 💥
Markets don’t care who you are.
They only care where your risk is 📊
This reel isn’t against option selling.
It’s a reminder:
Survival > Confidence 🧠
English
TradeWithSarthak retweetledi
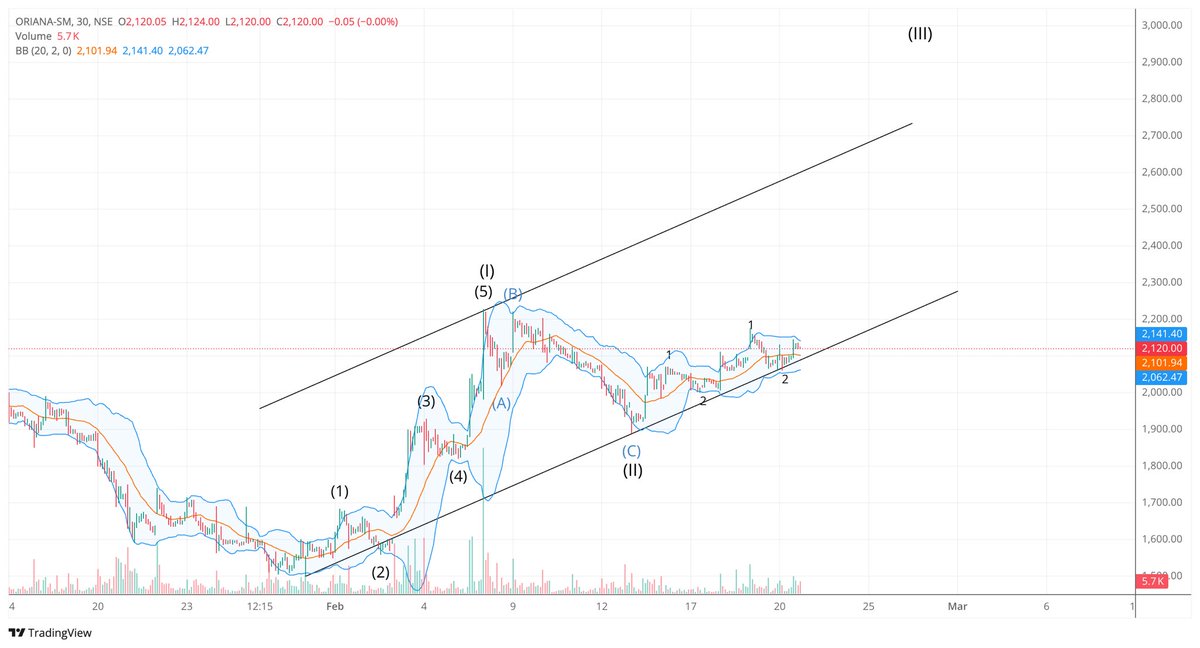
@meetcrazydude Its a long term view 2-4 years is what we are thinking , 6000-7500 is a very good conservative target
English

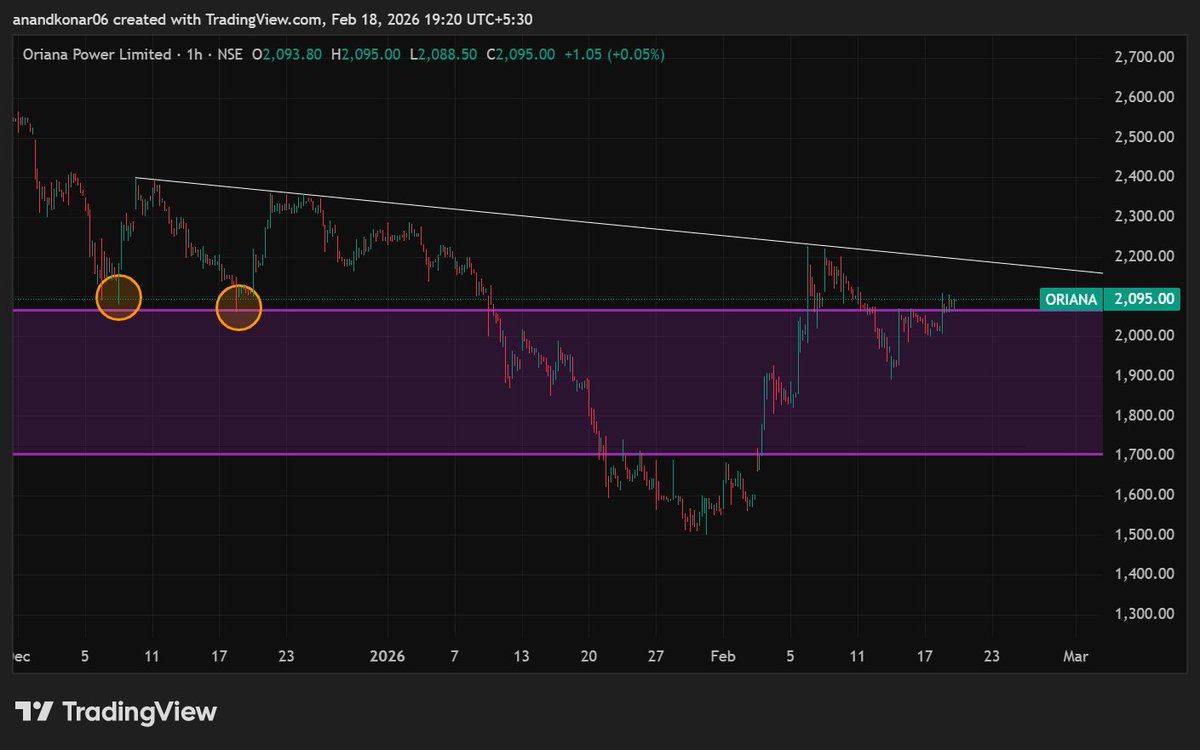
oriana power target expected to be 10000
yes you are reading it right!!
#Oriana #orianapower #sme #StockMarketIndia #IPO #multibaggers
English
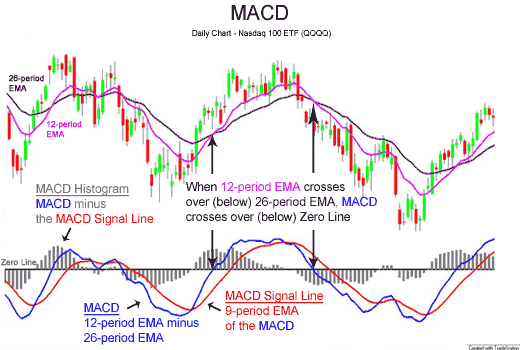
MACD isn’t magic — it’s momentum visualized.
Signal line cross → momentum shift
Zero line cross → trend confirmation
Histogram → strength of the move
Use it to read pressure, not predict tops & bottoms
English
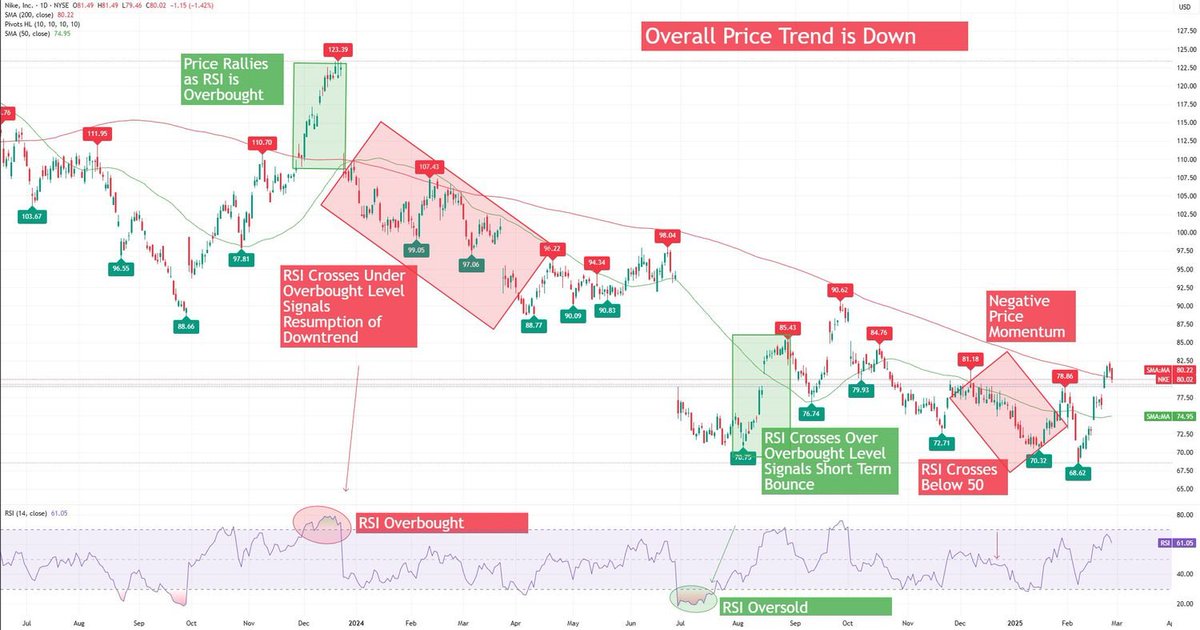
RSI isn’t a buy/sell button — it’s a context tool.
In a downtrend:
• Overbought = rally exhaustion
• Oversold = bounce zone
• Below 50 = bearish pressure
Trend decides how you read momentum. Trade the context, not the indicator.
English
elliott Wave + Fibonacci: Critical Gap & Trend Channel: This shows a 5-wave impulse move (1–5) following Elliott Wave Theory.

English
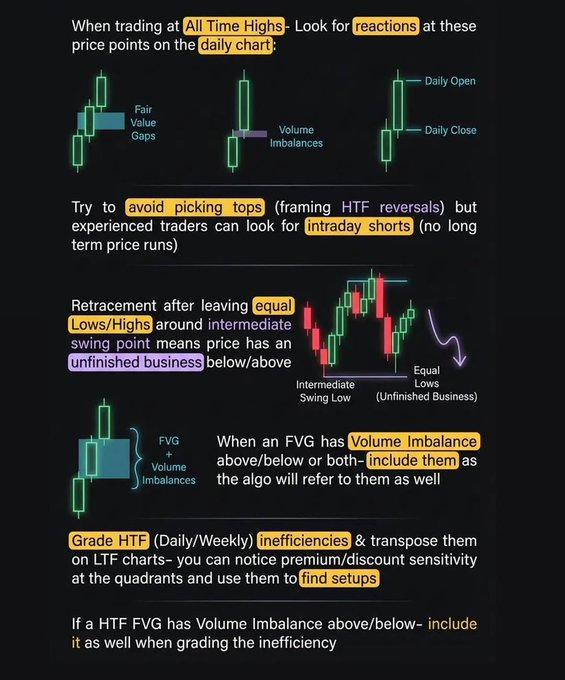
Smart money trading isn’t magic — it’s structure + liquidity + patience.
9 core concepts to study:
• Order blocks
• Fair value gaps
• Supply & demand zones
• Change of character
• Break of structure
• Liquidity pools
• Stop-loss hunts
• False breakouts
• Kill zones
Learn the story price is telling — not just the candles.
Educational only. Study before risking capital.

English
📊 Balance sheet — simple explanation
A balance sheet shows what a company owns, what it owes, and what belongs to shareholders at a specific moment.
1️⃣ Assets — what the company owns
Resources that have value.
Short-term assets
Cash
Inventory
Receivables
Long-term assets
Buildings
Equipment
Property
These help the company generate income.
2️⃣ Liabilities — what the company owes
Debts or obligations.
Short-term liabilities
Accounts payable
Bills due soon
Long-term liabilities
Bonds
Loans
These are claims against the company’s assets.
3️⃣ Equity — owner/shareholder value
What remains after debts are paid.
Formula:
👉 Assets = Liabilities + Equity
Equity includes:
Share capital (money investors put in)
Retained earnings (profits kept in the business
English
NIFTY 50: Bull & Bear Markets (Since 2002)
📈 Bull Markets
• 2002–2004 : +121%
• 2005–2006 : +180%
• 2006–2008 : +145%
• 2008–2010 : +156%
• 2011–2015 : +106%
• 2016–2020 : +87%
• 2020–2026 : +256%
📷 Bear Markets
• 2004 : −30%
• 2006 : −30%
• 2008 : −59%
• 2010–2011 : −27%
• 2015–2016 : −22%
• 2020 : −38%
English
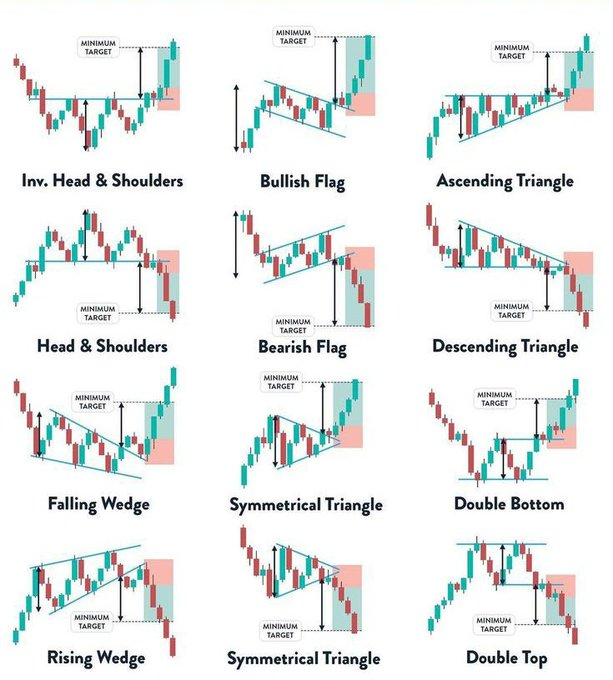
All important patterns in chart, Have a look
show some love by following us!!
English
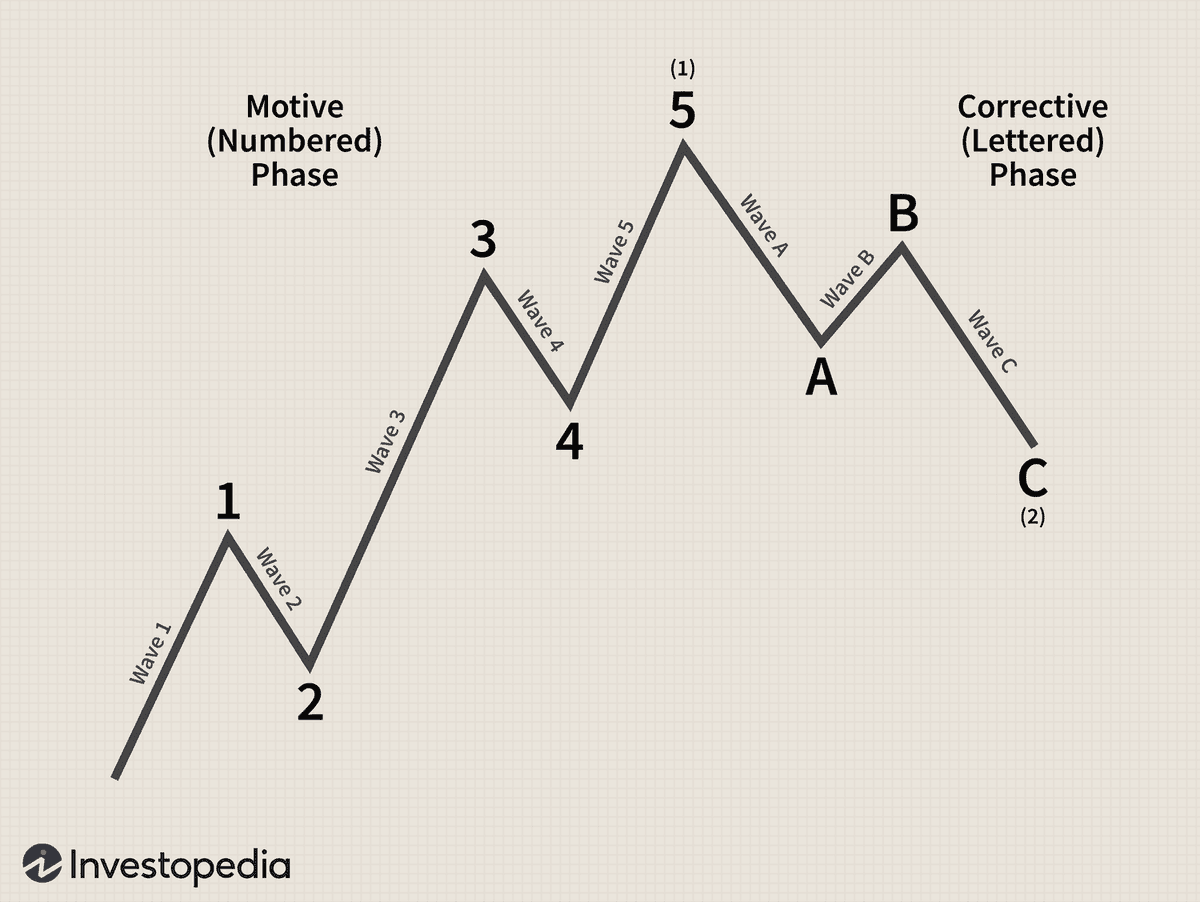
Here’s a simple breakdown of what you’re seeing:
📈 Motive Phase (1–5)
This is the trend move — price pushing in the dominant direction.
Wave 1 — Initial push
Early buyers/sellers step in.
Wave 2 — Pullback
Profit taking, but trend not broken.
Wave 3 — Strong expansion
Usually the longest and strongest wave — momentum floods in.
Wave 4 — Consolidation
Smaller correction, trend pauses.
Wave 5 — Final push
Late participants enter; momentum begins to weaken.
🔄 Corrective Phase (A–B–C)
This is the retracement against the trend.
Wave A — First counter move
Wave B — Temporary continuation illusion
Wave C — Completion of correction
After C finishes, a new motive cycle can begin.
Key trader insights
✅ Wave 3 is often the best risk-reward opportunity
✅ Wave 5 can show exhaustion/divergence
✅ A-B-C correction resets the market structure
Think of it as:
Trend → Pause → Reset → Trend again
English
Markets move in waves, not chaos.
📈 5-wave trend → 📉 3-wave correction
Master the structure and you start seeing where momentum builds… and where it fades.
Structure > emotion. Always.
#trading #elliottwave #PriceAction
English