holger diderich - be water my friend

27.1K posts

holger diderich - be water my friend banner
holger diderich - be water my friend

holger diderich - be water my friend

@artofkaizen

pm, miners & stockmarkets - charts, cycles & elliot waves adventure educator & professional photographer

saarbrücken Katılım Mart 2011
650 Takip Edilen708 Takipçiler
holger diderich - be water my friend retweetledi
Elephant Capital
Elephant Capital@ElephantCapita2·
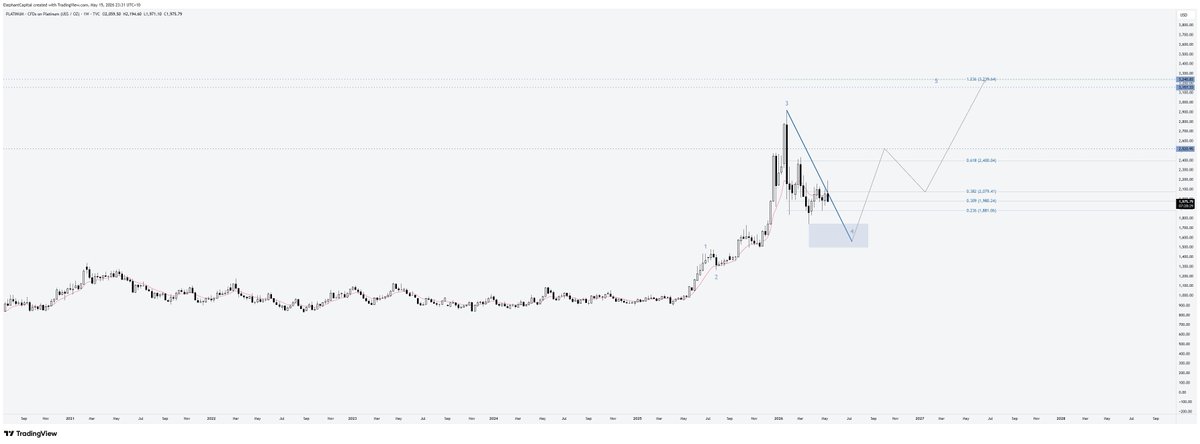
#GOLD update. Looks like it wants to retest the March pivot low ~3900-4000. Big picture, no change to 6500-6700 target. $GLD $GOLD $XAUUSD
Elephant Capital tweet media
English
0
4
39
3.6K
holger diderich - be water my friend retweetledi
Elephant Capital
Elephant Capital@ElephantCapita2·
#PLATINUM big picture to 3100+ in tact, but looks like it wants to retest and undercut the low. Unnerving moment here, which could bring some capitulation. Big opportunity if that happens. $XPTUSD $XPT #PGM
Elephant Capital tweet media
English
0
2
13
1.8K
holger diderich - be water my friend retweetledi
DeepValue Signals
DeepValue Signals@DVSignals·
$SILVER roadmap Rejecting the upper channel / flag zone keeps the failed-breakout thesis alive, with price now sliding back into structure instead of confirming higher. The first key area is 74–75, which is the corrective channel / structure zone; lose that cleanly and the next downside zones are 68–70, then 61–63. With a deeper flush toward the low-50s/high 40s not off the table if the larger corrective pattern fully plays out. Bull case only comes back if silver reclaims 82–86 with acceptance; until then, this still looks more like a corrective squeeze failure than a clean breakout. #DVSTRADING #DISCORD #SUBSTACK
DeepValue Signals tweet media
English
11
15
121
10.8K
holger diderich - be water my friend retweetledi
Pepesso
Pepesso@0xPepesso·
🚨 EVERY MAJOR S&P 500 CRASH WAS PRECEDED BY A MACD PEAK Just look at the chart: 2000 top: MACD peaked at ~100 -> index dropped -49.60% 2008 top: MACD peaked at ~75 -> index dropped -57.69% 2026: MACD is sitting at 496 The peaks that caused 50% crashes don't even register on the same scale as where we are right now Every single time this indicator turned from elevated levels - major crash followed Current reading is 5x higher than anything that preceded a major crash in 30 years of data I don't know exactly when it turns. But when it does, there's no historical reference for what follows Position accordingly!
Pepesso@0xPepesso

🚨 WARREN BUFFETT WENT ALL IN SELLING His sell-to-buy ratio just hit 15:1 This happened only twice in history: Dot-com Bubble crash in 2000 and AI Bubble right now $397,000,000,000 idle in cash Buffett Indicator at 227% vs 88% historical average This man definitely knows something and preparing for max pain scenario Save this. Let's see who's right by Q4.

English
32
78
397
108.7K
holger diderich - be water my friend retweetledi
AskLivermore
AskLivermore@asklivermore·
Listen to me. This is your FINAL warning. This is what will happen. The next cycle is May 25th - June 5th. 1. Trim your winners. Don't sell fully. Take minimum ~20% of your profits and rotate into defense. Or hedge with oil stocks, gold, cash, or puts. 2. AI will keep going up in the future, we're still very early. But $SPY will START its dip of -5% to -10%. 3. This will turn into -20% - 50% dip on high volatility stocks. Why will this happen? 1. It's a natural "breather" before we go up again (3 months of rest). We're too HOT. 2. No more earnings catalyst - we will have a period of LIMBO from June to August. 3. S&P 500 is stretched 15% away from its moving average. This is historically the time to trim. Future forecast? 1. Buy the BIG dip. Markets are still bullish and will continue to go up. What to do? 1. Balanced with AI, international exposure (Japan, Brazil, etc.), precious metals/miners (gold and silver miners), stable compounder companies, cash, and puts. Follow my every move or else you'll lose everything. I've already started to rotate, and I will more.
AskLivermore tweet media
English
211
195
2.8K
459.9K
holger diderich - be water my friend retweetledi
CyclesFan
CyclesFan@CyclesFan·
$Silver - Reached the monthly resistance around 89 yesterday and is having a bearish reversal today. At the moment it's corroborating my expectation for a wave C top. In order to confirm that it has topped silver has to close below 81.34. x.com/CyclesFan/stat…
CyclesFan tweet media
CyclesFan@CyclesFan

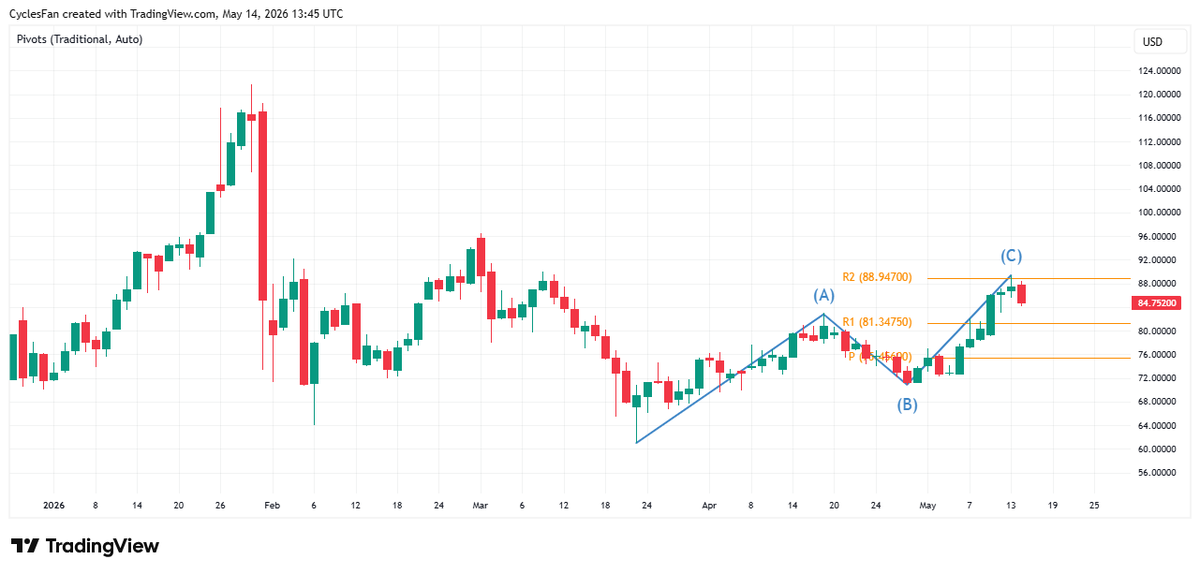
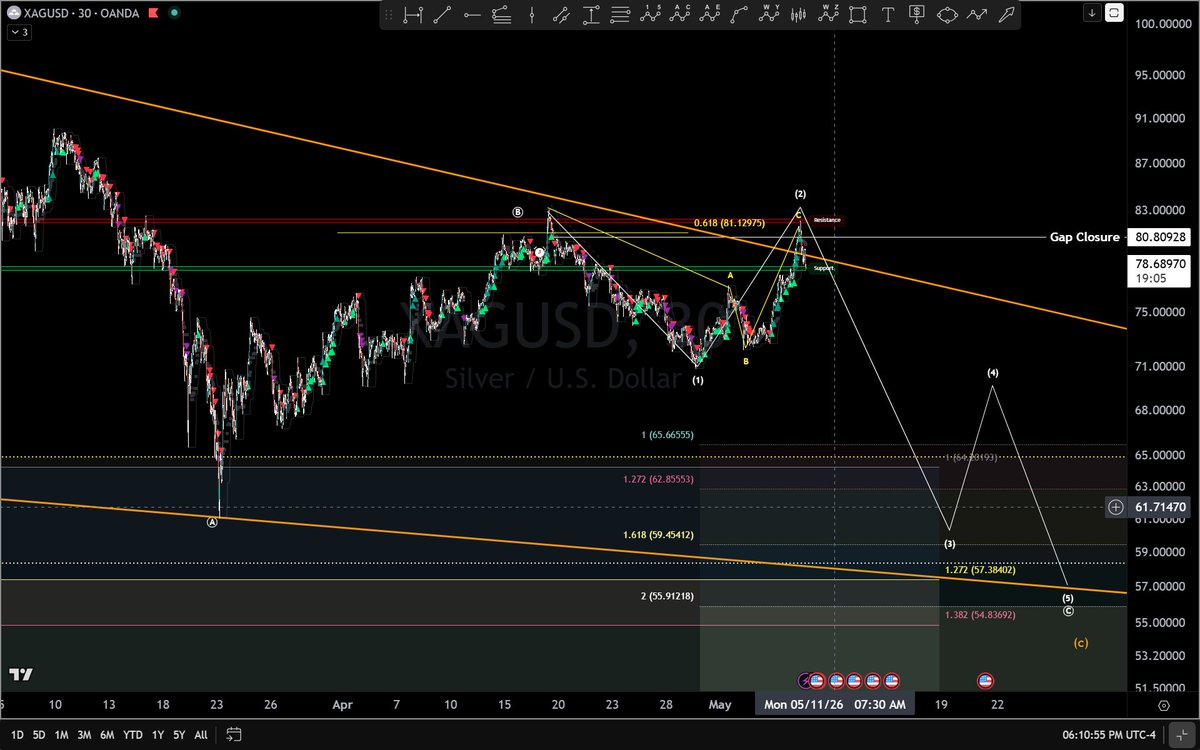
$Silver - This week's action has determined that the rally out of the March low is probably in the form of an ABC with wave C being in progress. A daily close above the resistance at 81.35 will confirm that and lead to further upside to the 2nd monthly resistance at 88.95.

English
4
8
79
11.1K
holger diderich - be water my friend retweetledi
Korinek_Trades
Korinek_Trades@korinek_trades·
5/14 update: $SPY $QQQ 1H/30M views: -Both have completed 5 up in blue -Lower time frame blue is setting up a possible ending diagonal (needs a pullback then pop) -Sequence is nearing completion I think sell can come 🔜 (+/- a week) Good time to lock in some profits IMO
Korinek_Trades tweet mediaKorinek_Trades tweet mediaKorinek_Trades tweet media
English
1
8
32
6K
holger diderich - be water my friend retweetledi
Master WU
Master WU@MasterPandaWu·
FULL-POT SHORT NOW at 7470; Each HAMMER represents 10% of my Strategic Short Portfolio, which I have accumulated 7/17 SPY 700 puts from May 7th. Today's the last portion. Average cost is about 7440. Won't touch this position until May 29th, when the first local bottom will be.
Master WU tweet media
English
56
32
267
56K
holger diderich - be water my friend retweetledi
MCO Global
MCO Global@moretradingonl·
$SILVER has already reacted from the previously discussed support zone between $78 and $84. As long as that region holds, there is still no confirmed signal that a larger top has formed. The short-term trend remains up, with higher highs and higher lows printing since the April 29 low. A meaningful top would still require both a clear 5-wave decline and a break below $78. Until then, the rally from end of April technically stays intact.
MCO Global tweet media
English
3
8
37
5.5K
holger diderich - be water my friend retweetledi
Andrew 🇨🇦
Andrew 🇨🇦@GoldnGuitars·
Update on $SMH; Looks like a roll-over could be in progress. Today should give us a better look if we close with a swing-high - which seems highly probable. TSI reached nearly 99 and is now heavily divergent. $SOXS All this within the context of $SPX hitting 7425, within the range I've been stating would be the top for about 5-6 months now. We may yet see weekly negative divergence show up later in May or early June, but that's just semantics. 4YCH is happening and the decline to a 4YCL is the kind of decline we want to step away from. @Namzes_G
Andrew 🇨🇦 tweet mediaAndrew 🇨🇦 tweet media
Andrew 🇨🇦@GoldnGuitars

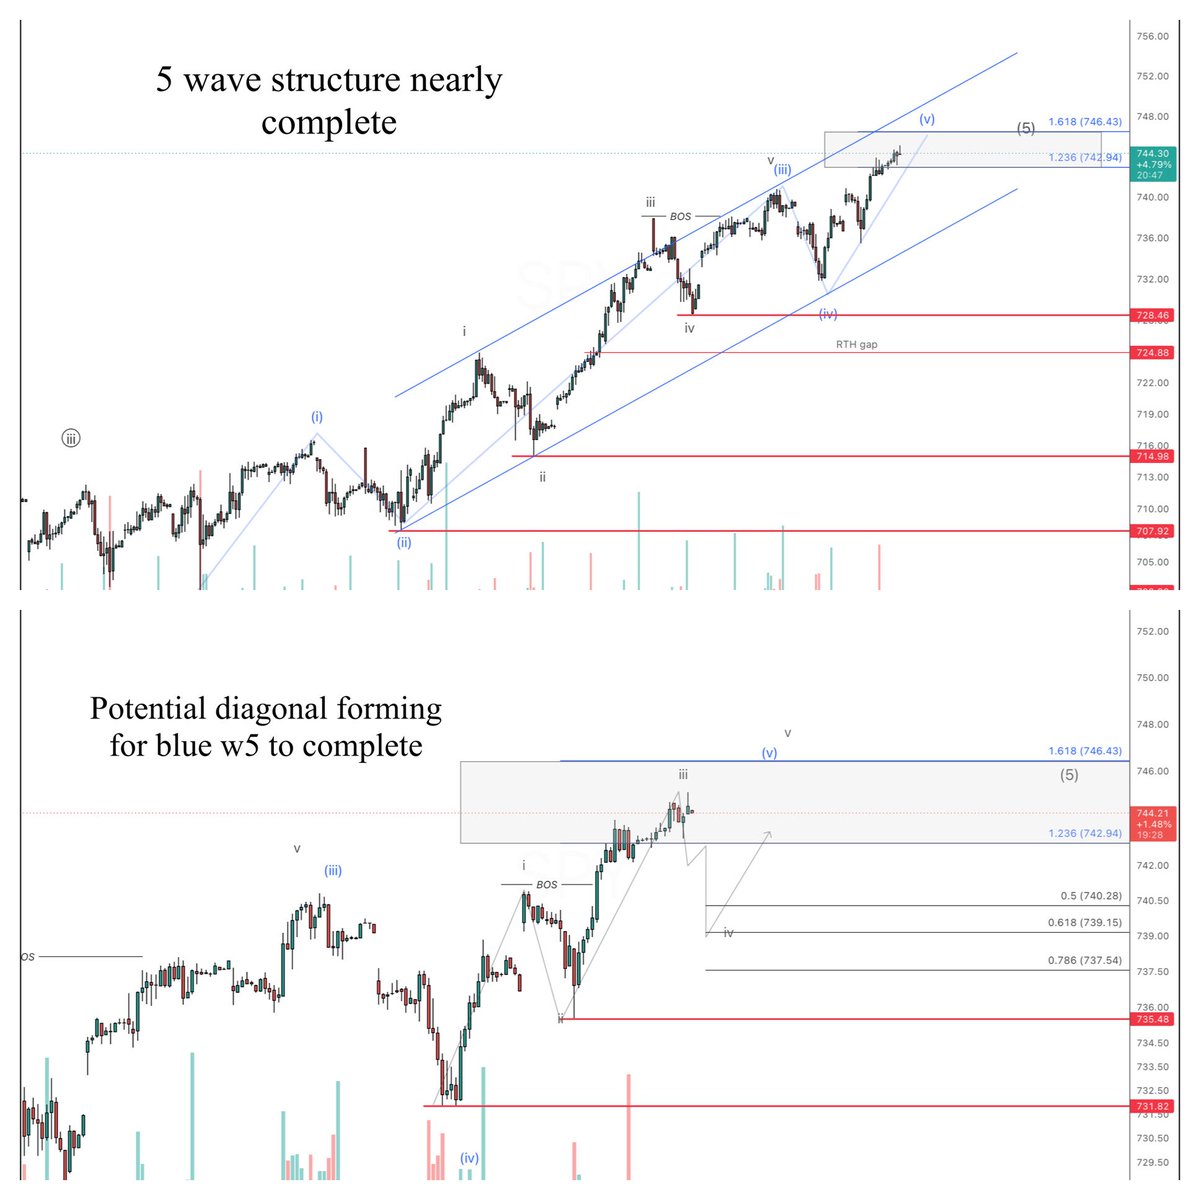
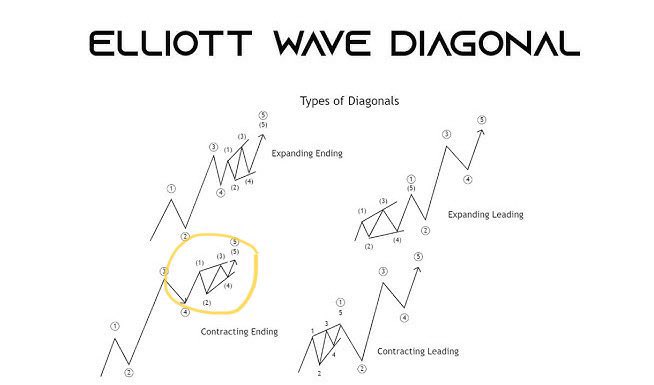
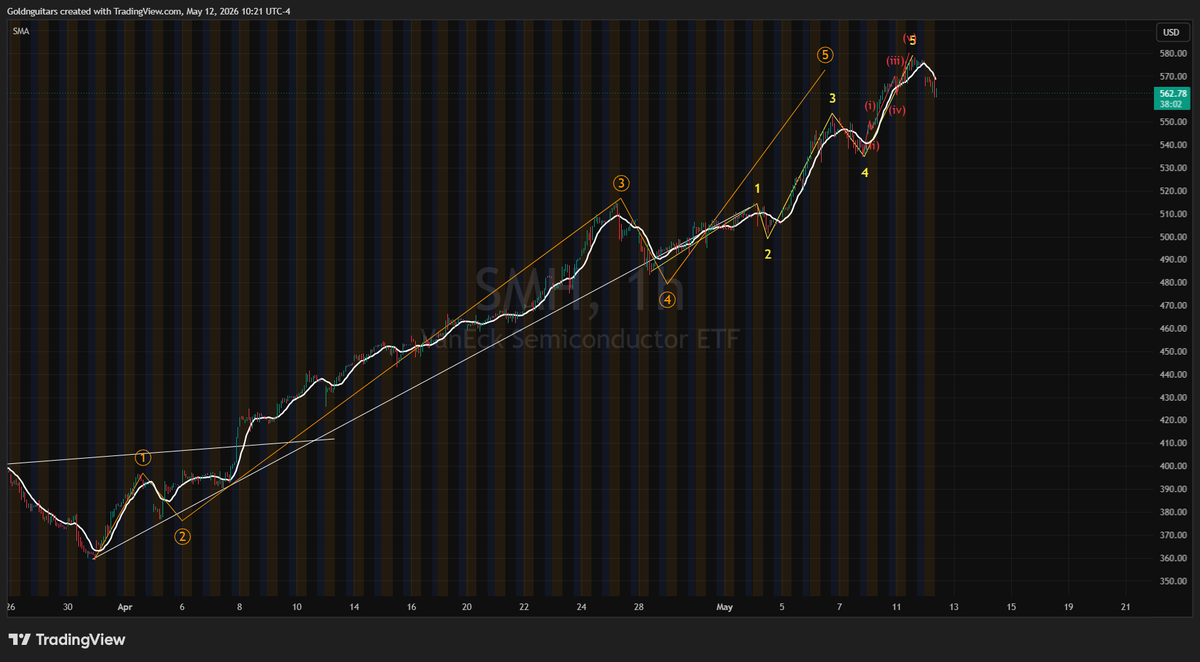
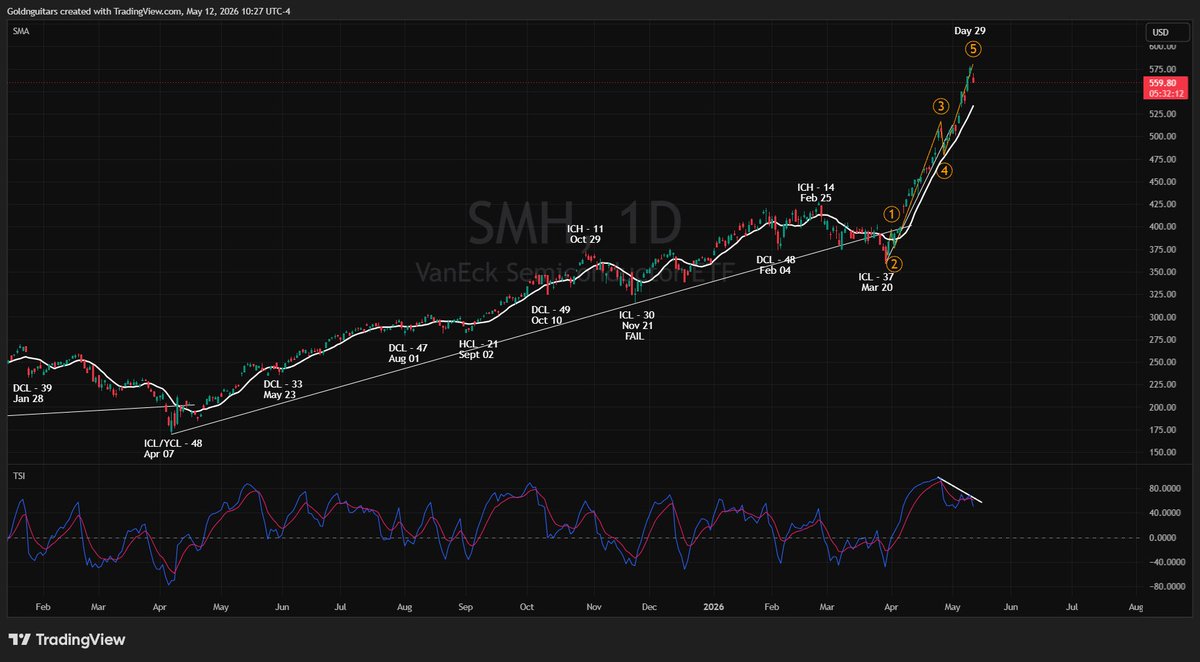
$SMH quick update; the 5th of 5th wave has subdivided into 5 waves on the 15minute chart and appears to be reaching an end point. $SOXS

English
6
8
53
14.8K
holger diderich - be water my friend retweetledi
Don Durrett - goldstockdata.com
Friday Recap Current (Last Week) -- (% to ATH | ATH) AU: $4,713 ($4,612) -- 19% to ATH ($5,608) AG: $80 ($75) -- 50% to ATH ($121) HUI: 802 (741) -- 23% to ATH (986) DXY: 97 (98) S&P 500: 7,398 (7,401) -- At ATH 10-Year: 4.3% (4.3%) There were three stories this week. First, the S&P 500 continues to roar higher, closing once again near an ATH (7398), up 172 points for the week. Second, gold and silver came along for the ride, with both up significantly on the week. Some think the correction in gold/silver is over, and they will now rip higher. Third, the war in Iran continues to linger, with the Strait essentially closed. The S&P is clearly a bubble and is topping. The only question is when does it top? When the year began, I thought it would be an H2 event, but it might happen in May or June if the war doesn’t end soon. The S&P is being supported by the AI trade, but that won’t be enough if the war is extended. The outcome of the war has come down to a single issue: who controls the Strait? The current narrative, which Wall Street clearly believes, is that Iran will be pressured into giving up its current control. However, if they do that, then Trump wins, and essentially Iran surrenders. Will Iran surrender and give up control of the Strait? I doubt it. The US currently isn’t feeling much pain, other than high gasoline/diesel prices. That will change once we get to June, and Iran has to know this. What happens in June? Supply chains begin to break in a big way. That outcome will have huge ramifications and will likely crash the stock market. Did gold and silver break out this week? Not if the war lingers. My target for gold remains at $4100 to $4400, and $55 to $65 for silver. I want to be wrong. I want Iran to open the Strait and gold/silver to rip higher, but that seems like a hopium outcome in the near term. Don’t expect a breakout in gold/silver until the war ends.
Don Durrett - goldstockdata.com tweet media
English
14
4
96
8.5K
holger diderich - be water my friend retweetledi
Wall Street NYC Quant. bitcoin-fund-manager.com
This is the most valuable and accurate chart for predicting the future. My subscribers shorted yesterday because we just hit resistance. The stock market is going to follow this chart. And it's already topped.
Wall Street NYC Quant. bitcoin-fund-manager.com tweet media
English
1
7
60
7.1K
holger diderich - be water my friend retweetledi
Northstar
Northstar@NorthstarCharts·
Gold - I'm not at all convinced the corrective phase is over. The evidence is still incomplete 👇
Northstar tweet media
English
64
93
874
163.5K
holger diderich - be water my friend retweetledi
bee🐝
bee🐝@0xbeehive·
S&P 500 IS FLASHING THREE RED FLAGS AT ONCE Price is going up. Everything else is going down 1. Volume in a downtrend - no real buyers behind this move 2. RSI overbought - the rally is running on fumes 3. MACD weak and rolling over - momentum is already failing When price disconnects from volume, RSI, and MACD at the same time - it doesn't end well The momentum is already dying This rally is not confirmed, so any correction will be very painful. Get ready! FOLLOW + NOTIFS ON!
bee🐝@0xbeehive

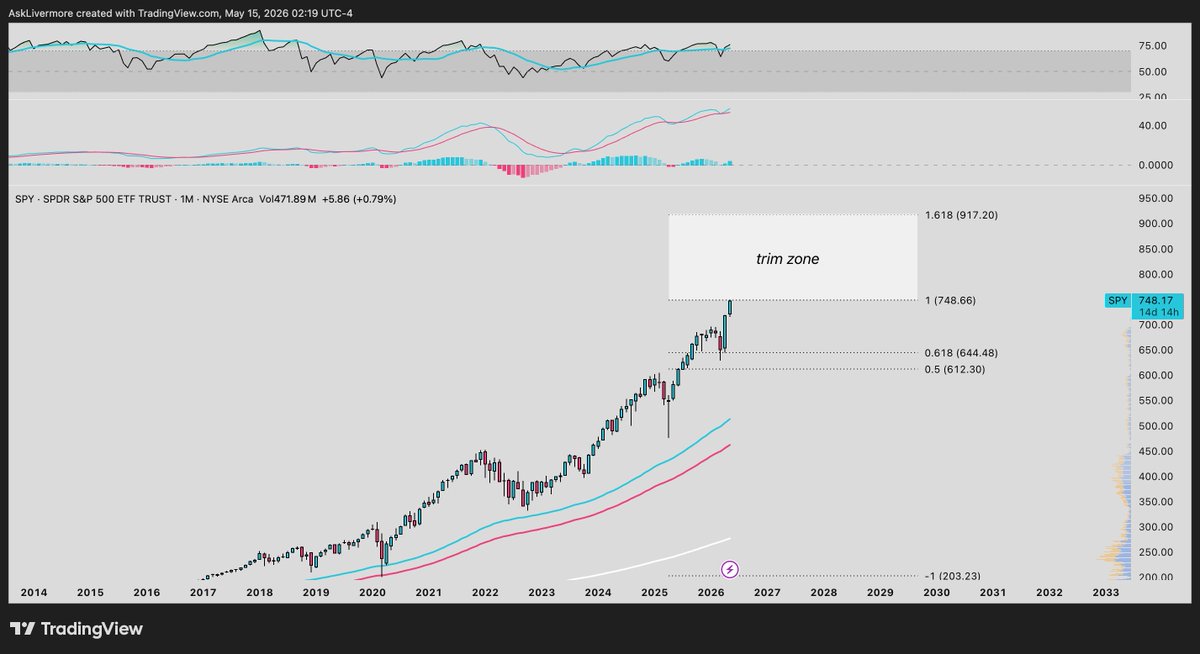
S&P 500 IS ALMOST AT THE EDGE OF THE CHANNEL Why almost? Because price still has room to fool people But while price keeps climbing: - RSI: Lower highs for two straight years - Volume: Fading on every new high This isn't a rally with conviction behind it This is a market running out of buyers at the top of the channel The edge is close. And edges have consequences FOLLOW + NOTIFS ON!

English
36
49
319
1.1M