Girl_Forex

3.1K posts

Girl_Forex banner
Girl_Forex

Girl_Forex

@Hdosh_25

Pro Market Analysis Intraday Setups • Risk Zones • Premium Signals Trade with Structure, Not Emotion

Katılım March 2013
1.1K Takip Edilen544 Takipçiler

2026 Yıllık Özeti

@Hdosh_25 hesabının Twitter yılını gör

Girl_Forex
Girl_Forex@Hdosh_25·
💙 Scalp setup on the table as gold pulls back toward a key resistance zone. 📌 If price taps this zone and shows rejection, there's a short opportunity with a tight risk box. XAUUSD ✅ Sell limit: 4046-4049 ⛔ SL: 4051 🎯 TP1: 4041 🎯 TP2: 4036 Once a position enters profitability, move stops to break-even to protect capital. Simple rule, big difference. 👉 Want clean scalp plans with defined risk every session? Check my profile. #XAUUSD #GoldTrading #ScalpSetup #RiskManagement telegram.me/+4CtNc6Kwh_k3M…
English
0
0
0
47
Girl_Forex
Girl_Forex@Hdosh_25·
💙 A Gold entry setup worth a second look. 📌 XAUUSD is sitting at a zone where reward-to-risk finally makes sense — clean levels, clearly defined stop. XAUUSD ✅ Entry/Zone: Buy limit 4052-4049 ⛔ SL: 4044 🎯 TP1: 4057 🎯 TP2: 4062 🎯 TP3: 4067 Key reminder before you take it: once a position moves into profit, shift to break-even to protect the capital you already have. 👉 Want entries broken down so you can plan the trade before the market wakes up? Check my profile. #XAUUSD #GoldTrading #ForexSignals #TradingSetup
English
0
0
0
27
Girl_Forex
Girl_Forex@Hdosh_25·
@kumar58429 The key detail here is the context, not just the headline. It’ll be interesting to see what gets confirmed once more reliable information comes out.
English
0
0
0
0
Knox.eth🍌
Knox.eth🍌@kumar58429·
Most losses don't come from picking the wrong asset. They come from skipping the questions that should have been asked before clicking Buy. Lately I've been trying to think about every trade like building a bridge. If one pillar is weak, the whole structure becomes risky. Here's the checklist I keep coming back to: • Why does this opportunity exist? • What evidence actually supports it? • Does the current market environment agree with the thesis? • What's the biggest reason this could fail? • Am I risking the right amount, or just chasing upside? • What would make me exit without arguing with myself? The last question is the one most people avoid. If you don't know what would change your mind, you don't have conviction. You have attachment. That's why I'm excited about what @tryquantio is building. Instead of encouraging louder opinions, the goal is to help people ask better questions, research ideas from multiple angles, understand risk, and keep monitoring whether the original thesis is still valid. Good investing isn't about always being right. It's about having a process that's strong enough to tell you when you're wrong. That's a much harder skill. And a much more valuable one. Join early 👇 whitelist.tryquant.io/?startapp=ref-… #QuantAIPioneers
Knox.eth🍌 tweet media
English
110
156
493
11.9K
Girl_Forex
Girl_Forex@Hdosh_25·
@OptionKing33996 The key detail here is the context, not just the headline. It’ll be interesting to see what gets confirmed once more reliable information comes out.
English
0
0
0
1
Option King
Option King@OptionKing33996·
Weekly Trade Ideas 💡 🟢 $PLTR 130C above 125 🎯 PT: 130, 135 🛑 SL: 122 🟢 $MSFT 470C above 465 🎯 PT: 470, 475 🛑 SL: 460 🟢 $AMZN 275C above 272 🎯 PT: 275, 280 🛑 SL: 270 🟢 $ADBE 260C above 251 🎯 PT: 255, 260 🛑 SL: 246 Trade your plan, manage your risk, and don't chase entries. Good luck everyone, and trade safe! 🍀📈
English
5
6
58
10.3K
Girl_Forex
Girl_Forex@Hdosh_25·
@EliteOptions2 The key detail here is the context, not just the headline. It’ll be interesting to see what gets confirmed once more reliable information comes out.
English
0
0
0
0
EliteOptionsTrader
EliteOptionsTrader@EliteOptions2·
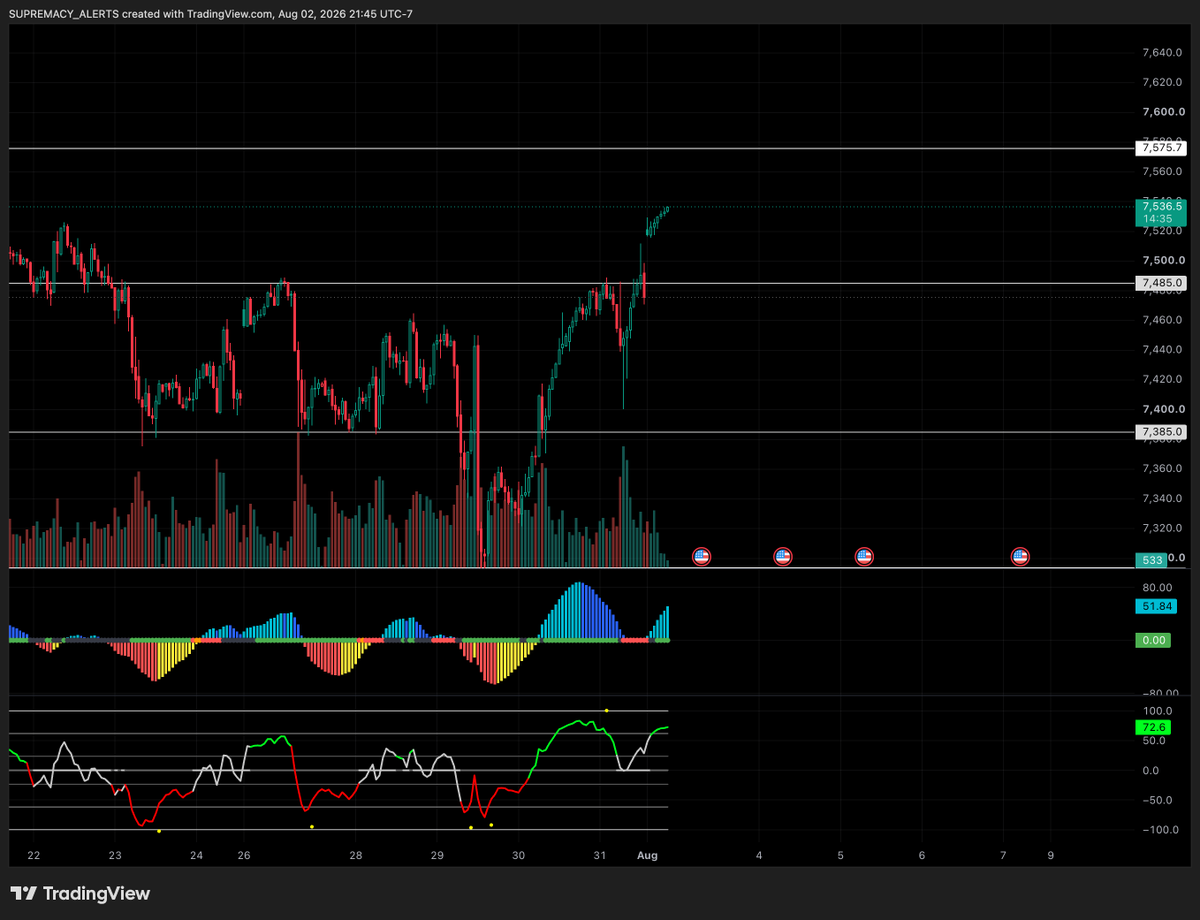
Elite Options TRADE IDEAS for week of Aug 7th 🔥 $MU Aug 7th 900C at 776 | 🎯 850, 900 SL 750 $NBIS Aug 28 200C near 170 | 🎯 190, 200 SL 160 $SPX Aug 5 7400P under 7500 | 🎯 7438, 7400 SL 7546 $SPX Aug 5 7550C above 7500 | 🎯 7546, 7576 SL 7468
EliteOptionsTrader tweet media
English
25
6
119
31.6K
Girl_Forex
Girl_Forex@Hdosh_25·
@Rrodolfo32 This is exactly where risk management matters more than being right. Fast markets punish hesitation and overconfidence pretty quickly.
English
0
0
0
0
Rafael
Rafael@Rrodolfo32·
$SPX $META $MSFT What's in store this week for the market? Let's dive in.🧵
Rafael tweet mediaRafael tweet mediaRafael tweet media
English
2
2
7
2K
Girl_Forex
Girl_Forex@Hdosh_25·
@swingtrader52 This is exactly where risk management matters more than being right. Fast markets punish hesitation and overconfidence pretty quickly.
English
0
0
0
0
Swing Trading and Coffee
Swing Trading and Coffee@swingtrader52·
🚨Before you take a trade do you know what phase of the market we're in and if the stock has an A+ setup, or do you just jump in based on your gut feeling and vibes that day? This is the kind of stuff we discuss on a daily basis in our Discord lounge: Technical Setups, Managing Your Psychology and Risk Management. If you actually want to grow as a trader this is the place for you. Swing Trading Education, high-conviction trade ideas, and a supportive no-BS trader community that actually helps you level up. 💵Get $30 OFF Your First Month With Code: TRY30 Join the traders building real edge together #o-anonymous" target="_blank" rel="nofollow noopener">stac.outseta.com/auth?widgetMod… #SwingTrading #TradingStrategy $SPY $QQQ $IWM $NVDA $GOOG bitcoin:native
Swing Trading and Coffee tweet mediaSwing Trading and Coffee tweet media
English
7
5
16
382
Girl_Forex
Girl_Forex@Hdosh_25·
@FinansTarihi0 The key detail here is the context, not just the headline. It’ll be interesting to see what gets confirmed once more reliable information comes out.
English
0
0
0
0
Oliver Brown
Oliver Brown@FinansTarihi0·
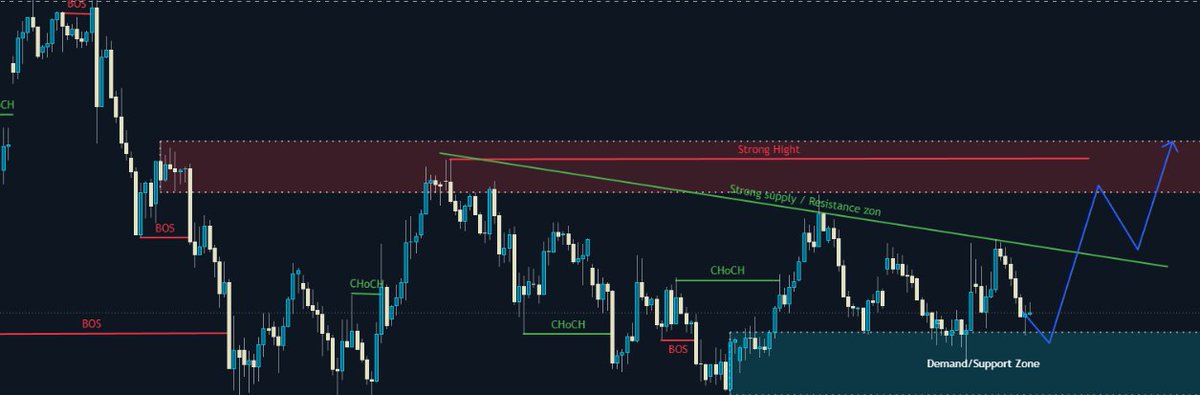
XAUUSD SMC Analysis: Demand Zone Retest & Bullish Expansion Path The XAUUSD H1 chart presents a classic Smart Money Concepts (SMC) accumulation phase following an extended corrective move. Price action is currently consolidating near a major Demand/Support Zone, preparing for a potential trend continuation toward upper liquidity pools. 1. Market Structure & Liquidity Dynamics Following a prolonged bearish trend marked by consecutive Break of Structure (BOS) events, price established a firm bottom around the 3,941.445 level. The structural shift began with lower-timeframe Change of Character (CHoCH) signals, confirming institutional interest in the discount area. The market has formed a descending trendline that acts as a Strong Supply / Resistance Zone, compressing price before an anticipated liquidity breakout. 2. Current Price Action & Setup Projection Currently trading at 4,045.165, price is pulling back directly into the primary Demand/Support Zone (3,960.000 – 4,020.000) to mitigate unfilled institutional buy orders. According to the projected SMC pathway (blue arrow): Demand Sweep & Mitigation: A final drop into the Demand/Support Zone will grab sell-side liquidity while mitigating unmitigated order blocks. Bullish Breakout: A strong impulse expansion is expected to break above the green descending resistance trendline (4,100.000), confirming structural alignment to the upside.
Oliver Brown tweet media
English
4
0
3
98
Girl_Forex
Girl_Forex@Hdosh_25·
@NaveedBalo67956 This is exactly where risk management matters more than being right. Fast markets punish hesitation and overconfidence pretty quickly.
English
0
0
0
0
SMC.Naveed FX 🇺🇲
SMC.Naveed FX 🇺🇲@NaveedBalo67956·
#XAUUSD_Gold update 🚀 Guys, the update regarding the market is that the market is forming a range and is stuck, so the hope is that the market will break out downwards during the USA section and the overall market is weak, there are high chances of a fall, so let's see what happens. Join our Telegram channel for more updates. t.me/Forex_Gold_Ana…
SMC.Naveed FX 🇺🇲@NaveedBalo67956

#XAUUSD 180+ Pips in Profit 📉🔥 Sell Setup Playing Out Perfectly. Risk Managed, Momentum Intact

English
5
0
15
2.7K
Girl_Forex
Girl_Forex@Hdosh_25·
@Itsadiee1 The key detail here is the context, not just the headline. It’ll be interesting to see what gets confirmed once more reliable information comes out.
English
0
0
0
3
Itsadiee_Fx
Itsadiee_Fx@Itsadiee1·
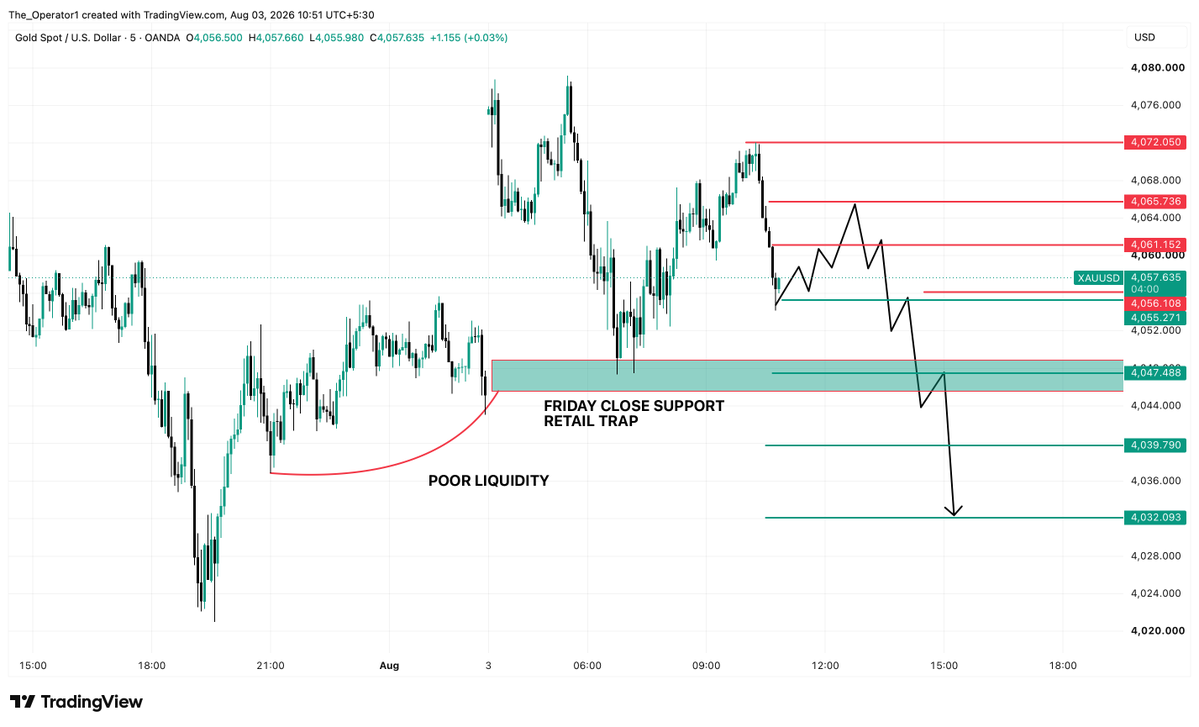
XAUUSD . 🚨 MONDAY GOLD OUTLOOK — THE DOWNSIDE MOVE MAY NOT BE OVER The flat-to-gap-up opening I was expecting for Monday played out exactly as anticipated. Along with that, we’re also seeing the downside selling momentum I was expecting below the 4080 area. If you look closely at today’s price action, Gold took support around 4047, which is almost around last week’s closing price. That’s why we’re seeing a lot of activity above this zone. Some traders may be expecting the market to continue moving higher from here, but personally, I’m not convinced. The selling move we saw on Friday was quite strong. And if you look at the retracement, Gold has already retraced around 50% of Friday’s selling move. Because of that, in my view, there may not be many significant stop losses sitting above. The major liquidity and stop-loss zone I’m watching is on the downside — below 4000. Last week’s low was around 3996, and Friday’s low is the liquidity Im watching. So based on my plan, I believe the market could eventually target that downside liquidity. ⚠️ MY KEY RESISTANCE ZONE Personally, I don’t expect Gold to sustain above 4072 today. At maximum, I don’t expect Monday’s high to be taken out either. That’s my strong view based on the current structure. If Gold breaks down below 4047, I believe we could see strong downside momentum, potentially pushing Gold directly below the 4000 level. 🔻 SELLING PLAN If you already sold Gold from the top, stay calm and let the trade run according to your plan. If you haven’t entered a short yet, don’t rush. I would rather wait for some consolidation around the 4055-63 area and then look for a fresh rejection. For example, if Gold consolidates and then shows another rejection around 4061–4065, similar to the rejection we saw from 4071, that could create another selling opportunity. Alternatively, if Gold directly breaks below 4056, that could also provide a potential short setup. 🎯 My downside target for this setup would be around 4032. So this is the selling plan I’m watching for Gold today. Remember — don’t chase the market. Wait for confirmation and let the price come to your level. What’s your view on Gold today — bullish or bearish? Comment below and let me know. Thank you! ❤️
Itsadiee_Fx tweet media
Itsadiee_Fx@Itsadiee1

XAUUSD . 🚨 GOLD AUGUST TRAP IS SET! $4,000 BREAKDOWN OR MASSIVE REVERSAL? So, July started with bullish momentum because at the end of June, Gold had formed a double-bottom pattern, and the upside momentum at the beginning of July eventually completed a W-pattern formation. Because of this structure, many traders started believing that Gold was preparing for a strong upside move throughout July. But what actually happened was completely different. Around $4,200, sellers showed extremely strong rejection, which created significant downside pressure. Throughout July, we saw multiple upside spikes where it looked like Gold was finally ready to break higher, but most of those moves failed, and the overall market continued to show bearish pressure. Even though buyers repeatedly showed strength, sellers continued to demonstrate much stronger control from the higher levels. And now, Gold has reached a clear make-or-break situation. The market is sitting at a point where traders are divided between two possibilities — either Gold is preparing for a major crash or it is getting ready for another strong upside move. So the real question is, what can we expect from Gold in August, and what could be the market's direction throughout the month? If we look at the last four months, we can see that Gold has experienced multiple bearish monthly candles. But for the first time, July has closed with a green monthly candle. Since March, we had continuously seen red monthly candles, so the July close is something important to note. It could be an early indication that the monthly bias is beginning to shift, especially after the extended consolidation we experienced throughout July. And this consolidation is where things become interesting. The way Gold behaved throughout July makes me believe that the market was intentionally creating opportunities to trap buyers at higher levels and sellers at lower levels. In my opinion, the beginning of August could continue that same psychological game. Last week, Gold created a low around $3,996 and then quickly recovered, closing back above $4,000 and moving higher. And this move came on FOMC move. After Gold briefly broke above $4,000 and then reclaimed the level, a lot of traders started buying. Because of that, I believe a significant amount of liquidity is now sitting below $4,000, especially around the previous week's low. This is one of the first areas I will be watching closely. At the same time, Friday gave us strong one-sided selling. Because of that, I don't necessarily expect Monday to immediately continue higher. The market could first revisit the $4,060 area, potentially creating a small upside recovery to trap sellers who entered during Friday's closing move, before eventually pushing lower. This is where my main psychological scenario begins. I believe the market could attempt another move below $4,000 or spend some time consolidating around that level. If that happens, the crowd will likely interpret it as confirmation that Gold is finally ready for a major crash. That could attract a significant amount of fresh short positions and build even more sell-side liquidity. The important area for me is $3,998–$4,012. I consider this a major support and liquidity zone. If Gold trades below this area, the market could create strong bearish sentiment and convince traders that the downside move is finally confirmed. But if heavy selling begins to build below this zone, I will start watching closely for a potential reversal rather than chasing the breakdown. The broader battlefield for me remains the $3,950–$4,200 range. Gold could potentially spend significant time inside this range before finally deciding its next major direction. That is why I don't want to react emotionally to every breakout or breakdown within this range. I want to see where liquidity builds and, more importantly, how price reacts after that liquidity is taken. Now let's look at the opposite side of the structure. Last week, the highs formed on Monday, Tuesday and Friday were all around the $4,120 area, creating a potential triple-top formation. I've also drawn a parallel channel, and you can clearly see lower highs developing. Naturally, this structure has made a large number of traders bearish, and many sellers have already become active around $4,120. This means a significant amount of short positioning could already be sitting above the market. And this is exactly why I find the setup interesting. If Gold moves lower from here, more traders are likely to enter short positions, especially if the market breaks below $4,000. The more convincing the breakdown looks, the more liquidity could potentially build on the short side. Once enough sellers are trapped, the market could use that liquidity for a strong upside reversal. My key area to watch on the downside is $3,988. If Gold reverses from there, that would immediately get my attention. But if the market pushes slightly deeper and reaches the previous low around $3,945, I will allow that move as well. I am not going to rush into a position simply because the market reaches one particular level. I want to see the reaction and the confirmation. Psychologically, my view is that the first week of August could be designed to convince traders that Gold is preparing for a major sell-off. But I believe that bearish belief could eventually become the trap itself. If the market successfully creates fear, attracts heavy selling and takes the liquidity sitting below the key levels, then the next major move could potentially be toward the upside. My main focus will be whether Gold can eventually reclaim and close above $4,120. If we get a strong close above $4,120 within the first 10 days of August, I believe that could become an important confirmation for the bullish scenario I am watching. Personally, I also believe there is a possibility that August could eventually close as a green monthly candle. So overall, my psychological plan for the beginning of August is simple: I believe Gold could first create fear around the downside, make traders believe that a major crash is coming, attract heavy short positioning around $4,000 and below, and then potentially use that liquidity for a strong reversal. I will not chase the breakdown. I will let the market come to the important levels, observe the reaction, and act only if the setup confirms my thesis. And that's the difference between predicting the market and reading the market. A new month has started, so make sure you trade with a fresh mindset. Go back to the mistakes you made in July, note them down, study them, understand what went wrong, and use those lessons to become a better trader this month. Most importantly, trade with proper risk management and money management. I hope you enjoyed this psychological analysis and my plan for the beginning of August. I wish every single one of you a profitable and successful month ahead. ❤️ And as always, let me know in the comments — what do you think Gold is going to do next? Thank you, and trade safe. 🤝

English
35
2
108
28K
Girl_Forex
Girl_Forex@Hdosh_25·
@aakankshalovely This is exactly where risk management matters more than being right. Fast markets punish hesitation and overconfidence pretty quickly.
English
0
0
0
0
Aakanksha Gupta
Aakanksha Gupta@aakankshalovely·
XAU/USDT is trading at 4,063.07 on the daily timeframe, consolidating inside a descending channel pattern with dynamic resistance overhead. Key demand is well-established in the lower support zone between 3,945.06 and 3,985.39, which has held recent pullbacks near the local low of 3,948.18. To break the current bearish market structure, price must clear the descending trendline and push through the intermediate resistance zone around 4,187.06, which would open the path toward the higher supply region near 4,245.41.
Aakanksha Gupta tweet media
English
3
0
7
4.1K
Girl_Forex
Girl_Forex@Hdosh_25·
@Kaffchad The key detail here is the context, not just the headline. It’ll be interesting to see what gets confirmed once more reliable information comes out.
English
0
0
0
1
Kaff 📊
Kaff 📊@Kaffchad·
Memory stocks just gave everyone a lesson in what happens when a crowded winner corrects 20-35%, but the underlying earnings never actually break. $MU, $SKHY, $SNDK and $DRAM all bounced double digits in one day. Really, that was the basket getting un-smoked after getting rekt since late June. Fundies didn't break so this ain't ded yet: – Samsung printed real rev + profit, up 19x yoy – Microsoft guided Azure/sales above expectations right after – Micron's HBM book is sold out through 2027 – SK Hynix is chasing up to 70% of Nvidia's Rubin HBM4 allocation – global memory sales hit ATH $74.6B last month, +31.7% MoM – HBM demand projected +90% this yr, another +77% in 2027 AI isn't only creating more demand for memory, supply's getting squeezed too. HBM physically eats around 3x the wafer capacity of regular DRAM, so every wafer shifted toward HBM tightens supply for everything else. AI servers could take more than 40% of global DRAM capacity this year and around 49% next year. The next catalysts for the memory stock basket are still earnings-driven imo. – Q3/Q4 hyperscaler capex reaffirmations from $MSFT, $GOOGL, $META and $AMZN – Rubin production ramp in H2 2026, with system availability stretching into 2027 – HBM4 commercial volume ramps from SK Hynix and Samsung, repricing the whole stack I think we also get a crypto trade from this big TradFi catalyst. When HBM, VRAM and cloud capacity become scarce, the shadow price of inference goes up. Decentralized networks become more valuable only if they can route that demand and make the token capture part of the bill. For $TAO, the relevant trade is the subnets that actually consume high-memory compute. – @chutes_ai SN64 is serverless, GPU-backed inference – @blockmachine_io SN19 focuses on low-latency inference – @TargonCompute SN4 is verifiable and confidential compute Crypto's still pricing the hope that someone builds the market for this. Until that flips, direct equity exposure is still the trade.
Kaff 📊 tweet media
English
52
28
200
5.8K
Girl_Forex
Girl_Forex@Hdosh_25·
@pdicarlotrader The key detail here is the context, not just the headline. It’ll be interesting to see what gets confirmed once more reliable information comes out.
English
0
0
0
0
Peter DiCarlo
Peter DiCarlo@pdicarlotrader·
$IREN short term structure still looks bullish. Price held last week’s swing low and bounced. Now we see if that level can hold into August. While this short term structure holds, I expect a break to the highs. If we sweep that low, I expect price to redistribute toward $20.
Peter DiCarlo tweet media
English
20
16
301
40.5K
Girl_Forex
Girl_Forex@Hdosh_25·
@TonyResearch_ The key detail here is the context, not just the headline. It’ll be interesting to see what gets confirmed once more reliable information comes out.
English
0
0
0
0
Tony Research
Tony Research@TonyResearch_·
HERE’S WHERE I’D LOOK TO LONG $BTC My local view on #BTC: Here’s my plan: 1. Long in the 0.5–0.618 Fibonacci zone - $62,320/$61,230 2. Look for a reversal structure on 1H/4H, e.g. a double bottom 3. First target - $68,500/$69,400 4. Second target - $72K 5. After that, I expect the final drop to begin in August/September $ETH is still holding stronger than $BTC - this is important! I’m still holding the Bitcoin long I opened earlier. I’ll average into the position in the zone I mentioned above and previously. The key thing to understand is that we’re still in a bearish trend, so be careful with long positions. Many believe the bottom has already been reached. I think the final part hasn’t started yet. If anything changes, I’ll let you know! DYOR As a reminder, I warned about the bull trap at $82K and the summer drop. MY NEXT CALL WILL BE THE BIGGEST ONE OF THIS CYCLE. TURN ON NOTIFICATIONS. MOST PEOPLE WILL FOLLOW ME TOO LATE.
Tony Research@TonyResearch_

DON’T SHORT $BTC NOW First, $BTC will close the FVG at $70K Then we’ll see the final drop Here’s my plan: 1. First long zone – $64,700 (already opened) 2. Second long zone – $62,500/$61,200 3. It’s important to see a reversal structure on the 1H timeframe 4. Then a rally to $70K 5. 7–14 days of distribution 6. Then a breakdown below $59K 7. Flush to $48K 8. Final bottom test in the $38K–$44K zone Let me also remind you: when #BTC reaches the $68K–$70K zone, we’ll see an altcoin bounce of roughly 40–100% I expect the final decline to begin in August/September. So be careful with long positions $ETH is showing strength, just as I mentioned in my previous post After that, a drop will follow, because this is another bull trap Many believe the bottom has already been reached. I think the final part hasn’t started yet. As a reminder, I warned about the bull trap at $82K and the summer drop. MY NEXT CALL WILL BE THE BIGGEST ONE OF THIS CYCLE. TURN ON NOTIFICATIONS. MOST PEOPLE WILL FOLLOW ME TOO LATE.

English
61
38
505
78.8K
Girl_Forex
Girl_Forex@Hdosh_25·
@CryptoSavingExp This is exactly where risk management matters more than being right. Fast markets punish hesitation and overconfidence pretty quickly.
English
0
0
0
0
CryptoSavingExpert ®
CryptoSavingExpert ®@CryptoSavingExp·
Bitcoin is currently trading at $62,877, holding just below the key $63,000 support region. After several days of consolidation, the market remains range-bound, with $64,000 continuing to act as the main resistance level. A confirmed move above $64,000 would strengthen the short-term structure and bring the $65,700 resistance back into focus. On the downside, a sustained break below the $63,000 region would shift attention towards the $61,000 support. For now, Bitcoin remains trapped between support and resistance, with the next decisive move likely to come from a break of either level.
CryptoSavingExpert ® tweet media
English
14
4
18
3.4K
Girl_Forex
Girl_Forex@Hdosh_25·
@Mingarithm The key detail here is the context, not just the headline. It’ll be interesting to see what gets confirmed once more reliable information comes out.
English
0
0
0
0
Minga
Minga@Mingarithm·
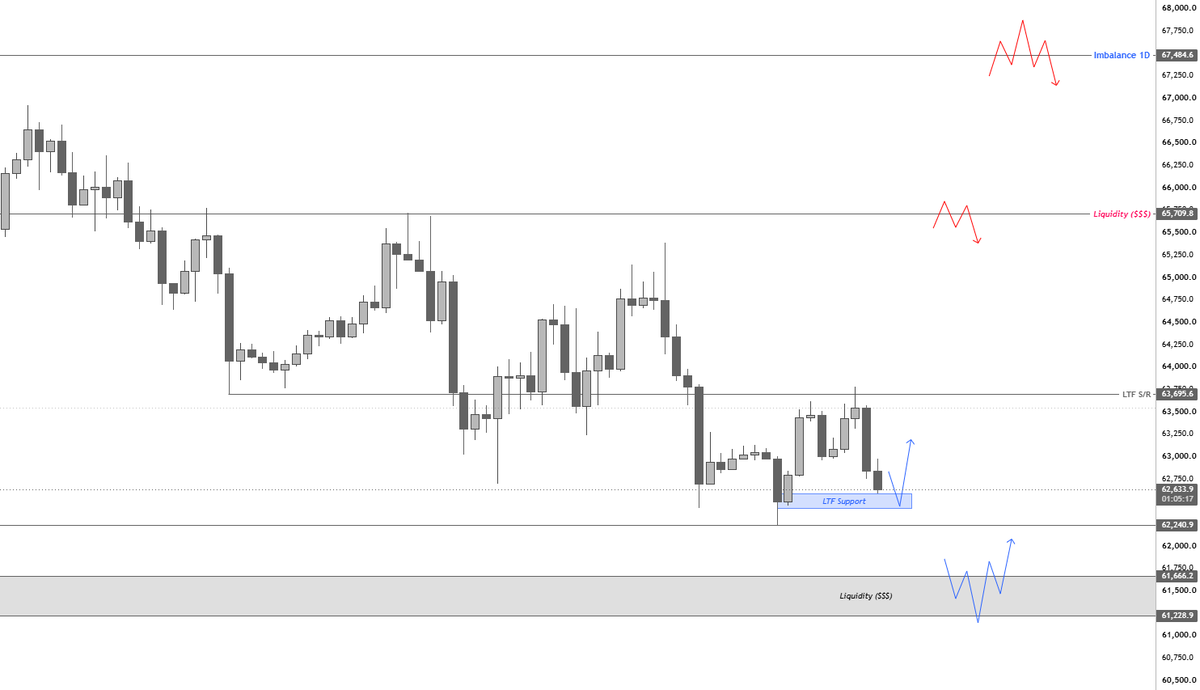
$BTC | Update (4H) The Weekly closed above 63,298, which is exactly what we wanted to see for bullish continuation. Now we're seeing a pullback right at the start of the week, which makes sense considering the weekend created internal structure liquidity that's now being swept immediately as the week begins. If the local bottom is already in, then price should respect this Blue LTF Support Box and continue pushing back to the upside. This blue box represents the internal structure support zone, and if this move is simply a bullish retest then this is where price should find support before continuing higher. If we lose this Blue LTF Support Zone, it would open the door for a move into the 61.6k-61.2k region, where a significant amount of untapped liquidity is still resting. From a liquidity perspective, it would make sense for price to sweep that region. However, it has been getting front-run for the past couple of weeks, so I wouldn't be surprised if we see the same thing happen again, with price bouncing from the internal support zone without actually taking out that liquidity. As for my trades, the current long from 62.3k remain risk-free. We secured 25% at the highs before the pullback, and the remaining position have the SL moved to BE, leaving nothing left to lose. If we do get stopped out at BE, then I will look for a Re-Entry from the 61.6k-61.2k region, Where I expect us to mark the bottom for this month before moving higher.
Minga tweet media
English
6
13
95
13.2K
Girl_Forex
Girl_Forex@Hdosh_25·
@JESUSVELASCOLIN This is exactly where risk management matters more than being right. Fast markets punish hesitation and overconfidence pretty quickly.
English
0
0
0
0
Lina CryptoX
Lina CryptoX@JESUSVELASCOLIN·
Most people are playing checkers while the market is playing 4D chess. Stop watching the charts and start watching the liquidity. If you aren't positioning for the rotation, you’re just exit liquidity.
English
15
0
20
160
Girl_Forex
Girl_Forex@Hdosh_25·
@SebastianWols17 The key detail here is the context, not just the headline. It’ll be interesting to see what gets confirmed once more reliable information comes out.
English
0
0
0
0
𝐂𝐑𝐘𝐏𝐓𝐎 𝐀𝐋𝐔𝐂𝐀𝐑𝐃
Are you also temped to trade on Sunday? Every time I say, don`t trade on Sunday, it`s a jeet day, and almost always ends bad... But the temptation is crazy, it`s Sunday you have time, you would love to make some $ and your mind is telling you open the chart... but still no idea why jeets do like to destroy Sunday trading, is it done on purpose? Crazy...
𝐂𝐑𝐘𝐏𝐓𝐎 𝐀𝐋𝐔𝐂𝐀𝐑𝐃 tweet media
English
6
1
14
991
Girl_Forex
Girl_Forex@Hdosh_25·
@0xAralez This is exactly where risk management matters more than being right. Fast markets punish hesitation and overconfidence pretty quickly.
English
0
0
0
0
Aralez 🐕
Aralez 🐕@0xAralez·
🚨 DON'T SHORT $BTC FROM HERE First, market should fill FVG around $71K-$72K Only then does real dump phase begin Here's my roadmap: 1. Drop to $61K → liquidity sweep 2. Slow recovery 3. Liquidity grab around $68K 4. Push into Bull Trap zone ($70K-$73K) 5. 5-7 days of distribution 6. Breakdown begins 7. Dump below $57K 8. Brief pause 9. Flush below $49K into bottoming zone The key thing to understand: Once $BTC reaches $70K area, a fresh wave of euphoria will likely hit market At that stage, large-cap ALTs like $SOL and $ETH could rally 10-30% in just a few days That's where most people get trapped - because final flush and true cycle bottom still won't be in IMPORTANT: I called the $BTC $126K ATH I also called the $98K → $60K and $83K → $57K dumps Now market is building a very similar setup again, yet only a few are talking about what comes next Most people discover my calls only after it's already too late Turn notifications on so you don't miss my next major market calls
Kalshi Crypto@Kalshi_Crypto

JUST IN: BlackRock sells $120M worth of Bitcoin

English
69
85
491
79.1K
Girl_Forex
Girl_Forex@Hdosh_25·
@TempoICT The key detail here is the context, not just the headline. It’ll be interesting to see what gets confirmed once more reliable information comes out.
English
0
0
0
0
Tempo Trades
Tempo Trades@TempoICT·
IFVG Setup Of The Week 💰 - Rejecting New Week Opening Gap - Swept Asia Low - V-Shape momentum NWOG is a very underrated PD array but not many people use it. Every week Sunday's open at 6pm est will usually create a gap from where the Friday's close was. This creates a NWOG and when price taps back into it early in the week we expect it to reverse In this trade I combined that NWOG tap with a sell side liquidity sweep to give me 2 very strong confluences that price was going to reverse in that area
Tempo Trades tweet media
English
5
5
93
4.9K