Mayne

1.3K posts

Mayne banner
Mayne

Mayne

@limayne

At constant discovery mode

Katılım Kasım 2017
169 Takip Edilen155 Takipçiler
Mayne retweetledi
Luckshury
Luckshury@Luckshuryy·
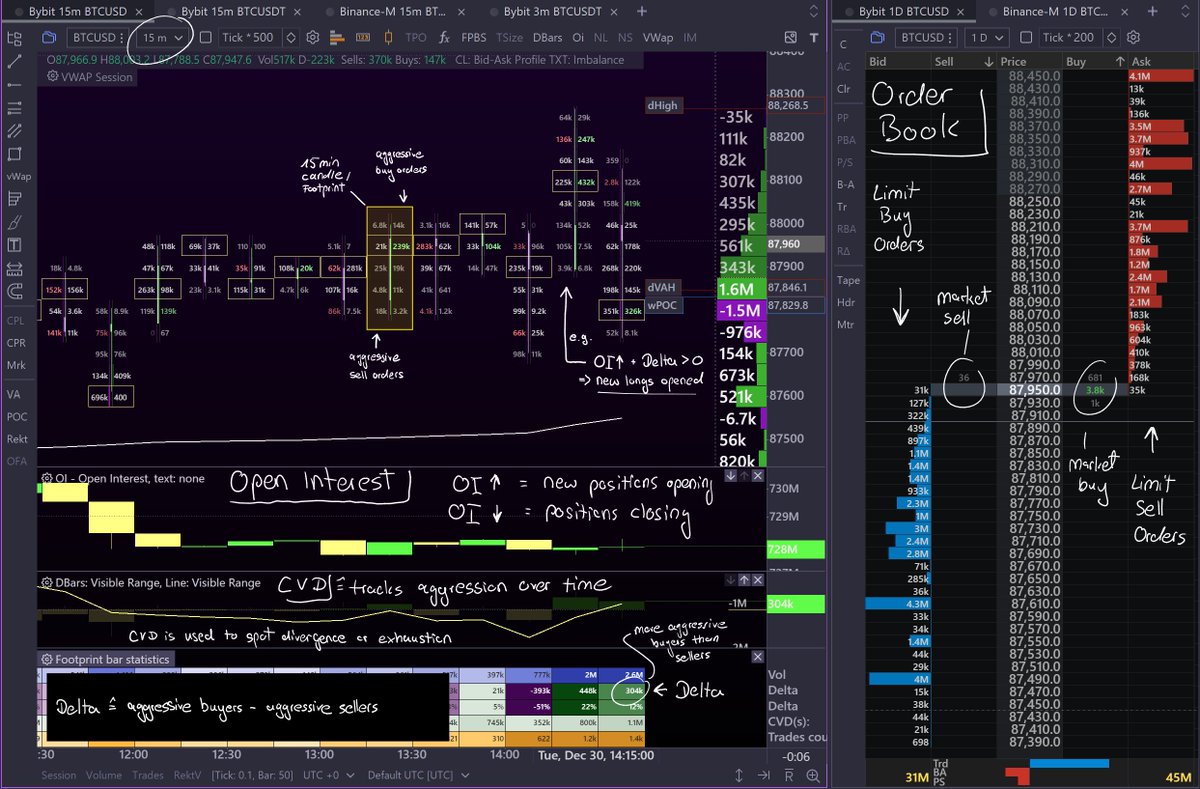
I recorded a 13-min tutorial on how to spot absorption correctly 0:11 - passive/aggressive flow 2:01 - footprint absorption 
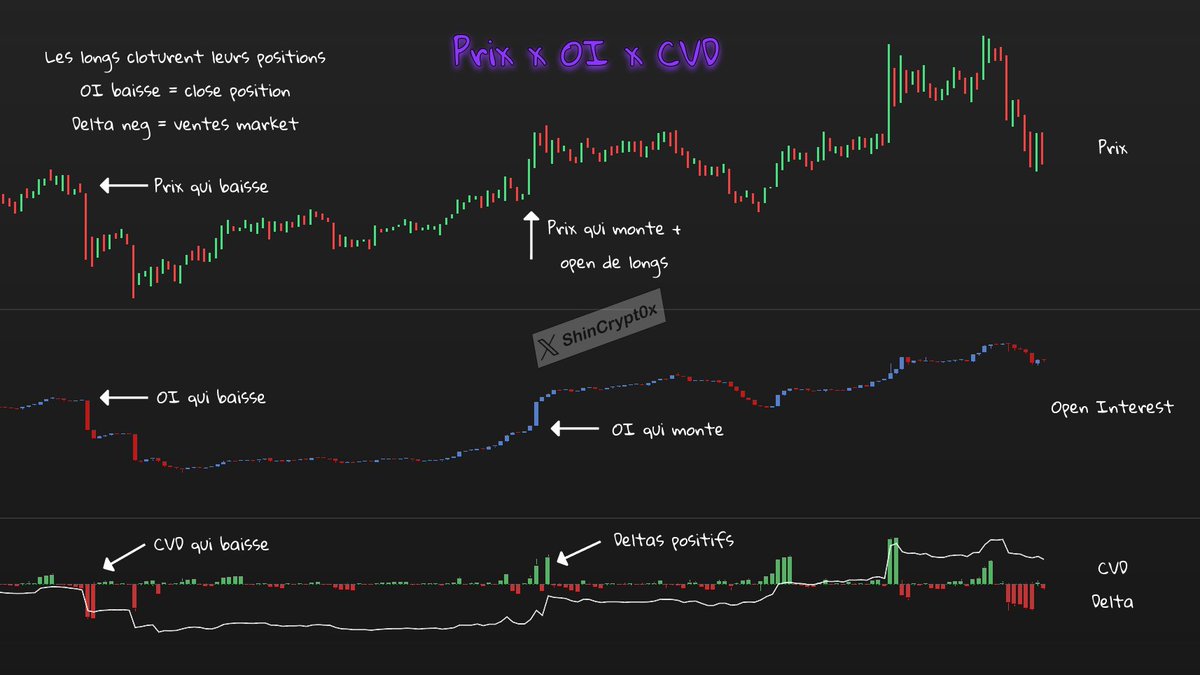
4:31 - cvd divergences 
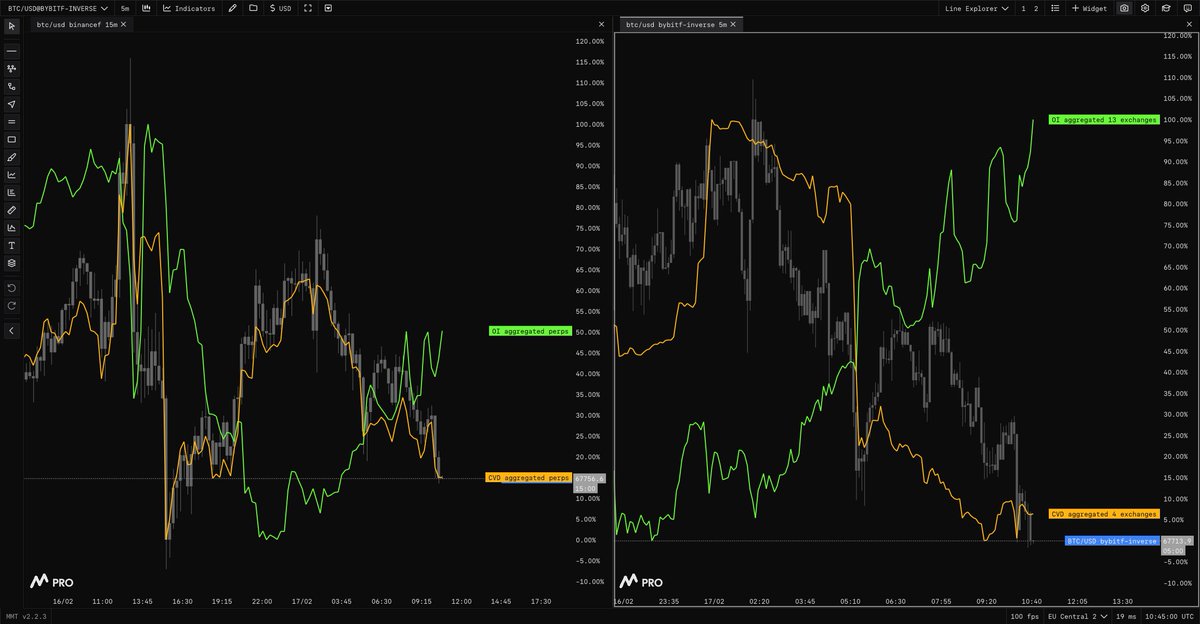
6:24 - multi exchange cvd 7:09 - trade example 9:46 - multi exchange signals 10:24 - positioning (key) 12:42 - building a system
English
12
77
666
41.5K
Mayne retweetledi
Shin 🎯
Shin 🎯@ShinCrypt0x·
Rappel du dimanche : 🟢 OI + 🟢 Delta = ouverture LONG 🟢 OI + 🔴 Delta = ouverture SHORT 🔴 OI + 🟢 Delta = fermeture SHORT 🔴 OI + 🔴 Delta = fermeture LONG Exemple 👇
Shin 🎯 tweet media
Italiano
5
53
307
22.5K
Mayne retweetledi
Luckshury
Luckshury@Luckshuryy·
what absorption looks like: - increased selling - price unable to make new lows passive buyers absorbing aggressive sellers example ↓
Luckshury tweet media
English
6
22
340
14.9K
Mayne retweetledi
Luckshury
Luckshury@Luckshuryy·
I recorded a 11-min tutorial on how to use open interest correctly 0:11 - fundamentals 1:17 - cheatsheet 3:06 - positioning open interest 4:21 - trade breakdown 5:56 - fragmented crypto markets 6:57 - real use case 8:41 - net positions indicator 9:38 - important 10:50 - context
English
7
120
792
37.2K
Mayne retweetledi
MMT
MMT@MMT_Official_·
🧵 Net Longs and Net Shorts don’t predict direction. They expose positioning. Most traders look at rising net longs and think: “Bullish.” That’s not how it works. 👇 Net longs rising = aggressive buyers opening positions. Net shorts rising = aggressive sellers opening positions. But that alone isn’t enough. You need open interest.
MMT tweet media
English
2
16
156
17.7K
Mayne retweetledi
MMT
MMT@MMT_Official_·
Breakouts don’t cause moves. Positioning does. Most traders think price breaks a level and then moves. But by the time you see the breakout, positioning is already extreme. The real move happens when: • Late longs get absorbed • Stops get triggered • Liquidity gets consumed • Aggression flips That’s why most breakouts fail. Because they aren’t expansion. They’re fuel collection. If you want the move, watch positioning, not candles.
English
1
5
62
4.9K
Mayne retweetledi
Exotick
Exotick@Exoticktrades·
I broke-down the order flow in this pivot low... Focusing on offside orders and delta. Looking for opportunities where aggressors flip sides, with yesterday giving the perfect example. A perspective of what I like to see and where. in-depth example ↓
Exotick tweet media
English
3
19
207
9.1K
Mayne retweetledi
MMT
MMT@MMT_Official_·
Quick Educational Note 👇 Price shows direction. CVD shows aggression. OI shows commitment. Read them together. 📈 Price ↑ + CVD ↑ + OI ↑ = new longs entering → real bullish fuel. 📉 Price ↓ + CVD ↓ + OI ↑ = new shorts building → real bearish pressure. 📈 Price ↑ + CVD ↑ but OI ↓ = shorts closing → weaker rally. 📉 Price ↓ + CVD ↓ but OI ↓ = longs closing → weak drop. Simple memory rule: Price = move. CVD = who’s hitting. OI = who’s staying. Bookmark this!
MMT tweet media
English
3
40
279
13K
Mayne retweetledi
Luckshury
Luckshury@Luckshuryy·
Identifying Absorption Through Orderflow New video covering different types of absorption, the foundations, and how I use it in my trading. Any further questions don't hesitate to ask below. *timestamps included ⤷ youtu.be/NDAjHc5hqEE
YouTube video
YouTube
Luckshury tweet media
English
3
23
198
12.2K
Mayne retweetledi
Luckshury
Luckshury@Luckshuryy·
I recorded a 8-min video breaking down a trade I took using the footprint 0:12 - daily context 2:34 - orderflow 3:41 - footprint chart 4:24 - important nuance 5:13 - execution 6:24 - trade management 7:15 - summary
English
20
108
906
74.4K
Mayne retweetledi
Spicy
Spicy@spicyofc·
quick tip with using Open Interest When OI is consistently increasing over time: • trading breakout longs is generally easier. When OI is consistently decreasing over time: • trading breakout shorts is generally easier. When OI is flat and going sideways • trading reversals (both long/short) is generally easier.
English
0
2
71
3.8K
Mayne retweetledi
Luckshury
Luckshury@Luckshuryy·
liquidations: a complete guide a thread 🧵
Luckshury tweet media
English
7
60
461
41.7K
Mayne retweetledi
Luckshury
Luckshury@Luckshuryy·
Open interest triggers:
Luckshury tweet media
English
5
28
312
14.5K
Mayne retweetledi
Luckshury
Luckshury@Luckshuryy·
My Session Times - all UTC +0
Luckshury tweet media
English
6
13
182
9.9K
Mayne retweetledi
Luckshury
Luckshury@Luckshuryy·
market positioning cheatsheet:
Luckshury tweet media
English
1
36
339
14.1K
Mayne retweetledi
Luckshury
Luckshury@Luckshuryy·
I recorded a 15-min tutorial on how to use Volume Profile (VP) 0:27 - Visible Range (VRVP) 2:12 - Fixed Range Volume Profile (FRVP) 3:30 - Trending Pulls 8:06 - Ranges 12:40 - More Examples
English
9
85
664
34.5K
Mayne retweetledi
Luckshury
Luckshury@Luckshuryy·
my model (simplified)
Luckshury tweet media
English
10
11
246
13K
Mayne retweetledi
Massimo
Massimo@Rainmaker1973·
Lava flow activity and progress of the pyroclastic density current (PDC) or “uson” at Mayon Volcano in the Philippines on Jan. 8, 2026 [📹 Joseph Trilles]
English
12
9
43
12.2K
Mayne retweetledi
JDK Analysis 🇪🇺
JDK Analysis 🇪🇺@The_JDK99·
How to read OrderFlow? 🤔 Here comes another quick guide on how to read OrderFlow like a pro and how you can profit from market-generated information. 👇 /Introduction: OrderFlow is not another indicator or strategy. It’s simply a visualization of how the market actually works. Instead of only seeing open, high, low, and close on a standard candlestick chart, OrderFlow lets you see the real-time interaction between buyers and sellers, including the volume traded at each price level. /How the market works: If you trade the market, you need to understand how it works first! Markets operate as a two-way auction. On one side, market buyers transact with limit sellers. On the other, market sellers transact with limit buyers. Market orders never trade with other market orders, and limit orders never trade with other limit orders! Limit orders sit in the OrderBook and provide liquidity. Market orders execute immediately by consuming that liquidity. From here on, we’ll refer to traders who execute at market as "aggressive traders", and traders who place limit orders and wait for execution as "passive traders". So when and why does price move? Let's say a large aggressive sell order hits the market; for example, a 5M contract market sell. To execute the order we need a 5M limit buy order on the other side. If we look at the current OrderBook (see picture, right side, in blue = limit buys), we can see that at the current price (87,950) there aren’t enough contracts resting on the bid. The order can’t be fully filled there, so price has to move lower to find more passive buyers and enough liquidity to complete the execution. Price does not move lower because there are more buyers than sellers. Price moves because one side is more aggressive, starts crossing the spread and there isn’t enough liquidity at the current price! /OrderFlow: If you understand how the two-way auction works, you can watch it play out in real time using OrderFlow and so-called footprint charts (provided, for example, by @ExochartsC). On the left side of the picture you see a footprint candle chart, showing aggressive sell orders on the left side of each candle and aggressive buy orders on the right. Those are actually executed orders: market orders that got matched with limit orders. You could also say that the left side of each candle shows limit buy orders executed by market sell orders. But for OrderFlow analysis, we focus on the aggressive side of the market, the market orders, because only aggression consumes liquidity and drives price discovery. So It shows intent, because aggressive orders reveal who is actively forcing price to move. Thus we say we got market sells on the left and market buys on the right. Now it gets really interesting when price does not follow the aggression. For example, you see a lot of aggressive market buying (large numbers on the right side of the candle), but price doesn’t move higher. That tells you passive limit sellers are providing liquidity and absorbing the aggressive buyers. The buyers are essentially "hitting a wall". That’s extremely valuable information you can use in your trading. /How to trade with OrderFlow (OI, CVD, ...) (next post coming soon...) (Chart is showing ByBit's BTCUSD.p, 15min rotation, by @ExochartsC) #Bitcoin $BTC
JDK Analysis 🇪🇺 tweet media
English
14
87
547
30.6K