TheValueist

17.3K posts

TheValueist banner
TheValueist

TheValueist

@TheValueist

Disc L/S | TMT+Energy. ISO convexity. Factor aware. Path independence matters. Results never lie. NFA. Student of mkts and cos. Creator: CRAVE Thesis of GAI.

Above the Noise Katılım Eylül 2024
10K Takip Edilen36.6K Takipçiler
Sabitlenmiş Tweet
TheValueist
TheValueist@TheValueist·
Equity Trading Through Counterparty Analysis and Edge This presents a framework for successful discretionary long/short equity trading that centers on counterparty analysis rather than abstract valuation alone. A trader must constantly ask who is on the other side of the transaction and why they are willing to trade at the current price, linking execution to a test of a trader's edge. This perspective suggests that the most profitable trades occur when one is transacting against non-fundamental, forced flows driven by factors like benchmark constraints, indexing, or risk management.
English
11
14
163
175.2K
TheValueist
TheValueist@TheValueist·
AI MEMORY AND STORAGE HBM, SERVER DRAM AND ENTERPRISE SSD DEMAND RECEIVE A HIGH-CONVICTION POSITIVE READ-THROUGH (READ-THROUGH 6) Affected companies: Micron Technology, Inc. (MU: US), SK hynix Inc. (000660: South Korea) and Samsung Electronics Co., Ltd. (005930: South Korea). Directional impact: positive. Magnitude: high for HBM and moderate to high for server DRAM and enterprise SSDs. Conviction: high. Primary horizon: near-term component procurement and durable content growth. The memory transmission mechanism is direct and content-intensive. Every advanced accelerator contains multiple HBM stacks, while each server node also requires large quantities of conventional DRAM and local or shared flash storage. An illustrative Supermicro NVIDIA HGX B300 configuration contains 2.1 terabytes of HBM3E per 8-GPU system. A 144-GPU rack built from 18 such systems would therefore contain approximately 37.8 terabytes of HBM before conventional system memory and storage. The configuration is illustrative rather than a disclosure of Q4 order mix, but it demonstrates why a comparatively small number of AI racks can create very large memory-bit demand. The filing reinforces an already tight memory environment. Micron reported fiscal Q3 2026 data-center revenue above $25 billion, data-center SSD revenue above $5 billion and DRAM and NAND demand materially exceeding supply, with tight conditions expected beyond calendar 2027. SK hynix continues to position HBM as the memory layer closest to the AI accelerator and has prepared HBM4 for production. Samsung expects its HBM sales to increase by more than 3x in 2026 and is expanding HBM4 capacity. Supermicro’s record order intake, combined with Dell and HPE backlog growth, indicates that this demand is supported by multiple server channels rather than a single OEM. SK hynix has the strongest direct sensitivity to HBM volume and pricing. Micron has broad leverage across HBM, server DRAM, data-center SSD and NAND, creating a more diversified AI memory read-through. Samsung benefits from HBM4 adoption and broader DRAM and NAND content, although the magnitude depends on qualification timing and production execution. Increasing HBM content per accelerator generation and rising conventional memory requirements for inference, retrieval, caching and agentic workloads make this a longer-duration content story rather than only a unit story. Near-term component purchases may precede completed-server shipments because Supermicro must secure memory alongside accelerators. This creates the possibility that memory suppliers recognize revenue while the finished systems remain in Supermicro inventory or await customer acceptance. The principal downside is an inventory correction if non-firm system orders are cancelled after memory has been procured. Tight industry supply, multi-OEM demand and long qualification cycles reduce but do not eliminate that risk. AI NETWORKING AND CONNECTIVITY AI NETWORKING SILICON AND SYSTEM DEMAND SHOULD CONTINUE TO OUTGROW SERVER UNIT VOLUMES (READ-THROUGH 7) Affected companies: Broadcom Inc. (AVGO: US), Arista Networks, Inc. (ANET: US) and Marvell Technology, Inc. (MRVL: US). Directional impact: positive. Magnitude: moderate to high. Conviction: high at the industry level and moderate at the direct supplier level. Primary horizon: near-term order support and long-duration bandwidth and fabric-content expansion. Supermicro’s DCBBS architecture extends beyond compute nodes to switching, cabling, network validation, software and cluster deployment. Its NVIDIA SuperCluster designs scale from 256 GPUs to 768 GPUs using non-blocking fabrics. As cluster sizes increase, network bandwidth, port count, optical reach and fabric redundancy grow faster than the number of server enclosures. The relevant content includes switch ASICs, Ethernet and InfiniBand adapters, NICs and DPUs, retimers, PCIe switches, optical DSPs, transceivers and complete switching systems. Broadcom’s fiscal Q2 2026 AI semiconductor revenue reached $10.8 billion, increasing 143 percent year over year, driven by custom accelerators and AI networking. The company expected fiscal Q3 AI semiconductor revenue of approximately $16.0 billion, increasing more than 200 percent. Arista’s fiscal Q1 2026 revenue increased 35.1 percent year over year, and its 1.6-terabit platforms are explicitly designed for rack-scale AI scale-up and scale-out fabrics. Marvell’s data-center business has been supported by robust AI demand and record bookings, while its 102.4-terabit-per-second switch architecture targets higher-radix, lower-power AI networks. Supermicro’s order intake is consistent with those trajectories and reduces the probability that current networking growth reflects only advance purchasing rather than completed-system demand. The direct read-through is less certain than for NVIDIA or HBM suppliers because Supermicro’s disclosed NVIDIA configurations frequently incorporate NVIDIA Quantum InfiniBand, Spectrum Ethernet and ConnectX networking. NVIDIA may therefore capture a substantial portion of the networking economics within those specific racks. Arista, Broadcom and Marvell are better viewed as beneficiaries of the broader expansion in Ethernet AI fabrics, custom accelerators, scale-across architectures and data-center interconnect rather than as disclosed suppliers to the $60 billion order block. The long-duration implication remains positive because network bandwidth per accelerator is rising, cluster utilization increasingly depends on fabric performance, and networking power consumption has become a material design constraint. Growth in 800-gigabit and 1.6-terabit links can sustain networking revenue even if server unit growth moderates. The negative risk is architecture concentration: wider adoption of vertically integrated accelerator and networking platforms could shift value toward NVIDIA and hyperscaler-designed silicon at the expense of independent system and component vendors. DATA-CENTER POWER AND THERMAL INFRASTRUCTURE POWER, LIQUID COOLING AND ELECTRICAL INFRASTRUCTURE ARE AMONG THE STRONGEST LONG-DURATION BENEFICIARIES (READ-THROUGH 8) Affected companies: Vertiv Holdings Co (VRT: US) and Eaton Corporation plc (ETN: Ireland). Directional impact: positive. Magnitude: high. Conviction: high. Primary horizon: near-term order acceleration and multi-year infrastructure deployment. The physical-density implications of Supermicro’s order book are substantial. A disclosed high-density NVIDIA HGX B300 configuration supports as many as 144 GPUs per rack, with each GPU operating at as much as 1,100 watts. GPU thermal design power alone would therefore reach approximately 158.4 kilowatts per rack before CPUs, memory, storage, networking, power conversion and cooling pumps. Supermicro’s architecture uses direct liquid cooling capable of capturing as much as 98 percent of system heat and includes coolant-distribution units with capacities reaching 1.8 megawatts. These systems cannot be deployed without major facility-level investments in utility interconnection, switchgear, transformers, UPS systems, busway, power distribution, backup generation, coolant distribution, heat rejection and control systems. The more than $60 billion order intake therefore implies a much larger associated facility-capital requirement than the server order value alone. The gap between exceptional orders and revenue near the bottom of guidance may indicate that data-center readiness is constraining delivery or customer acceptance. This is an inference rather than a cause identified by Supermicro; component availability, customer scheduling, export controls and platform transitions could also contribute. Nevertheless, power and cooling are increasingly probable gating factors as rack density exceeds traditional data-center design limits. When facility readiness delays server recognition, power and cooling vendors may still receive orders and deposits earlier in the deployment cycle. Vertiv reported fiscal Q1 2026 sales growth of 30 percent, including 44 percent organic growth in the Americas driven by data-center demand, and guided to 29 percent to 31 percent full-year organic growth. Eaton reported 16 percent organic order growth and 31 percent backlog growth in Electrical Americas, driven partly by data-center momentum, and has developed a grid-to-chip architecture with NVIDIA for modular AI factories. Supermicro’s order expansion adds system-level support to the duration of those order books and indicates that power-density requirements continue to rise faster than general data-center square footage. The transmission mechanism differs by vendor. Vertiv benefits through thermal management, coolant-distribution systems, UPS equipment, power-distribution units, modular infrastructure and service. Eaton benefits through medium- and low-voltage switchgear, busway, circuit protection, power distribution, utility-interface equipment and increasingly integrated thermal solutions. The highest-value opportunity is not merely replacing air cooling with liquid cooling; it is redesigning the entire electrical and thermal path from the grid to the chip. Supermicro’s own liquid-cooling integration creates a limited competitive negative for third-party rack-level cooling providers. DCBBS can internalize manifolds, cold plates, in-row coolant-distribution units and rack engineering that might otherwise be supplied externally. However, Supermicro cannot internalize most facility-level generation, utility interconnection, switchgear, UPS, busway, building controls or heat rejection. Higher compute density expands the external infrastructure requirement even when Supermicro captures more rack-level content. The net read-through for Vertiv and Eaton remains strongly positive. PORTFOLIO SYNTHESIS The highest-conviction positive conclusion is that AI infrastructure demand remains exceptionally strong and is broad enough to support several server OEMs and a large upstream supplier ecosystem. The strongest direct beneficiaries are NVIDIA and the HBM suppliers because accelerator and memory purchases are required before integrated system delivery. Vertiv and Eaton offer highly attractive long-duration exposure because power and thermal infrastructure increasingly determine whether server orders can convert into operating compute capacity. TSMC receives confirmatory support for advanced-node and CoWoS demand, while Broadcom, Arista and Marvell receive a positive but less direct networking read-through. Dell and HPE receive a positive relative-quality signal. Their AI backlogs are validated by an independent and much larger Supermicro order disclosure, while their positive cash generation and broader financing and service capabilities contrast with Supermicro’s substantial working-capital consumption and equity dependence. The sector is not becoming less competitive, but balance-sheet capacity is becoming a more important determinant of sustainable market share and risk-adjusted earnings quality. Supermicro presents a divided investment signal. The near-term earnings catalyst is clearly positive because the gross-margin surprise can create a large operating-income beat even with revenue at the bottom of guidance. The longer-duration signal is materially less favorable because order enforceability, conversion timing, customer concentration, financing requirements, preferred claims, common-equity dilution, internal controls and export-related reviews remain unresolved. The most likely non-consensus outcome is that Supermicro reports unusually strong Q4 earnings while simultaneously demonstrating that future growth requires significantly more working capital and carries lower cash-conversion quality than the headline backlog suggests. The dominant cross-portfolio implication is that upstream suppliers may monetize the AI order cycle earlier and with less balance-sheet risk than the system integrator. Supermicro must finance components, carry inventory, integrate racks, wait for data-center readiness, complete acceptance procedures and collect receivables. GPU, memory, foundry, networking and power-infrastructure suppliers can receive orders substantially earlier in that sequence. The July filing therefore supports continued AI supply-chain earnings momentum while reinforcing the need to differentiate revenue growth, gross-profit growth, order quality and free-cash-flow conversion rather than treating them as interchangeable signals. The August 11, 2026 report will determine whether the preliminary update represents the beginning of a structurally better DCBBS economic model or a temporary mix-driven margin spike. The critical disclosures are the final revenue and earnings figures, gross-margin composition, total backlog, firm versus cancellable order proportions, customer deposits, delivery cadence, supplier commitments, inventory and receivables balances, operating cash flow, preferred-dividend impact, common-equity dilution, export-review status and any revisions to prior periods. Until those data are available, the highest-conviction positioning implication favors upstream AI components, memory and power infrastructure over an unqualified exposure to Supermicro’s headline order value.
English
0
0
4
1.2K
TheValueist
TheValueist@TheValueist·
$SMCI KEY READ-THROUGHS FROM SUPERMICRO’S FISCAL Q4 2026 PRELIMINARY BUSINESS UPDATE OVERVIEW Supermicro’s July 21, 2026 preliminary update presents 3 simultaneous signals with materially different implications: fiscal Q4 revenue is expected to be “near the low end” of the prior $11.0 billion to $12.5 billion range; GAAP and non-GAAP gross margin is expected to reach 15 percent to 17 percent versus prior guidance of 8.2 percent to 8.4 percent because of “favorable customer and product mix”; and quarterly order intake exceeded $60 billion while backlog reached a record. At approximately $11.0 billion of revenue, the preliminary margin range implies gross profit of approximately $1.65 billion to $1.87 billion, compared with only approximately $0.90 billion to $0.92 billion under the prior margin guidance. The implied $0.73 billion to $0.97 billion gross-profit uplift is economically more important for near-term earnings than the revenue shortfall relative to the midpoint. However, order intake exceeding 5.4x quarterly revenue, combined with weak revenue conversion and explicit cancellation language, means the update is not an unqualified backlog or revenue-quality beat. It is a major near-term gross-profit beat embedded within an increasingly capital-intensive, execution-sensitive and difficult-to-underwrite order-conversion model. The broad market read-through is strongly positive for aggregate AI infrastructure demand and for suppliers that can recognize component revenue before Supermicro completes and accepts an integrated system. The read-through is materially less positive for Supermicro’s cash conversion because the company must purchase expensive GPUs, memory, networking, power and cooling components well before final system revenue is recognized. The principal constraint appears to be shifting from end demand toward component financing, site readiness, power availability, liquid-cooling deployment, systems integration and customer acceptance. Customer identities and Q4 geographic mix were not disclosed, precluding a high-conviction read-through to any named hyperscaler, neocloud or sovereign buyer. Historical concentration remains relevant: the US represented 68.7 percent of fiscal Q3 sales, and the largest customer represented 27.0 percent of quarterly revenue. AI SERVER OEMS AND SYSTEM INTEGRATORS SUPERMICRO’S NEAR-TERM EARNINGS POWER IS MATERIALLY ABOVE PRIOR GUIDANCE (READ-THROUGH 1) Affected company: Super Micro Computer, Inc. (SMCI: US). Directional impact: positive. Magnitude: high. Conviction: high. Primary horizon: near-term trading catalyst, with limited confidence in long-duration margin persistence. The 15 percent to 17 percent gross-margin range represents a 680 to 880 basis-point improvement relative to the prior 8.2 percent to 8.4 percent guidance and a 510 to 710 basis-point sequential improvement relative to fiscal Q3’s 9.9 percent GAAP margin. At approximately $11.0 billion of revenue, gross profit would be approximately $1.65 billion to $1.87 billion. Holding operating expenses, interest expense and other items approximately consistent with the prior framework, most of the $0.73 billion to $0.97 billion gross-profit variance should flow through to pretax income. Using the previously guided tax rates of approximately 19 percent to 20 percent and the previously guided diluted share counts of 695 million to 712 million, the incremental gross profit mechanically equates to approximately $0.81 to $1.12 of additional diluted earnings per share before June financing dilution, preferred dividends, incremental operating costs, financing fees and closing adjustments. This is not an earnings forecast, but it demonstrates that the earnings sensitivity is substantially larger than the approximately $0.53 to $0.67 GAAP and $0.65 to $0.79 non-GAAP earnings-per-share ranges previously guided. The immediate catalyst is the August 11, 2026 earnings release, when reported earnings, operating expenses, financing costs, tax treatment and diluted share count will determine how much of the gross-profit surprise reaches common shareholders. The update should trigger a substantial upward reset to near-term operating-income expectations unless material offsets emerge. The lack of preliminary earnings-per-share disclosure increases uncertainty around those offsets, particularly after the June capital raise and while the financial close and independent review remain incomplete. The margin result should not be annualized without detailed mix disclosure. Revenue near the bottom of guidance and gross margin far above guidance can coexist if lower-margin, large-scale AI deployments were delayed while higher-margin enterprise systems, storage, networking, services, liquid-cooling content or less price-sensitive customer configurations were recognized. The company attributed the result primarily to customer and product mix rather than structural pricing or manufacturing-cost improvement. The $60 billion order pool may contain a different economic mix from the revenue recognized in Q4. If the delayed portion is concentrated in very large GPU deployments with high pass-through component content and aggressive customer pricing, backlog conversion could produce strong revenue but substantially lower margins in subsequent quarters. The key distinction is therefore between a durable DCBBS value-capture improvement and a temporary shipment-mix benefit. Current evidence supports a major quarterly earnings beat but does not yet support a structurally higher 15 percent to 17 percent gross-margin model. SUPERMICRO’S ORDER QUALITY, CASH CONVERSION, DILUTION AND CONTROL RISKS REMAIN MATERIAL (READ-THROUGH 2) Affected company: Super Micro Computer, Inc. (SMCI: US). Directional impact: negative. Magnitude: high. Conviction: high. Primary horizon: near-term event risk and long-duration balance-sheet and governance risk. The headline order number is substantially less secure than contracted backlog. Supermicro reported new Q4 orders “in excess of $60 billion,” but also stated that some orders “may not constitute firm commitments” and may be cancelled or delayed. The June financing announcement had already identified approximately $39 billion of advanced AI server and DCBBS orders from more than 20 customers. Assuming that tranche is included in the Q4 total, the July update appears to imply more than approximately $21 billion of additional orders beyond the previously disclosed block. This is a major positive demand signal, but it does not create a $60 billion revenue floor. The relevant underwriting variables are the proportion supported by non-refundable deposits, cancellation penalties, committed delivery slots, customer financing, completed data-center capacity, export approvals and firm component allocations. None was disclosed. The divergence between more than $60 billion of quarterly orders and approximately $11 billion of revenue indicates that booking velocity is substantially ahead of manufacturing, deployment and acceptance. That divergence may reflect expected future delivery rather than execution failure, but it materially increases duration and counterparty risk. The customer retains flexibility to delay an installation when power, cooling, networking or construction schedules slip, while Supermicro may already have committed cash to GPUs, memory and other components. Order duration therefore transfers economic risk from the customer to Supermicro unless deposits and cancellation protections are substantial. The August 11 disclosure on firm backlog, order aging, delivery cadence and customer deposits will be more important than the absolute order number. The working-capital position entering Q4 was already stretched. Between June 30, 2025 and March 31, 2026, cash declined from $5.17 billion to $1.29 billion, accounts receivable increased from $2.20 billion to $8.41 billion, and inventory increased from $4.68 billion to $11.10 billion. Inventory therefore exceeded an entire quarter of current revenue, while accounts receivable equaled approximately 82 percent of fiscal Q3 revenue. Operating cash flow was negative $7.56 billion during the 9 months ended March 31, 2026, despite $1.05 billion of net income. Management attributed the deterioration to inventory purchases, customer receivables, requests for longer payment terms caused by rising system costs and longer lead times for certain components. The order expansion intensifies rather than resolves this funding requirement. The June financing package demonstrates that the order book is not self-funding. Supermicro priced 45.45 million common shares and 75.0 million depositary shares representing mandatory convertible preferred equity, while establishing a potential $1.25 billion at-the-market program. The total potential financing was described as $7.0 billion and was explicitly intended in part to purchase components for the approximately $39 billion order block. The preferred security carries a 7.0 percent dividend and will convert into approximately 1.5152 to 1.8182 common shares per depositary share. Including the common offering, the structure represents approximately 159.1 million to 181.8 million potential new common-equivalent shares before underwriter options and the ATM program, equivalent to approximately 26.5 percent to 30.2 percent of the approximately 601.4 million shares outstanding before the transaction. The initial $3.75 billion preferred issuance also creates approximately $262.5 million of annual preferred dividends, payable in cash, shares or a combination. The result is a meaningful transfer of AI demand upside away from existing common shareholders through dilution and preferred claims. Customer concentration compounds the funding risk. The largest customer represented 27.0 percent of fiscal Q3 revenue, a separate customer represented 10.3 percent, and Supermicro occasionally grants extended payment terms without generally requiring collateral beyond delivered products. The disclosure of more than 20 customers in the June order block is directionally constructive but does not establish balanced allocation across those customers. A small number of very large buyers could still account for most of the economic exposure, negotiate long payment terms and exert significant pricing leverage. Governance and reporting risk remain independent of operating demand. The board is conducting an independent review of transactions connected with alleged export-control issues, and the company stated that the outcome could affect forecasts, preliminary Q4 results and prior-period results. The company’s independent accounting firm had not audited, reviewed, compiled or performed procedures on the preliminary revenue or margin estimates. The fiscal Q3 filing also stated that identified material weaknesses could not be considered remediated until controls had operated and been tested for a sufficient period. These issues create binary downside around revisions, compliance costs, customer confidence, export licenses and the timing or reliability of subsequent filings. The near-term earnings surprise is therefore positive, but the appropriate valuation multiple should continue to reflect materially elevated accounting, governance, regulatory and cash-conversion risk. DELL AND HPE BENEFIT FROM DEMAND VALIDATION AND SUPERIOR SELF-FUNDING, OFFSET BY PERSISTENT SMCI COMPETITIVE PRESSURE (READ-THROUGH 3) Affected companies: Dell Technologies Inc. (DELL: US) and Hewlett Packard Enterprise Company (HPE: US). Directional impact: positive for demand and relative business quality; neutral to negative for competitive intensity. Magnitude: moderate to high. Conviction: high. Primary horizon: near-term estimate support and long-duration competitive differentiation. Supermicro’s order intake substantially reduces the probability that the recent AI server backlog expansion at Dell and HPE is company-specific or generated primarily by order transfers among vendors. Dell exited fiscal Q1 2027 with $24.4 billion of quarterly AI server orders, $16.1 billion of AI server revenue and a $51.3 billion backlog, while raising fiscal-year AI server revenue expectations to $60 billion. HPE reported $1.8 billion of new AI systems orders and a record $5.9 billion AI systems backlog, primarily comprising enterprise and sovereign demand. The coexistence of more than $60 billion of quarterly orders at Supermicro, $51.3 billion of Dell backlog and $5.9 billion of HPE backlog indicates a market expanding fast enough to support multiple scaled vendors. The aggregate evidence is inconsistent with a near-term AI server demand air pocket. The relative-quality read-through favors Dell and HPE because balance-sheet capacity is becoming a competitive capability. Dell generated $4.1 billion of operating cash flow in fiscal Q1 2027 while supporting its AI growth, and HPE generated $1.4 billion of operating cash flow and $915 million of free cash flow in fiscal Q2 2026. Supermicro consumed $7.56 billion of operating cash during the 9 months through March and subsequently accessed equity and mandatory convertible financing. Large customers increasingly require vendors to pre-purchase scarce accelerators and memory, hold inventory through construction delays, offer financing, extend payment terms, perform onsite integration and support multi-year deployments. Dell’s and HPE’s broader service, financing and supply-chain platforms allow those companies to absorb working-capital volatility without relying as heavily on dilutive external equity. This advantage should matter most in enterprise and sovereign projects where vendor viability, global support and long-term service obligations are integral to the procurement decision. The margin read-through is not uniformly positive. Dell has stated that increased AI-optimized server mix reduced gross-margin rates even as gross-profit dollars and operating income increased. Supermicro’s Q4 margin increase was explicitly attributed to favorable customer and product mix and therefore should not be extrapolated as evidence that industrywide AI server hardware margins have permanently expanded. The more defensible sector conclusion is that absolute gross-profit dollars can grow rapidly with AI volume, while percentage margins remain highly dependent on customer concentration, GPU pass-through content, services attachment, storage and networking mix, supplier rebates, integration scope and deployment complexity. Competitive pressure from Supermicro remains significant. The June order block involved more than 20 customers, and DCBBS combines compute, storage, networking, cabling, liquid cooling, management software, onsite installation and support. That integrated architecture directly targets the same full-stack opportunity pursued by Dell and HPE. The long-duration read-through is consequently positive for industry revenue but mixed for market share. Dell and HPE benefit from a larger addressable market and stronger self-funding, while Supermicro’s speed, density and liquid-cooling integration prevent the market from becoming an uncontested incumbent-OEM opportunity. AI ACCELERATORS AND ADVANCED LOGIC NVIDIA REMAINS THE CLEAREST DIRECT UPSTREAM BENEFICIARY (READ-THROUGH 4) Affected company: NVIDIA Corporation (NVDA: US). Directional impact: positive. Magnitude: high. Conviction: high. Primary horizon: near-term order and shipment support with a durable multi-customer demand signal. Supermicro’s order expansion provides direct system-level validation for NVIDIA’s Blackwell and Blackwell Ultra demand. During fiscal Q3, Supermicro’s AI GPU-related product sales increased by $5.16 billion, or 150.5 percent year over year, and included liquid-cooled and air-cooled systems. Supermicro had previously disclosed more than $13 billion of Blackwell Ultra orders in fiscal Q1. Its current portfolio includes NVIDIA HGX B300, B200, GB300 and GB200 systems, as well as NVIDIA ConnectX, Quantum InfiniBand and Spectrum Ethernet networking. The June $39 billion order announcement was specifically described as advanced AI server and DCBBS demand, while the July update expanded total Q4 order intake above $60 billion. The combination supports continued high accelerator shipment volumes rather than a demand plateau after the initial Blackwell ramp. The transmission mechanism is unusually favorable for NVIDIA relative to Supermicro. GPUs and associated networking represent a dominant proportion of the bill of materials in advanced AI systems. Supermicro raised capital specifically to purchase components before completing the associated server deliveries. NVIDIA and its manufacturing partners can therefore receive purchase orders and potentially recognize revenue before Supermicro records final system revenue, while Supermicro retains integration, inventory, installation, customer-acceptance and receivables risk. This timing asymmetry implies stronger near-term upstream revenue visibility than the low-end Supermicro revenue result would suggest. The breadth of the June order pool is also strategically positive. More than 20 customers reduces dependence on a single hyperscaler and indicates that advanced AI infrastructure demand is extending across neocloud, enterprise, sovereign and other data-center buyer categories. Broader customer adoption improves the duration of the accelerator cycle because deployment timing and capital budgets are less synchronized than under a narrowly concentrated hyperscaler model. The $60 billion figure should not be treated as NVIDIA revenue. It includes CPUs, HBM, conventional memory, storage, network equipment, chassis, power, cooling, software, integration and services. Supermicro supports accelerator platforms from multiple silicon vendors, and the July release did not disclose vendor allocation. Some orders may also be cancelled or delayed. Nevertheless, prior Blackwell-specific order disclosure, current NVIDIA system density and the historical concentration of Supermicro’s growth in AI GPU products make NVIDIA the highest-conviction semiconductor beneficiary. TSMC AND ADVANCED PACKAGING RECEIVE ADDITIONAL END-MARKET VALIDATION, BUT THE SIGNAL IS PRIMARILY CONFIRMATORY (READ-THROUGH 5) Affected company: Taiwan Semiconductor Manufacturing Company Limited (TSM: Taiwan). Directional impact: positive. Magnitude: moderate to high. Conviction: high. Primary horizon: long-duration leading-edge wafer and advanced-packaging demand, with limited incremental near-term estimate impact. Supermicro’s order data confirms demand at the completed-system layer and therefore adds credibility to the accelerator, CPU and custom-silicon forecasts already embedded in TSMC’s capacity plans. Advanced AI servers require leading-edge logic wafers, chiplet integration, high-density substrates and advanced packaging such as CoWoS. The more than $60 billion order intake implies substantial future demand for accelerators and related silicon, regardless of whether the ultimate compute architecture is based on merchant GPUs, custom XPUs or increasingly important AI-host CPUs. TSMC’s July 2026 commentary already indicated that AI-related demand remained extremely robust, that customer and customer-customer signals remained strong, and that 2026 US-dollar revenue growth was expected to be slightly above 40 percent. TSMC raised its 2026 capital budget to $60 billion to $64 billion, with approximately 70 percent to 80 percent allocated to advanced process technology and approximately 10 percent to 20 percent allocated to advanced packaging, testing, mask-making and related investments. TSMC also stated that most advanced AI packaging continued to use CoWoS. The Supermicro filing reinforces those decisions, but much of the demand was likely already visible to TSMC through accelerator vendors and cloud customers. The update is therefore confirmatory rather than independently estimate-changing for TSMC. The near-term transmission occurs through higher utilization of advanced nodes and packaging capacity, continued allocation discipline and increased customer willingness to provide long-range capacity commitments. The longer-duration transmission occurs through sustained 2-nanometer, 3-nanometer and advanced-packaging investment as AI systems incorporate more compute dies, larger packages and more complex interconnect. System-level deployment delays may shift the timing of completed-server revenue without immediately reducing wafer or packaging shipments if components have already been ordered. This timing dynamic again places upstream suppliers in a comparatively favorable position. The downside risk is that extended system-delivery delays could eventually create accelerator inventory and cause customers to revise wafer or packaging commitments. Supermicro’s explicit order-cancellation language prevents the filing from being interpreted as riskless foundry demand. However, TSMC’s broader customer signals, rising capital budget and multi-architecture exposure materially diversify that risk.
TheValueist@TheValueist

$SMCI (Bloomberg) -- Super Micro Computer Inc. shares rose about 15% in extended trading after the server maker issued preliminary results saying its backlog hit a record on new orders in the quarter of more than $60 billion. Sales have surged for Super Micro’s servers fitted with Nvidia Corp. chips for artificial intelligence workloads. But the company has been working to get costs under control while vying with rivals to rapidly get those machines into customers’ hands and win business in a growing AI market. Super Micro said Tuesday in a statement that gross margins in the quarter ended June 30 are estimated to be in the range of 15% to 17%, which is better-than-forecast and a sign the company is making progress selling more profitable products. Fiscal fourth-quarter revenue will fall on the low end of the previous guidance of $11 billion to $12.5 billion, the company said. Analysts, on average, estimated $11.8 billion. The shares had declined 13% this year through the close, including a 28% fall on a single day last month after Super Micro announced a plan to raise $7 billion through a package of equity offerings. The company said Tuesday that the new orders “are expected to be delivered over future quarters,” which is a positive sign for future revenue and suggests that Super Micro is winning more contracts. The San Jose, California-based company is scheduled to report full quarterly results on Aug. 11. (Updates with comments from company in the fifth paragraph.)

English
1
1
4
4.4K
TheValueist
TheValueist@TheValueist·
$VICR (Bloomberg) -- (Updates shares.) Vicor shares fall as much as 12% after the power equipment company reported results. Though second-quarter sales and earnings per share beat analyst estimates, they failed to impress investors after the shares more than doubled this year through Monday.  SECOND QUARTER RESULTS •Net revenue $143.4 million, +1.6% y/y, estimate $138.3 million (Bloomberg Consensus) •EPS $1.04 vs. 91c y/y, estimate 63c •Income from operations $34.9 million, -23% y/y, estimate $33.2 million (2 estimates) NOTE •For Bloomberg Consensus estimates used in this story see: VICR Equity MODL •4 buys, 0 holds, 0 sells
TheValueist@TheValueist

$VICR +10% pre on raised guidance. I'm long VICR 1/21/28 c400. Power semis up across the board. (Dow Jones) -- Vicor raised its second-quarter revenue guidance due to rising product revenues and royalties from an additional licensee to its power system technology. The company boosted its second-quarter revenue outlook to $142 million from $126 million. The new license includes all of Vicor's patents covering power converter topologies, control systems, power components and distribution architectures. Shares rose 7.5% to $288 in premarket trading.

English
1
0
5
6.9K
TheValueist
TheValueist@TheValueist·
$SMCI (Bloomberg) -- Super Micro Computer Inc. shares rose about 15% in extended trading after the server maker issued preliminary results saying its backlog hit a record on new orders in the quarter of more than $60 billion. Sales have surged for Super Micro’s servers fitted with Nvidia Corp. chips for artificial intelligence workloads. But the company has been working to get costs under control while vying with rivals to rapidly get those machines into customers’ hands and win business in a growing AI market. Super Micro said Tuesday in a statement that gross margins in the quarter ended June 30 are estimated to be in the range of 15% to 17%, which is better-than-forecast and a sign the company is making progress selling more profitable products. Fiscal fourth-quarter revenue will fall on the low end of the previous guidance of $11 billion to $12.5 billion, the company said. Analysts, on average, estimated $11.8 billion. The shares had declined 13% this year through the close, including a 28% fall on a single day last month after Super Micro announced a plan to raise $7 billion through a package of equity offerings. The company said Tuesday that the new orders “are expected to be delivered over future quarters,” which is a positive sign for future revenue and suggests that Super Micro is winning more contracts. The San Jose, California-based company is scheduled to report full quarterly results on Aug. 11. (Updates with comments from company in the fifth paragraph.)
English
4
2
3
5.9K
TheValueist
TheValueist@TheValueist·
DATA-CENTER ELECTRICAL AND THERMAL INFRASTRUCTURE HIGHER CHIP-LEVEL POWER DENSITY EXTENDS THE DATA-CENTER POWER AND COOLING INVESTMENT CYCLE (READ-THROUGH 5) Affected companies: Vertiv Holdings Co (VRT: US); Eaton Corporation plc (ETN: Ireland); Schneider Electric SE (SU: France); nVent Electric plc (NVT: Ireland); Modine Manufacturing Company (MOD: US). Directional impact and magnitude: Positive. The longer-duration impact is moderate-to-high for Vertiv and Modine because of their direct exposure to high-density cooling and data-center infrastructure, and moderate for Eaton, Schneider Electric, and nVent because their businesses are more diversified. The near-term earnings impact from the Vicor call alone is limited because the broader Gen 2 VPD ramps discussed by management are weighted toward late 2027. Vicor stated that AI hyperscalers and OEMs need vertical power delivery to meet compute-density requirements. The company has reached 3 amps per square millimeter and expects to exceed 5 amps per square millimeter, compared with management’s estimate that existing competitive architectures deliver only slightly more than 1 amp per square millimeter under real-world conditions. Management also cited current gain above 40 and a package height of approximately 1.5 millimeters. The transmission mechanism operates through increased feasible processor and rack power. Better point-of-load power delivery reduces voltage drop, current-related conductor losses, thermal stress around the processor, and the board area required for conventional voltage-regulation components. This allows accelerator vendors and hyperscalers to place more compute into a given package, server, rack, and data-hall footprint. Higher compute density increases demand for rack-level power distribution, busway, switchgear, uninterruptible power systems, high-current connectors, liquid cooling, heat rejection, and thermal monitoring. Vertiv and Modine are the most directly exposed to the cooling and thermal portion of this transition. Eaton and Schneider benefit from higher electrical-distribution and power-quality requirements. nVent benefits from electrical connection, protection, enclosure, and liquid-cooling infrastructure. Vicor’s efficiency advantage is a partial offset. Management estimated that some competing IVR approaches can impose approximately 10%-15% insertion loss. Eliminating part of that loss reduces waste heat per unit of compute and may lower the infrastructure burden for an unchanged workload. The more likely system-level outcome, however, is that the recovered power and thermal headroom is reinvested into additional accelerator density. The call’s emphasis was not on reducing total rack power but on enabling systems that otherwise could not be powered at the required density. The near-term catalyst is evidence that hyperscalers and OEMs are engaging in system-level design work during 2026, which can pull forward planning and procurement for next-generation cooling and power systems. The longer-duration shift begins as 3-5-amp-per-square-millimeter architectures enter production in 2027 and 2028. This supports the view that the data-center electrical and thermal investment cycle is structural rather than confined to the current generation of GPU clusters. SEMICONDUCTOR TEST EQUIPMENT AI-DRIVEN TEST INTENSITY IS A POSITIVE DEMAND SIGNAL FOR ATE (READ-THROUGH 6) Affected companies: Advantest Corporation (6857: Japan); Teradyne, Inc. (TER: US). Directional impact and magnitude: Positive. The impact is moderate for Advantest because of its greater sensitivity to AI accelerator, high-performance-compute, and high-bandwidth-memory testing, and low-to-moderate for Teradyne because of its broader end-market mix. Vicor described automatic test equipment as “a great story” and stated that it is “firmly entrenched in some of the biggest ATE companies.” Management said competing power vendors have been unable to displace Vicor because they cannot match the company’s low-noise performance, signal integrity, and thin-package architecture. The ATE market was also described as growing. The transmission mechanism is rising electrical and thermal complexity in semiconductor test. AI accelerators, advanced-node processors, chiplets, high-bandwidth memory, and advanced packages draw large and rapidly changing currents while requiring precise voltage control and low electrical noise. Test platforms must reproduce these operating conditions without introducing measurement error or instability. Higher device power and more complex packaging therefore increase the value of advanced power delivery inside the tester. This creates several economic benefits for ATE suppliers. Test-system power subsystems become more complex and expensive. Customers may need to upgrade installed testers to handle higher current, lower voltages, and more demanding transient behavior. Test time can increase as the number of dies, chiplets, memory interfaces, and power domains rises. These factors support higher system average selling prices, more frequent upgrades, and stronger service and instrumentation demand. Vicor’s own order activity provides an upstream confirmation that major ATE vendors are building or upgrading platforms capable of testing the next generation of high-power devices. This is particularly supportive for Advantest, whose AI and high-performance-compute exposure makes it more sensitive to the current accelerator and HBM test cycle. Teradyne also benefits, although the magnitude is diluted by its broader mobile, industrial, automotive, and robotics exposure. The near-term trading read-through is favorable because Vicor characterized the ATE business as currently strong rather than merely a future opportunity. The longer-duration implication is that power integrity and thermal performance become larger components of tester differentiation, increasing the capital intensity and technical barriers associated with high-end semiconductor test. OVERSEAS ATE ENTRANTS ARE MOVING UP THE PERFORMANCE CURVE (READ-THROUGH 7) Affected companies: Advantest Corporation (6857: Japan); Teradyne, Inc. (TER: US). Directional impact and magnitude: Negative over the longer term. The near-term impact is low because the entrants were not identified and no market-share data were provided. The longer-term impact could be moderate in regional markets if new competitors achieve sufficient performance to qualify for advanced logic, AI accelerator, or memory testing. Management stated that the ATE market is growing “with new entrants in overseas markets that we’re also designing in our FPA solutions into.” This is a more important competitive signal than a generic statement that low-end test vendors are entering the market. Adoption of Vicor’s Factorized Power Architecture indicates that these entrants are investing in low-noise, high-current, thin-package power systems suitable for technically demanding test platforms. The transmission mechanism is a narrowing of the subsystem-performance gap between established ATE leaders and regional competitors. Advanced power delivery is one of the requirements for testing high-current, low-voltage devices. An entrant using premium power technology can potentially offer better transient performance, lower noise, and greater current density without having to develop the entire power subsystem internally. This reduces 1 barrier to competing for higher-value test applications. The comment also carries a geographic localization signal. Although the call did not identify the countries or companies involved, the willingness of regional entrants to adopt sophisticated power architecture suggests that local ATE ecosystems are progressing beyond basic or mature-node testing. This could create future pricing pressure and domestic-market share erosion for Advantest and Teradyne, particularly where government policy, customer procurement preferences, or supply-chain localization favor local suppliers. The negative read-through should not be overstated. High-end ATE competitiveness also depends on measurement accuracy, instrumentation breadth, software, applications engineering, installed base, service capability, customer qualification, and intellectual property. Power delivery is necessary but not sufficient. The call nevertheless indicates that new entrants are investing in the correct enabling technologies to compete at a higher performance level. The near-term catalyst is limited because Vicor did not quantify the associated revenue or identify production schedules. The longer-duration catalyst would be evidence that regional ATE vendors are winning advanced-node, AI, or HBM test programs that historically would have been served by Advantest or Teradyne. The most appropriate portfolio interpretation is a favorable near-term demand signal for the ATE industry combined with a modestly more competitive long-term market structure.
English
0
0
1
997
TheValueist
TheValueist@TheValueist·
$VICR KEY READ-THROUGHS FROM VICOR Q2 2026 EARNINGS CALL The Vicor Q2 2026 call provides a high-signal view into the increasingly critical interface between AI accelerator silicon, advanced packaging, server assembly, semiconductor test, and data-center power infrastructure. The clearest conclusion is that AI and high-performance-computing demand remains firm into H2 2026. Vicor’s 1-year backlog increased 26% sequentially to $379.7 million, book-to-bill remained above 1x, product revenue increased 15.2% sequentially, and management stated that it saw “no weakness at all going forward” in high-performance compute. Reported Advanced Products growth of 45% sequentially was inflated by licensing revenue, but underlying Advanced Products hardware still appears to have increased approximately 28% sequentially after removing royalties from both periods. More importantly, Q3 total revenue is expected to increase nearly 10% even though revenue from the new license will decline by $10 million sequentially, implying that product revenue may need to increase by more than 20% sequentially under reasonable royalty assumptions. The call therefore represents a meaningful positive read-through for near-term AI infrastructure activity, while also identifying power delivery as a potential architectural and supply-chain bottleneck for 2027 and beyond. Rumored customer references to Avago, Google, AMD, and Cerebras were not confirmed by management and are not treated as evidence of specific commercial relationships. AI ACCELERATORS, CUSTOM SILICON, AND POWER MANAGEMENT AI ACCELERATOR AND CUSTOM-SILICON DEMAND REMAINS DURABLE (READ-THROUGH 1) Affected companies: NVIDIA Corporation (NVDA: US); Advanced Micro Devices, Inc. (AMD: US); Broadcom Inc. (AVGO: US); Marvell Technology, Inc. (MRVL: US); Taiwan Semiconductor Manufacturing Company Limited (TSM: Taiwan); Alphabet Inc. (GOOGL: US); Microsoft Corporation (MSFT: US); Amazon.com, Inc. (AMZN: US); Meta Platforms, Inc. (META: US). Directional impact and magnitude: Positive. The read-through is moderate as a confirmation of 2026-2027 AI hardware demand, but low-to-moderate as a stand-alone earnings revision input for the large-cap beneficiaries because Vicor remains small relative to the aggregate accelerator and hyperscaler supply chain. The signal is most relevant to accelerator, custom-silicon, and foundry companies whose revenue is closely linked to the number, complexity, and power density of AI systems deployed. The supporting data are unusually strong for an upstream power-component supplier. Vicor’s backlog increased 26% sequentially to $379.7 million, book-to-bill exceeded 1x, and management stated, “I don’t see any weakness at all going forward,” adding that “high-performance compute is strong.” The company expects nearly 10% sequential total revenue growth in Q3 even though the new licensing agreement will contribute only $5 million, down from $15 million in Q2. Assuming other royalty revenue remains relatively stable, the guidance requires product revenue to rise from $112.9 million in Q2 to approximately $135 million-$140 million in Q3, implying low-20% sequential growth. The transmission mechanism is direct. High-density power modules are required production inputs for AI accelerators, custom ASICs, wafer-scale processors, and the systems into which they are assembled. Rising backlog, stretched lead times, and double-digit sequential product guidance indicate that customers are reserving capacity ahead of production ramps rather than merely conducting early-stage evaluations. This is supportive of continued accelerator shipments, custom ASIC deployments, and advanced-node wafer demand. The architectural update is also positive for the long-term AI silicon roadmap. Vicor has completed a Gen 2 vertical power delivery baseline at 3 amps per square millimeter and is targeting more than 5 amps per square millimeter around late 2026 or early 2027. Management also cited current gain above 40. These capabilities would allow processor designers to increase package power, transistor utilization, chiplet count, and compute density without requiring proportionate increases in board area or upstream current. Power delivery is therefore becoming less likely to cap the performance of future accelerators if Vicor or competing architectures can scale. Broadcom and Marvell are relevant because hyperscaler custom-silicon programs require extensive co-design across the processor, package, board, power system, and cooling architecture. NVIDIA and AMD benefit because improved power delivery supports higher accelerator power envelopes and denser system configurations. TSMC benefits indirectly through higher advanced-node wafer and packaging demand. Alphabet, Microsoft, Amazon, and Meta benefit operationally because better point-of-load power delivery increases the amount of compute that can be placed into a constrained data-center footprint. The near-term trading catalyst is the evidence that AI infrastructure customers are continuing to place long-lead orders into H2 2026 rather than entering a material digestion phase. The longer-duration fundamental shift is that higher-performance power delivery can extend the AI accelerator roadmap beyond the limits of conventional board-level voltage regulation. The principal qualification is that customer identities and concentration were not disclosed, and the reported Advanced Products figure includes royalties. The read-through is therefore directionally positive but does not establish exact unit growth for any named accelerator vendor or hyperscaler. CONVENTIONAL MULTIPHASE AND GEN 1 POWER ARCHITECTURES FACE A 2027+ SHARE THREAT (READ-THROUGH 2) Affected companies: Monolithic Power Systems, Inc. (MPWR: US); Infineon Technologies AG (IFX: Germany); Renesas Electronics Corporation (6723: Japan). Texas Instruments Incorporated (TXN: US) and Analog Devices, Inc. (ADI: US) have lower, more diversified exposure. Directional impact and magnitude: Negative over the longer term. The potential impact is moderate for Monolithic Power Systems, which has substantial exposure to high-current power management in AI systems, and low-to-moderate for Infineon and Renesas. The near-term earnings impact is likely limited because Vicor’s broader Gen 2 production ramps are not expected until late Q3 or Q4 2027 and Vicor remains capacity constrained. Management argued that competing solutions deliver only “slightly over 1 ampere per square millimeter” under real operating conditions after thermal derating, while Vicor has reached 3 amps per square millimeter and is targeting more than 5 amps per square millimeter. Patrizio Vinciarelli stated that existing competitive capability is “quite limited” and that the market requirement, especially for wafer-scale engines and other advanced HPC systems, is already above those levels. Management also claimed that Factorized Power Architecture provides materially better current gain, efficiency, transient response, thermal performance, and signal integrity than conventional multiphase or integrated-voltage-regulator approaches. The transmission mechanism is a potential reallocation of the AI accelerator power-management bill of materials. Conventional systems typically rely on multiphase controllers, integrated power stages, inductors, and a sequence of voltage conversions from 12 volts, 6 volts, or 1.8 volts to the processor’s sub-1-volt operating rail. A successful vertical factorized architecture moves voltage transformation and current multiplication closer to the load and can reduce the number or economic value of conventional controller and power-stage components surrounding the processor. The greatest risk is not a collapse in total power-management demand. AI processor power continues to rise, which increases the aggregate power semiconductor opportunity. The risk is that the highest-value core-rail content migrates toward proprietary vertical power modules and away from conventional multiphase suppliers. This could reduce socket share, pricing power, or content per accelerator for exposed vendors even while the broader market continues growing. The call also identified an important offset. Vicor has been approached by 2 companies seeking a building block that would support integrated voltage regulators through a high-current 1.8-volt intermediate bus. Management explicitly described this as an incremental opportunity rather than a replacement for the full Factorized Power System. Hybrid architectures could therefore preserve some point-of-load IVR or multiphase content while Vicor captures the upstream conversion stage. The likely outcome is partial content displacement and greater architectural competition, not complete elimination of incumbent suppliers. The near-term catalyst would be a disclosed hyperscaler or OEM design win, qualification milestone, or sourcing agreement for Gen 2 VPD. Until such evidence appears, the call is not a strong near-term negative earnings signal for Monolithic Power Systems or other incumbent suppliers. The longer-duration implication is more material: a successful 2027-2028 Vicor ramp could challenge terminal market-share assumptions and require incumbents to increase R&D spending, reduce pricing, or accelerate their own vertical and integrated power architectures. The competitive performance statements are management assertions and have not been independently validated in the source material. Production yield, reliability, system cost, customer qualification, supply assurance, and ease of integration may prove as important as peak current-density specifications. CAPACITY LIMITS DELAY DISRUPTION AND CREATE SINGLE-SOURCE PROGRAM RISK (READ-THROUGH 3) Affected companies benefiting in the near term: Monolithic Power Systems, Inc. (MPWR: US); Infineon Technologies AG (IFX: Germany); Renesas Electronics Corporation (6723: Japan). Affected companies potentially exposed to program risk: NVIDIA Corporation (NVDA: US); Advanced Micro Devices, Inc. (AMD: US); Broadcom Inc. (AVGO: US); Dell Technologies Inc. (DELL: US); Hewlett Packard Enterprise Company (HPE: US); Super Micro Computer, Inc. (SMCI: US); Quanta Computer Inc. (2382: Taiwan); Wiwynn Corporation (6669: Taiwan). No relationship between Vicor and any of these companies was confirmed on the call. Directional impact and magnitude: Positive, low-to-moderate, for incumbent power-management vendors through 2027 because Vicor’s limited manufacturing capacity slows architecture displacement. Negative, potentially moderate-to-high at the individual program level, for any accelerator or server platform that becomes dependent on Vicor before a 2nd source or 2nd fab is operational. The consolidated impact on diversified large-cap customers would likely be smaller unless the affected platform were strategically important. Management stated that the 1st fab is “approaching capacity utilization” and that Vicor will become “very selective” in choosing customer engagements. The company has evaluated several sites for a 2nd fab and made offers, but no offer had been accepted as of the call. Management confirmed that the $2.5 billion revenue objective cannot be achieved with the existing factory and said the 2nd facility is expected to provide an initial doubling of capacity, with the site ultimately capable of supporting 2x-3x the capacity of the 1st fab. The timing is consequential. Management described broader Gen 2 customer programs moving toward production around late Q3 or Q4 2027, while meaningful 2nd-fab capacity appears associated with a late-2027-to-2028 time frame. The company also stated that external alternate sources are unlikely to provide the predictable capacity required for key customers over the next several years. This leaves the Andover facility as the critical manufacturing node during the initial commercial transition. The mechanism protecting incumbent power suppliers is customer reluctance to commit a major accelerator or server architecture to a single-source component with limited near-term capacity. Hyperscalers and OEMs typically require supply assurance, qualification redundancy, and visibility into multi-year volume support. Even where Vicor’s electrical performance is superior, customers may retain Gen 1 VPD, conventional multiphase, or hybrid IVR solutions until manufacturing redundancy is established. This extends the revenue runway for Monolithic Power Systems, Infineon, and Renesas and makes the competitive threat more likely to affect 2028 estimates than 2026 estimates. The corresponding customer risk is that a platform specifically designed around Vicor’s Gen 2 architecture could encounter allocation constraints, delayed qualification, or insufficient volume during a rapid ramp. Management’s willingness to prioritize only strategically attractive customers can improve Vicor’s economics but may force other customers to delay deployments or maintain parallel power architectures. A significant process interruption at the 1st fab would also have a larger impact because the company lacks a near-term external manufacturing alternative. The near-term catalysts are selection and acquisition of the 2nd site, disclosure of expected capex and commissioning dates, installation of the remaining equipment in the 1st fab, and evidence that product gross margin and throughput improve as utilization rises. The longer-duration shift occurs once Fab 2 is qualified. Successful execution would remove the supply-assurance obstacle and could accelerate share loss for incumbent power suppliers. A delayed or costlier Fab 2 would preserve incumbent architectures and limit the pace at which Vicor’s technology can affect the broader AI market. AI SERVER OEMS, ODMS, AND IMPORTED SYSTEMS ITC ENFORCEMENT CREATES A LOW-PROBABILITY, HIGH-SEVERITY IMPORT RISK (READ-THROUGH 4) Affected companies: Dell Technologies Inc. (DELL: US); Hewlett Packard Enterprise Company (HPE: US); Super Micro Computer, Inc. (SMCI: US); Quanta Computer Inc. (2382: Taiwan); Wiwynn Corporation (6669: Taiwan); Wistron Corporation (3231: Taiwan); Inventec Corporation (2356: Taiwan). No company on this list was identified by Vicor as infringing, unlicensed, or involved in the proceedings. The names represent major public exposures within the imported AI-server and contract-manufacturing supply chain. Directional impact and magnitude: Negative tail risk. The probability-weighted near-term financial impact is low because no specific company was identified and management’s base case assumes no further licensing agreement before the 2nd ITC case reaches final determination in 2027. The event severity could nevertheless be high for an individual server program if an exclusion order disrupted imports or forced an accelerated redesign. Management emphasized that patent enforcement is not limited to copied power modules. Patrizio Vinciarelli stated that the right to exclude can reach “the competitors’ customers, the contract manufacturers and those customers’ customers, OEMs, hyperscalers.” Management argued that users of Vicor’s technology must ensure that intellectual property is respected throughout the supply chain and stated that the appropriate remedy is to obtain a license. The transmission mechanism is more severe than an ordinary component-level patent dispute. An ITC exclusion order can potentially restrict importation of complete computing systems containing disputed modules, rather than only blocking the modules themselves. A server OEM or ODM could therefore face shipment delays, customs uncertainty, inventory impairment, redesign costs, supplier changes, or expedited qualification requirements even if the power module represents a small percentage of the system’s total bill of materials. The direct royalty cost is unlikely to be financially material for a large hyperscaler or server OEM. The more important economic risk is interruption of a high-value AI server shipment. A modest licensing payment may therefore be rational if it removes the risk of exclusion and permits continued use of an existing power-module supplier. The recently signed approximately $60 million agreement supports this interpretation because it does not require a sourcing relationship with Vicor during the initial years. The license appears capable of preserving the licensee’s current supply chain while resolving legal exposure. This structure creates a secondary read-through for incumbent power suppliers. A customer-level Vicor license could allow an OEM or hyperscaler to continue buying power products from a competitor, preserving the competitor’s unit demand while transferring part of the economic rent to Vicor through licensing. Consequently, additional Vicor licensing agreements would not necessarily imply an immediate product-share win for Vicor or a corresponding unit loss for Monolithic Power Systems, Infineon, Renesas, or other power vendors. The near-term trading catalysts are ITC procedural milestones, settlement announcements, new OEM or hyperscaler licenses, and disclosures regarding the renewal of current 2-year agreements. The longer-duration fundamental implication is that power-delivery IP becomes a system-level supply-chain issue rather than a narrow semiconductor dispute. Server OEMs and ODMs may respond by requiring stronger intellectual-property indemnification, dual-source qualification, or direct license coverage from hyperscaler customers.
TheValueist@TheValueist

$VICR (Bloomberg) -- (Updates shares.) Vicor shares fall as much as 12% after the power equipment company reported results. Though second-quarter sales and earnings per share beat analyst estimates, they failed to impress investors after the shares more than doubled this year through Monday.  SECOND QUARTER RESULTS •Net revenue $143.4 million, +1.6% y/y, estimate $138.3 million (Bloomberg Consensus) •EPS $1.04 vs. 91c y/y, estimate 63c •Income from operations $34.9 million, -23% y/y, estimate $33.2 million (2 estimates) NOTE •For Bloomberg Consensus estimates used in this story see: VICR Equity MODL •4 buys, 0 holds, 0 sells

English
1
0
9
3.9K
TheValueist
TheValueist@TheValueist·
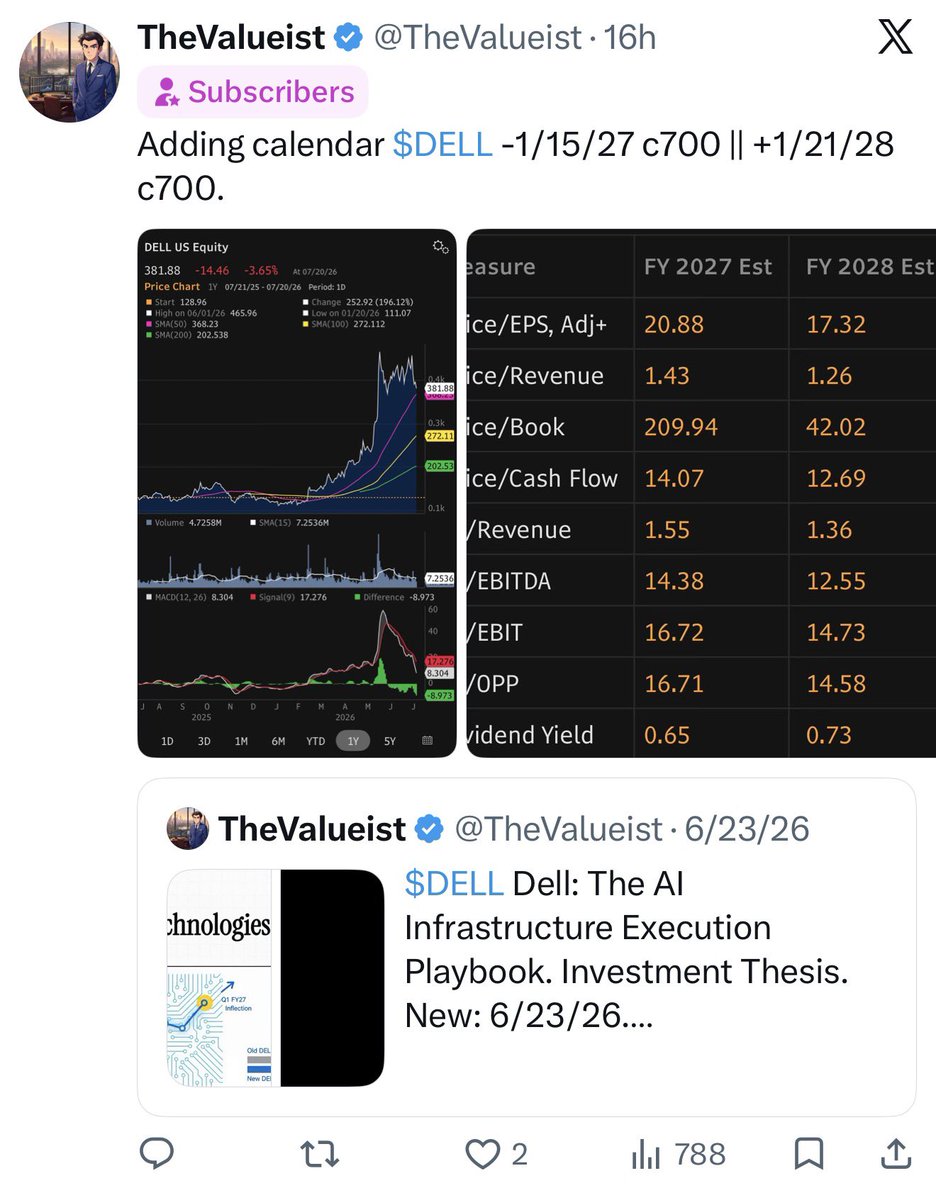
* $DELL $HPE HP ENTERPRISE SHARES FOLLOW $SMCI SUPER MICRO HIGHER, UP 3% I'm long calendar DELL -1/15/27 c700 || +1/21/28 c700. Club Valueist - get involved. It will be the best $1/month you will ever spend.
TheValueist tweet mediaTheValueist tweet media
TheValueist@TheValueist

$DELL Dell: The AI Infrastructure Execution Playbook. Investment Thesis. New: 6/23/26. Dell Technologies has experienced a genuine financial inflection driven by AI server demand, and the scale at which it operates creates a competitive position in AI infrastructure deployment that pure-play competitors cannot easily replicate. The ability to integrate complex, liquid-cooled GPU systems at global scale — managing supply chain logistics, component sourcing, and customer delivery simultaneously — is a capability built over decades that is not available to market entrants regardless of their product quality. That operational infrastructure is Dell's primary competitive moat in the current demand environment. The order backlog reflects real contracted demand rather than speculative pipeline, and the revenue trajectory has validated that the AI infrastructure opportunity is translating into financial results at the pace the investment thesis required. Michael Dell and Jeffrey Clarke bring the operational depth and supply chain leverage that a hardware-intensive scaling period demands — this is a management team that has navigated component scarcity and demand volatility before, and that experience matters during a period when GPU allocation and liquid cooling component availability are binding constraints on revenue recognition. The margin structure is the central tension in the investment case. AI server revenue carries lower gross margins than Dell's traditional enterprise hardware and storage businesses, which means record revenue growth is not producing proportional earnings expansion. The financial model improvement comes from the Services and Storage attach opportunity — the thesis that AI server customers convert into higher-margin storage, software, and services relationships over time. That attach conversion is happening, but the pace and durability of that progression is what determines whether Dell's AI exposure is a high-quality earnings compounder or a large-volume, thin-margin infrastructure deployment business. Capital returns discipline provides a financial quality signal that partially offsets the margin structure concern. A management team generating significant free cash flow from traditional businesses and returning it to shareholders while simultaneously investing in AI infrastructure capability is demonstrating financial balance that pure-play AI infrastructure vendors cannot match. The valuation reflects elevated market expectations that have moved ahead of the margin improvement demonstration. Converting low-margin server volume into the higher-value services and storage mix that justifies a premium multiple requires sustained execution over several years — the demand environment is supportive, the customer relationships are in place, and the operational capability is present, but the earnings quality improvement that makes the current price unambiguously defensible is still in progress rather than complete.

English
4
0
5
4.6K
TheValueist
TheValueist@TheValueist·
$NVDA $MU $SNDK $LITE As perverse at it may seem to some, as the models get smaller and more powerful, older generations of GPUs (ie H100) increase in value. Note how $DOCN took GPU rental price up across the board today.
TheValueist tweet media
TheValueist@TheValueist

huggingface.co/nvidia/Qwen3.6… $NVDA $MU $SNDK $LITE EXECUTIVE INVESTMENT VIEW Analysis shows that Qwen3.6-35B-A3B and NVIDIA’s nvidia/Qwen3.6-35B-A3B-NVFP4 checkpoint are best interpreted as a strategically reinforcing but not independently estimate-changing development in open-weight inference. The base Alibaba/Qwen model is a credible compact multimodal MoE release with 35B total parameters, 3B activated parameters, 262,144-token native context, long-context extensibility to approximately 1,010,000 tokens, text/image/video inputs, agentic coding positioning, and strong official benchmark results across coding-agent, tool-use, reasoning, long-context, and multimodal tasks. NVIDIA’s checkpoint is not a new NVIDIA foundation model; it is a ModelOpt NVFP4 quantization of Alibaba’s base model, released on Hugging Face on 05/28/2026, explicitly described as not owned or developed by NVIDIA, and positioned for vLLM-based deployment on NVIDIA GPU systems. The investment significance is therefore not model ownership. The significance is that NVIDIA is packaging a high-traction open-weight model into a low-precision artifact that demonstrates how Blackwell-era FP4/NVFP4 hardware, ModelOpt metadata, vLLM serving, FP8 KV cache, FlashInfer attention, Marlin MoE kernels, MTP speculative decoding, and Qwen-specific tool/reasoning parsers can be assembled into a more turnkey open-weight inference path. (Hugging Face) The correct investment conclusion is mixed and workload-dependent. Qwen3.6-35B-A3B appears meaningfully better than generic “small local model” alternatives for compact agentic coding, long-context reasoning, and multimodal enterprise experimentation, but it is not clearly a closed-frontier replacement and is not even uniformly superior to Qwen’s own dense Qwen3.6-27B sibling on every official benchmark. NVIDIA’s NVFP4 checkpoint is a meaningful deployment artifact for Blackwell-centric inference because it reduces weight memory, can improve bandwidth pressure, and gives developers an official pre-quantized path with small reported accuracy deltas versus BF16. It is not a durable standalone moat because the same base model has official FP8, Red Hat / LLM Compressor NVFP4, Unsloth GGUF and NVFP4, AWQ, MLX, and other derivatives already visible in the Hugging Face ecosystem. The durable NVIDIA advantage, if it persists, is not the file. It is the interaction among Blackwell Tensor Cores, CUDA/CUTLASS-level kernels, ModelOpt, vLLM/TensorRT-LLM/SGLang integration, NIM packaging, and enterprise support. (Hugging Face) Near-term public-equity impact is low. No credible evidence indicates that this single checkpoint changes CY2026 revenue estimates for NVIDIA, Alibaba, AMD, Broadcom, Marvell, hyperscalers, HBM suppliers, server OEMs, ODMs, networking vendors, or AI software infrastructure companies. Longer-duration relevance is higher because the event confirms 4 structural themes already embedded in AI infrastructure debates: open-weight models continue to improve quickly; inference economics are increasingly precision-, runtime-, and hardware-generation-sensitive; NVIDIA is using third-party open-weight models as a software/hardware pull-through mechanism; and non-NVIDIA alternatives remain viable because low-precision inference is becoming a broad ecosystem pattern, not an NVIDIA-only phenomenon. The most investable read-through is therefore not “Qwen NVFP4 changes the TAM,” but “Blackwell-native low-precision inference and optimized open-weight deployment are becoming a more important part of NVIDIA’s inference attach narrative, while Alibaba’s Qwen ecosystem remains a strategic asset and AMD/custom ASIC alternatives must compete on both hardware specifications and software maturity.” MODEL EXISTENCE, OWNERSHIP, AND WHAT THE NVIDIA CHECKPOINT ACTUALLY IS The official base model is Qwen/Qwen3.6-35B-A3B. The official NVIDIA checkpoint is nvidia/Qwen3.6-35B-A3B-NVFP4. The suffix A3B is material because it indicates approximately 3B activated parameters, not a conventional dense 35B model. The Qwen model card identifies the model as a causal language model with a vision encoder, trained through pre-training and post-training, with 35B total parameters, 3B activated parameters, hidden dimension 2048, token embedding 248,320 padded, 40 layers, a hybrid layout of 10 cycles of 3 Gated DeltaNet plus MoE blocks followed by 1 Gated Attention plus MoE block, 256 experts, 8 routed experts plus 1 shared expert, expert intermediate dimension 512, and MTP trained with multi-step prediction. Native context length is 262,144 tokens, with extensibility to approximately 1,010,000 tokens through long-context configuration. (Hugging Face) NVIDIA’s model card is explicit that nvidia/Qwen3.6-35B-A3B-NVFP4 is the quantized version of Alibaba’s Qwen3.6-35B-A3B model and that the model is quantized with NVIDIA Model Optimizer. NVIDIA also states that the model is ready for commercial and non-commercial use, but that the model is not owned or developed by NVIDIA and was built to a third party’s requirements. The license tag is Apache-2.0, deployment geography is global, and the stated use case is deployment in AI agent systems, chatbots, RAG systems, and other AI-powered applications. The model card lists a Hugging Face release date of 05/28/2026, architecture type “Transformers,” network architecture “Mixture-of-Experts with Hybrid Attention,” 35B total parameters, 3B activated parameters, text/image/video inputs, text output, context length up to 262K, vLLM as the supported runtime engine, Linux as the preferred OS, and NVIDIA Hopper plus NVIDIA Blackwell as listed microarchitecture compatibility. (Hugging Face) The distinction between base-model owner and checkpoint packager is central to the equity analysis. Alibaba/Qwen owns the model-quality event. NVIDIA owns the quantization and deployment-packaging event. NVIDIA’s contribution is not a new model architecture, training corpus, post-training recipe, or frontier capability claim. NVIDIA’s contribution is a pre-quantized artifact generated with nvidia-modelopt v0.44.0, tested on NVIDIA GB300, and paired with vLLM deployment commands. This makes the checkpoint important as a commercialization object in the NVIDIA ecosystem, but it limits the claim that NVIDIA has created a defensible model-layer asset. The same base model can be and already has been repackaged into FP8, GGUF, MLX, AWQ, LLM Compressor NVFP4, and other formats by official, partner, and community actors. (Hugging Face) BASE MODEL QUALITY AND CAPABILITY Qwen3.6-35B-A3B appears to be a genuinely strong compact open-weight MoE model rather than a purely cosmetic iteration. Qwen’s own model card says the release delivers substantial upgrades in agentic coding, including frontend workflows and repository-level reasoning, and introduces “Thinking Preservation,” an option to retain reasoning context from historical messages for iterative development. Official language benchmark results show Qwen3.6-35B-A3B at 73.4 on SWE-bench Verified, 67.2 on SWE-bench Multilingual, 49.5 on SWE-bench Pro, 51.5 on Terminal-Bench 2.0, 68.7 on Claw-Eval Avg, 52.6 on QwenClawBench, 29.4 on NL2Repo, 1397 on QwenWebBench, 67.2 on TAU3-Bench, 37.0 on MCPMark, 62.8 on MCP-Atlas, 85.2 on MMLU-Pro, 86.0 on GPQA, 80.4 on LiveCodeBench v6, and 92.7 on AIME26. These numbers support the view that the model is relevant for agentic coding, tool use, reasoning, and long-context workflows, but the methodology notes matter: SWE-bench uses an internal agent scaffold, QwenWebBench is an internal benchmark, Terminal-Bench uses a specific harness and 5-run average, and several agent/tool benchmarks rely on model judges or benchmark-specific scaffolding. (Hugging Face) The benchmark pattern should be treated as positive but not dispositive. Repository-level coding benchmarks are highly scaffold-dependent. Tool-use benchmarks are sensitive to parser conventions, retry logic, allowed tools, timeout settings, context allocation, and prompt templates. Frontend-generation benchmarks depend on visual judges and subjective render quality. Long-horizon agent benchmarks can be materially affected by whether the model is allowed to preserve intermediate reasoning, invoke external tools, edit files repeatedly, and recover from failed tests. The official results are sufficient to classify Qwen3.6-35B-A3B as a top-tier compact open-weight agentic model, but insufficient to classify it as a production replacement for GPT-5.5-class, Claude-class, Gemini-class, or internal enterprise-tuned coding agents without workload-specific evaluation. OpenAI describes GPT-5.5 as its smartest model as of April 2026 and positions GPT-5 around high-quality code, frontend UI generation, steerability, and long chains of tool calls, which remains the closed-frontier quality reference point for many commercial agentic workflows. (OpenAI) The 35B total / 3B active design is economically important because active compute can be far below dense 35B compute, while total model capacity can remain materially larger than a 3B dense model. This structure is attractive for inference economics because only a subset of experts fires per token. However, the cost benefit is not equivalent to running a simple 3B model. All expert weights still need to be stored or streamed. Expert routing introduces scheduling, load-balance, and kernel-efficiency overhead. MoE layers can become memory-traffic-bound rather than compute-bound if kernels are not optimized. Batch composition can affect expert utilization. The model’s hybrid Gated DeltaNet plus Gated Attention structure may reduce full-attention pressure versus a pure dense-attention architecture, but the long-context serving problem remains non-trivial because KV cache, prefill cost, multimodal tokens, and sequence scheduling dominate at high context lengths. The long-context claim is real but economically constrained. Qwen states that the model has default context length of 262,144 tokens and advises maintaining at least 128K tokens for complex tasks if OOM forces context reduction, because Qwen3.6 leverages extended context for complex tasks and thinking capability. The same model card describes ultra-long processing beyond 262,144 tokens through RoPE/YaRN-style scaling, including a vLLM example that sets max model length to 1,010,000 tokens. Qwen also cautions that static YaRN keeps the scaling factor constant regardless of input length and can hurt shorter-text performance, so the long-context configuration should be used only when needed. This is exactly the kind of caveat that matters in production: a model can support 1M context in principle while still being unattractive at 1M context under realistic latency, cost, and concurrency constraints. (Hugging Face) The multimodal claim is also real but should not be overextended. Qwen and NVIDIA list text, image, and video inputs with text output. Qwen’s official vision-language table shows strong reported performance on MMMU, MMMU-Pro, MathVista, RealWorldQA, MMBench, SimpleVQA, HallusionBench, OmniDocBench, AI2D, RefCOCO, VideoMME, VideoMMMU, MLVU, MVBench, and LVBench. The model is therefore not a text-only MoE with superficial image support. Nevertheless, multimodal enterprise deployment has a higher integration burden than text-only serving. Image preprocessing, video frame sampling, token-budget allocation, document OCR behavior, latency volatility, and vision-encoder quantization behavior can all dominate realized production quality. NVIDIA’s NVFP4 eval includes MMMU Pro, but that does not establish robust video, document, medical-imaging, industrial-vision, or long-video production quality preservation after quantization. (Hugging Face) NVIDIA NVFP4 CHECKPOINT: QUALITY PRESERVATION AND WHAT WAS QUANTIZED NVIDIA states that the model was obtained by quantizing the weights of Qwen3.6-35B-A3B to NVFP4 and that only the weights and activations of the linear operators within transformer blocks in MoE are quantized. The checkpoint therefore should not be interpreted as a naive all-tensor 4-bit conversion. The Hugging Face page lists tensor types including BF16, F8_E4M3, and U8, which is consistent with a mixed-format artifact where some components remain higher precision or are represented through auxiliary quantization metadata. The stated memory benefit is that the optimization reduces bits per parameter from 16 to 4 and reduces disk size and GPU memory requirements by approximately 3.06x. The checkpoint’s displayed model size is 19B parameters, with approximately 5,769,728 downloads last month at the time of retrieval, but Hugging Face downloads should be treated as a noisy attention signal rather than evidence of production adoption. The same page states that the model is not deployed by any Hugging Face Inference Provider. (Hugging Face) The official BF16 versus NVFP4 benchmark deltas are small. NVIDIA reports MMLU Pro of 85.6 for BF16 versus 85.0 for NVFP4, GPQA Diamond of 84.9 versus 84.8, tau2-Bench Telecom of 95.5 versus 94.7, SciCode of 40.8 versus 40.6, AIME 2025 of 89.2 versus 88.8, AA-LCR of 62.0 versus 62.0, IFBench of 62.3 versus 62.8, and MMMU Pro of 74.1 versus 74.5. The worst listed degradation is 0.8 points, 2 evals improve slightly, and the average absolute delta is approximately 0.375 points across the listed suite. This is a strong official result for benchmark-level preservation. It is not proof of production-level preservation across customer-specific coding agents, regulatory workflows, retrieval-heavy enterprise knowledge bases, internal code repositories, multimodal video workflows, or adversarial tool-use conditions. The eval table is necessary evidence, not sufficient evidence. (Hugging Face) The checkpoint’s calibration data should be treated as adequate for a general ModelOpt release but not necessarily representative of enterprise workloads. NVIDIA lists cnn_dailymail and NVIDIA’s Nemotron-Post-Training-Dataset-v2 as calibration data. NVIDIA lists training data modality, collection method, labeling method, size, and properties as undisclosed for the underlying training dataset, which is expected because Alibaba owns the base model but still relevant for model-risk governance. The evaluation suite is broader than a simple MMLU-only check because it includes reasoning, coding, telecom tool-use, multimodal understanding, scientific coding, math, long-context recall, and instruction following, but it remains benchmark-centric. Enterprise adoption will require internal red-teaming, task-specific calibration, safety review, prompt-stability testing, tool-schema validation, and regression testing under the exact runtime stack. (Hugging Face)

English
2
1
14
4.1K
TheValueist
TheValueist@TheValueist·
$VLO $MPC $PSX $DINO PADD 3 Refining Outlook: Capacity, Exports, Margins, and Public-Equity Exposure. New: 7/20/26. PADD 3 represents the highest-quality integrated refining, crude-logistics, product-distribution, petrochemical, and export system in the U.S. Its scale, deep conversion capacity, access to low-cost natural gas and hydrogen, proximity to Permian and Eagle Ford production, access to Canadian, Gulf of Mexico, Latin American, and waterborne crudes, extensive pipeline connectivity, and ability to export into the Atlantic Basin create a durable structural advantage. The advantage is most valuable at large coastal complexes that combine coking, hydrocracking, FCC capacity, product blending, petrochemical integration, storage, multiple crude-delivery systems, and direct marine access.
TheValueist@TheValueist

x.com/i/article/2079…

English
2
1
5
4.6K
TheValueist
TheValueist@TheValueist·
$VLO $MPC $PSX $DINO (Bloomberg) -- US oil refiners have been running so hard for so long to capture record profits that they’re increasingly vulnerable to equipment breakdowns at a time when global fuel markets already are unusually tight. Nationwide, refiners have been running at or above the 95% utilization rate that’s widely regarded as full capacity for almost two months, government figures showed. In at least one region, the Rocky Mountains, fuelmakers have surpassed the 100% marktwice in the past few weeks, a pace that even the refining industry’s main lobbying group warns is untenable.  Churning along at maximum rates increases wear and tear on the units that pressurize, heat, crack and reformulate crude oil components to make gasoline, diesel, jet fuel and other feedstocks crucial to the smooth operation of the world’s largest economy. Throw in a Gulf Coast hurricane or Great Lakes blackout and fuel production in those places can screech to a halt. The potential knock-on effects would hit consumers already hammered by the war-driven spike in pump prices, compounding pocketbook issues as the US midterm elections draw nigh. Running near max capacity is “raising the likelihood that equipment failures tighten fuel supply and amplify price volatility,” Rapidan Energy analysts said.   “In the real world, running refineries at 100% isn’t sustainable or safe for any long stretch of time,” according to an American Fuel & Petrochemical Manufacturers fact sheet. “Refineries do not run at 100% for long stretches of time, and they’re not meant to.”   Case in point: When Hurricane Beryl lashed the Texas coast in July 2024, Gulf Coast refiners were forced to cut the amounts of crude and other feedstocks they processed by more than half-a-million barrels a day, Energy Information Administration data showed.  Fuelmaking in the region declined for four straight weeks as damages from the storm were sorted out. Two months after Beryl, Hurricane Francine struck the Louisiana coast and processing tanked for another four consecutive weeks. The Atlantic hurricane season has been quiet thus far but National Hurricane Center forecasters on Friday said they were monitoring a cluster of storms in the eastern Gulf of Mexico that had a 30% chance of intensifying over the next seven days. Now, refiners are deferring routine maintenance work to capture sky-high fuelmaking margins. Instead, some are resorting to temporary repairs even as extreme heat in some areas increases the stress of refining gear, according to the Rapidan analysts. Several major refiners already have postponed maintenance to keep capacity online to chase strong margins. Motiva Enterprises LLC delayed a turnaround at the biggest crude unit at its Port Arthur refinery in Texas by a year to the fall of 2027, people familiar with the operations have said.  Any major outage could have an outsized impact because domestic fuel stockpiles are unusually low. Inventories have been strained by robust demand for US diesel to replace production lost to the conflicts in Russia and the Persian Gulf, and a drop in gasoline imports to a 29-year seasonal low.  Equity investors, meanwhile, are cheering refiners on. Valero Energy Corp., Phillips 66 and Marathon Petroleum Corp. touched record share prices on Friday.  Fuelmakers probably will continue to produce as much as they can to take advantage of fat profit margins, said Raul Calzada, a Houston-based refining analyst at Energy Aspects.  “Margins should continue to incentivize refiners to run really hard probably into next year,” Calzada said. “There’s not a lot of maintenance in the books for second half of the year.”
TheValueist tweet mediaTheValueist tweet mediaTheValueist tweet mediaTheValueist tweet media
TheValueist@TheValueist

A DM from a subscriber and it seemed like I should reply on my timeline. I’m on vacation and will share more when I’m back at my desk. Given what is happening in Iran and Ukraine, with no culmination in sight, I believe the owners of PADD 3 assets (highest concentration of total capacity) will do very well in the coming months. Crack spreads are accelerating higher. $VLO $MPC are fantastic and I like $PSX as well. eia.gov/dnav/pet/pet_p…

English
4
0
10
5K
TheValueist
TheValueist@TheValueist·
A DM from a subscriber and it seemed like I should reply on my timeline. I’m on vacation and will share more when I’m back at my desk. Given what is happening in Iran and Ukraine, with no culmination in sight, I believe the owners of PADD 3 assets (highest concentration of total capacity) will do very well in the coming months. Crack spreads are accelerating higher. $VLO $MPC are fantastic and I like $PSX as well. eia.gov/dnav/pet/pet_p…
TheValueist tweet mediaTheValueist tweet media
TheValueist@TheValueist

U.S. Refining: Structural Scarcity, Cyclical Upside, and Terminal-Value Risk. New: 7/13/26. U.S. petroleum refining is best characterized as a structurally tighter, higher-mid-cycle, lower-terminal-multiple cash-flow industry. The sector is no longer adequately modeled as the uniformly oversupplied, low-return conversion business that prevailed through much of the 2010s, but neither should recent margins be capitalized as a durable perpetuity. Capacity rationalization, limited greenfield investment, rising replacement costs, increasingly difficult permitting, high utilization, product-market fragmentation, and critical logistics constraints have raised the probability that industry troughs will be shorter and less severe than historical experience suggests. At the same time, declining gasoline demand, global capacity additions, environmental compliance costs, aging equipment, closure liabilities, and policy uncertainty reduce the duration of those cash flows and justify lower terminal multiples. High current free cash flow and declining terminal value are therefore compatible rather than contradictory conclusions.

English
1
0
11
9.5K
TheValueist
TheValueist@TheValueist·
It's seems like you worked at $GS from your profile, so I suspect you know Lloyd’s gospel much better than me. I can go from what from what he said in this video about managing risk at the firm and I like and agree with it!
LBM_LXXVIII@MF_Camillus

@TheValueist Not sure what makes you think that, but fun fact: you are quoting a guy who says that 98% of his wealth is always on risky assets and that he doesn’t even use a computer to manage his positions…

English
0
0
9
7.2K