Digital Leonard

3.5K posts

Digital Leonard banner
Digital Leonard

Digital Leonard

@DigitalLeonard

Day Trader | YouTuber | AI Automations Tips Daily trade breakdowns + simple lessons to help you win more. Follow & learn. https://t.co/bJ1c73GB1v

Abuja, Nigeria Entrou em Mart 2013
1.2K Seguindo2.7K Seguidores
Digital Leonard
Digital Leonard@DigitalLeonard·
Central bank announcements can double your account or wipe it out in 60 seconds. Here is how to survive them. 1. UNDERSTAND WHAT MOVES THE MARKET It is not just what the bank decides. It is whether the decision matches what traders expected. If everyone expected a rate hike and it happens, the price might barely move. The surprise is what creates the spike. 2. WAIT FOR THE FIRST CANDLE TO CLOSE The moment the announcement drops, price goes crazy in both directions. This is called a whipsaw. Jumping in during that chaos is like trying to catch a falling knife with your eyes closed. Let the first 1-minute or 5-minute candle close before you touch anything. 3. TRADE THE REACTION, NOT THE NEWS After the initial spike, price usually picks a direction and holds it. That second move is cleaner and safer. Enter there with a tight stop loss above or below the spike high or low. 4. SIZE DOWN YOUR POSITION News events bring higher spreads and slippage. Your broker widens the gap between buy and sell prices during volatility. Trade smaller than normal so one bad entry does not end your week. 5. MARK YOUR CALENDAR Use ForexFactory.com to track upcoming high-impact events. Red folder icons mean serious volatility is coming. Key takeaway: The traders who get burned on central bank news are the ones who rush in. Patience before, discipline during, and smaller size always.
Digital Leonard tweet media
English
0
1
0
33
Digital Leonard
Digital Leonard@DigitalLeonard·
Market structure is the first thing serious traders learn. Here is why it matters. Every chart tells a story. The market moves in waves, not straight lines. Understanding those waves is how you stop guessing and start reading price. Two patterns define everything: 1. HIGHER HIGHS and HIGHER LOWS = uptrend. Price is making bigger peaks each time it rises, and when it pulls back, it stops at a higher point than before. The market is climbing a staircase. 2. LOWER HIGHS and LOWER LOWS = downtrend. Each bounce is weaker than the last, and each drop goes deeper. The staircase is going down. Why does this matter? Because most people buy when price goes up and panic when it drops. But if you can read the structure, you know whether a dip is a healthy pullback or the start of a real breakdown. A healthy uptrend dips but holds above the last low. That is your clue to stay calm. When it breaks below that low, structure has shifted. That is your clue to pay attention. Think of it like a conversation. The market is always talking. Higher highs and higher lows mean buyers are in control. Lower highs and lower lows mean sellers are winning. Your job is to listen before you act. Key takeaway: Before you enter any trade, ask yourself, is this market making higher or lower points over time? That one question will save you from a lot of bad entries.
Digital Leonard tweet media
English
0
0
0
41
Digital Leonard
Digital Leonard@DigitalLeonard·
The carry trade is one of the most powerful strategies in forex, and institutions have been running it quietly for decades. Here is how it works. 1. Every currency has an interest rate attached to it. When you hold a currency, you either earn or pay that interest. 2. The carry trade is simple: borrow in a low-interest currency, convert it, and park it in a high-interest currency. You pocket the difference. 3. Example: If Japan's rate is 0.1% and Australia's is 4.5%, you borrow yen, buy Australian dollars, and earn roughly 4.4% just for holding the position. That spread is called the "carry." 4. Institutions do this at massive scale. Hedge funds and banks move billions this way, which is why certain currency pairs trend for months without obvious reason. 5. The risk? If the high-yield currency drops in value, it wipes out your interest gains fast. Carry trades unwind violently when fear hits the market. This is why you sometimes see the Japanese yen spike suddenly during global panic. Traders are rushing to close carry positions and pay back their yen loans. Key takeaway: When you see a currency pair trending steadily with no clear news, check the interest rate gap. Institutions might be carrying it all the way to the bank.
Digital Leonard tweet media
English
0
0
1
81
Digital Leonard
Digital Leonard@DigitalLeonard·
The Claude API can write AND schedule your content while you sleep. Here is how the system works: 1. You send Claude a prompt via the API. Something like: "Write 5 Twitter posts about crypto trading for this week." 2. Claude returns the content as text. Your code catches that response and stores it. 3. You connect a scheduling tool like Buffer, Typefully, or even a simple Google Sheet linked to a posting script. 4. A time trigger (set in your code or a tool like Make or n8n) fires at your chosen times and pushes each post live. The whole pipeline runs without you touching it. You set it up once, and it keeps running. Like hiring a writer who never sleeps and never asks for a raise. Where most people get stuck is the connection layer. The API gives you the content. The scheduler sends it out. You need a middle layer, usually a simple script or a no-code tool, to pass data between them. Start small. Build a script that generates 3 posts and saves them to a spreadsheet. That alone is a working system you can expand. Key takeaway: Claude does not schedule content on its own. But paired with the right tools, it becomes the engine behind a fully automated content machine.
Digital Leonard tweet media
English
1
0
0
105
Digital Leonard
Digital Leonard@DigitalLeonard·
Economic data is the heartbeat of the forex market. When key reports drop, currency pairs don't just move. They sprint. Here's what you need to know: 1. NFP (Non-Farm Payrolls) is a monthly US jobs report. Strong job numbers mean the economy is healthy. That usually pushes the US Dollar up because traders expect the Fed to keep rates high or raise them. 2. CPI (Consumer Price Index) measures inflation. High inflation often means a central bank will raise interest rates to cool things down. Higher rates attract foreign money, which strengthens the currency. 3. The market moves on SURPRISE. If analysts expect 200k jobs and 300k come in, the Dollar can spike 50-100 pips in seconds. If the number matches expectations, the move is smaller. 4. This is why traders say "buy the rumor, sell the news." Prices often move before the report based on predictions, then reverse when the real number drops. Think of it like a school report card. The market already guessed your grades. If you do better than expected, everyone cheers. If you do worse, they panic. Key takeaway: Before trading NFP or CPI week, check the forecast. The gap between forecast and actual result is where the real money moves.
Digital Leonard tweet media
English
0
0
1
124
Digital Leonard
Digital Leonard@DigitalLeonard·
Candlestick patterns are the language of the market. Most traders stare at them and see nothing. Here is how to actually read them. Every candle tells you 4 things: the open price, the close price, the highest point reached, and the lowest point reached. The body of the candle shows the distance between open and close. A green body means price closed higher than it opened. A red body means it closed lower. The thin lines above and below the body are called wicks. Long wicks mean price tried to move in that direction but got rejected. Buyers or sellers showed up and pushed it back. A few patterns worth knowing: 1. Doji: tiny body, long wicks on both sides. The market is undecided. Neither side is winning. Expect a move soon. 2. Hammer: small body at the top, long wick below. Sellers tried to push price down, buyers fought back hard. Often signals a reversal up. 3. Engulfing candle: one candle completely swallows the previous one. Big shift in momentum. Direction depends on which way it engulfs. Here is the part most people skip. One candle means little. Context is everything. A hammer at a key support level is powerful. A hammer in the middle of nowhere is just a candle doing candle things. Always ask: where is this pattern forming? That question separates traders from gamblers.
Digital Leonard tweet media
English
0
0
0
52
Digital Leonard
Digital Leonard@DigitalLeonard·
Major vs Minor currency pairs. Here is what actually matters for your trading. Major pairs always include the US Dollar. Think EUR/USD, GBP/USD, USD/JPY. These are the most traded pairs in the world. Minor pairs, also called cross pairs, do NOT include the Dollar. Examples: EUR/GBP, GBP/JPY, AUD/CAD. So which should you focus on? 1. LIQUIDITY Majors have the highest liquidity, meaning more buyers and sellers at any time. This keeps the spread (the cost of your trade) very low. Less cost = more profit potential. 2. PREDICTABILITY Majors react to news in more consistent ways. They are heavily analyzed, so there is more data, more research, and more tools available to help you read them. 3. VOLATILITY Minors can move more aggressively, especially pairs like GBP/JPY. Higher reward, but also higher risk. Not the best starting point if you are still learning. 4. MY HONEST TAKE Start with EUR/USD or GBP/USD. They are like the main road, well-lit, well-marked, and everyone knows the rules. The minor pairs are the shortcuts, useful once you know the city. Master one major pair first. Understand how it breathes. Then expand. The market rewards focus, not variety.
Digital Leonard tweet media
English
0
0
3
107
Digital Leonard
Digital Leonard@DigitalLeonard·
Market structure is the foundation of every good forex trade entry. Most beginners jump straight to indicators. But if you can't read what price is actually doing, no indicator will save you. Here's what market structure means in simple terms: 1. Price moves in patterns. It either makes higher highs and higher lows (uptrend), lower highs and lower lows (downtrend), or it bounces between two levels (range). 2. A "Break of Structure" is your signal. When price breaks a recent high or low, the market is telling you something shifted. That's a potential entry zone, not a random candle. 3. After a break, price often comes back to retest that level. That retest is where smart traders enter. Not at the breakout, at the confirmation. 4. Identify your swing highs and swing lows first. These are the peaks and valleys on your chart. They tell you who is in control, buyers or sellers. Think of it like reading traffic. You don't just drive, you watch the flow before you merge. The setup: Mark your structure. Wait for a break. Wait for the retest. Then enter with a clear stop below the last low or above the last high. Key takeaway: Price tells a story before every move. Your job is to read it, not guess it.
Digital Leonard tweet media
English
1
1
0
70
Digital Leonard
Digital Leonard@DigitalLeonard·
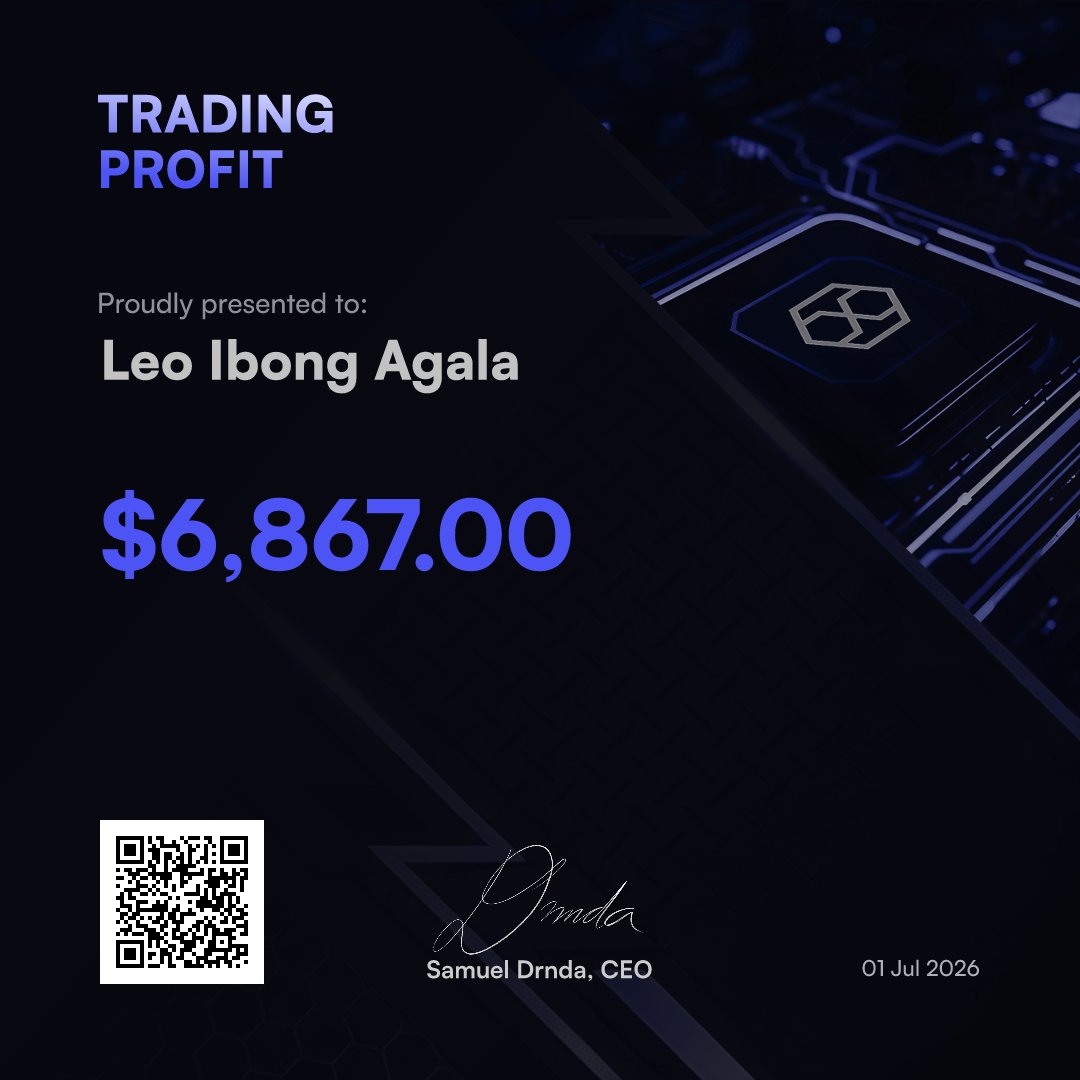
June was different. Instead of staring at charts for hours, I connected Claude Code to TradingView to help analyze market structure, identify high-probability setups, and keep me disciplined throughout the month. The result? Managed my $200,000 @hyrotrader_com funded account Stayed consistent with my trading plan Just received a $6,867 payout AI didn't place trades for me, it helped me make better decisions by removing emotion, speeding up analysis, and keeping me focused on execution. This is exactly how I believe professional traders should be using AI: as a trading assistant, not a gambling machine. If you're still manually doing everything, you're leaving a massive edge on the table. Want to get funded and build your own AI-assisted trading workflow? Hit the link in my bio to get your funded account and start trading with an edge.
Digital Leonard tweet media
English
0
0
2
73
Digital Leonard
Digital Leonard@DigitalLeonard·
Forex beginners lose money not because the market is hard, but because they never understood pips, lots, and position sizing. Let me fix that. 1. A pip is the smallest price movement in a currency pair. For most pairs like EUR/USD, one pip is 0.0001. If EUR/USD moves from 1.1000 to 1.1010, that is 10 pips. 2. A lot is your trade size. A standard lot is 100,000 units of currency. A mini lot is 10,000 units. A micro lot is 1,000 units. Beginners should start with micro lots. 3. Position sizing is how you decide how many lots to trade based on your account size and risk. This is where most people skip and get burned. Here is a simple rule: never risk more than 1-2% of your account on a single trade. So if your account is $500, your max loss per trade should be $5 to $10. You then calculate your lot size to match that risk, not the other way around. Think of it like cooking. You do not add salt and then decide how big the pot is. You size the salt to the pot. The traders who survive long enough to profit are the ones who mastered sizing before chasing setups. Control your risk first. The profits follow.
Digital Leonard tweet media
English
0
0
0
99
Digital Leonard
Digital Leonard@DigitalLeonard·
Altcoin season is one of the most powerful wealth-building windows in crypto. Here is how it works and how to not miss it. Bitcoin usually moves first. Big money flows into BTC, price rises, dominance climbs. Then something shifts. Investors start taking BTC profits and rotating into altcoins searching for bigger percentage gains. That rotation is what triggers altcoin season. How to spot it early: 1. Bitcoin dominance starts dropping. This is the percentage of total crypto market cap that BTC holds. When it falls, money is moving into alts. 2. Ethereum moves next, usually before smaller coins. ETH pumping is often the first signal. 3. Then mid-caps move. Then small-caps. The wave travels down the market cap ladder. How to position before it hits: Build your watchlist during the boring, quiet period. Research projects with real use cases and active communities. Do not chase coins after they already pumped 300%. Allocate in layers. Put more into higher market cap alts like ETH or SOL first. They are less risky. Keep a smaller portion for high-risk small caps. Set price alerts, not alarms for regret. Know your exit targets before you enter. Altcoin season is not luck. It is pattern recognition plus preparation. The people who win big were already positioned. The people who lose big were chasing.
Digital Leonard tweet media
English
0
0
0
93
Digital Leonard
Digital Leonard@DigitalLeonard·
EURUSD is the most traded currency pair on earth. Here is what actually moves it. 1. Interest rate decisions The US Federal Reserve and the European Central Bank set interest rates. When the Fed raises rates, the dollar gets stronger. When the ECB raises rates, the euro gains. Traders watch these central banks like hawks. 2. Inflation data High inflation in the US pushes the Fed to act. High inflation in Europe pushes the ECB to act. Whichever economy is fighting inflation harder usually sees its currency move first. 3. Economic growth numbers GDP reports, jobs data, retail sales. Strong US numbers tend to push EURUSD down. Strong European numbers push it up. The pair is basically a tug of war between two economies. 4. Geopolitical events War, elections, trade disputes. Europe is more exposed to regional conflict risk, which can weaken the euro quickly when things get tense. 5. Risk sentiment When global markets panic, traders rush into the dollar. It is seen as a safe haven. So even when news has nothing to do with the US, the dollar can still strengthen. The pair is not random. It responds to real economic forces. Key takeaway: before you trade EURUSD, know which central bank is speaking that week. That single habit will save you from a lot of bad entries.
Digital Leonard tweet media
English
0
0
1
86
Digital Leonard
Digital Leonard@DigitalLeonard·
Central bank interest rates are the single biggest driver of currency prices in forex. Here is how it works: 1. A central bank raises interest rates, money in that country earns more. Foreign investors move their capital there to get better returns. Demand for that currency goes up, price goes up. 2. A central bank cuts interest rates, returns drop. Investors pull money out and move it somewhere better. Demand falls, currency weakens. 3. It is not just the decision that moves the market. The expectation moves it first. Traders price in rate changes weeks before they happen. By the time the announcement drops, the move is often already done. 4. This is why you watch central bank speeches, meeting minutes, and inflation data closely. They are clues about what rates will do next. Think of it like a savings account. If your bank suddenly offers 5% interest and the next bank offers 1%, you are moving your money. Currency traders do the exact same thing, just at a much larger scale. Key takeaway: When you see a rate decision coming, ask yourself what the market already expects. The surprise is what creates the big move, not the number itself.
Digital Leonard tweet media
English
0
0
0
61
Digital Leonard
Digital Leonard@DigitalLeonard·
Prompt engineering is the difference between AI giving you gold and AI giving you garbage. Most people type a vague question and wonder why the output is useless. The AI is not broken. Your instruction is. Here is how to fix it: 1. Give context first. Tell the AI who you are, what you are doing, and why. "I am a small business owner writing a product description for a Nigerian audience" beats "write a product description" every time. 2. Assign a role. Start with "Act as a senior copywriter" or "You are a financial analyst." AI performs better when it knows what hat to wear. 3. Specify the format. Want bullet points? A table? A 3-paragraph summary? Say so. AI will not guess unless you ask. 4. Add constraints. Word count, tone, what to avoid. The tighter the brief, the sharper the output. Think of it like hiring a freelancer. Vague brief, vague result. 5. Iterate. Your first prompt is a draft, not a final order. Read the output, then refine. "Make it shorter" or "Add a call to action" works perfectly. Key takeaway: AI is a powerful tool, but YOU are the operator. Better prompts mean better outputs, faster workflows, and less time fixing AI mistakes. Learn to prompt well and you will work 10x faster than people who don't.
Digital Leonard tweet media
English
0
0
1
126
Digital Leonard
Digital Leonard@DigitalLeonard·
Support and resistance levels are the foundation of reading any crypto chart. Here is what they actually mean: 1. SUPPORT is a price zone where buying pressure tends to stop a coin from falling further. Think of it like a floor. The price drops, hits that level, and bounces back up. 2. RESISTANCE is the opposite. It is a price zone where selling pressure tends to stop a coin from rising further. The ceiling. Price pushes up, hits that level, and gets rejected back down. 3. These levels form because of memory. Traders remember where price reversed before, and they react the same way again. Markets run on collective psychology. 4. When price breaks through resistance, that old ceiling often becomes the new floor. This flip is called a role reversal, and it is one of the most useful signals you can watch for. 5. You find these levels by looking at your chart and spotting where price has bounced or reversed multiple times. More touches at a level means it is stronger. Think of it like a stubborn door in your house. The more times it gets stuck at the same spot, the more you know that is where the real problem is. Key takeaway: Before you enter any trade, identify the nearest support below and resistance above. Those two levels define your risk and your target.
Digital Leonard tweet media
English
0
3
3
105
Digital Leonard
Digital Leonard@DigitalLeonard·
You can automate your entire content pipeline with n8n. Here is how it works. n8n is a free, open-source automation tool that connects apps and runs workflows without you lifting a finger. Here is a simple content pipeline you can build today: 1. Trigger: A new idea lands in your Notion database 2. n8n picks it up automatically and sends it to an AI node (like OpenAI) to generate a draft 3. The draft gets saved back to Notion, or sent to your Google Docs for review 4. Once you approve it, n8n posts it to Twitter, LinkedIn, or wherever you publish 5. It logs the post in a spreadsheet so you can track performance later The whole thing runs while you sleep. You become the editor, not the factory worker. Think of n8n as the invisible assistant who never asks for a raise and never calls in sick. You do not need to code. Most of it is drag and drop. The learning curve is maybe a weekend. Key takeaway: Your content pipeline should produce output even when you are offline. n8n makes that possible for free. Start with one workflow, one trigger, one action. Build from there.
Digital Leonard tweet media
English
4
0
4
145
Digital Leonard
Digital Leonard@DigitalLeonard·
The carry trade is one of the most powerful strategies institutions use in forex. Most retail traders have never heard of it. Here is how it works: 1. Borrow money in a currency with LOW interest rates (like the Japanese Yen at near 0%). 2. Convert that money into a currency with HIGH interest rates (like the US Dollar or Australian Dollar). 3. Invest it and collect the difference in interest rates. That difference is called the "carry." Example: If Japan charges you 0.1% to borrow and the US pays you 5.25%, you pocket roughly 5% just for holding the position. Banks and hedge funds do this with billions. Now here is the part most people miss. When institutions pile into carry trades, they are buying the high-yield currency in massive size. This moves the market. So when you see the Yen weakening or the Dollar strengthening without obvious news, carry flows are often the reason. The risk? If markets panic, everyone unwinds the trade at once. They sell the high-yield currency and rush back into the Yen. That is why Yen spikes during crashes, it is carry trade unwinding, not magic. Key takeaway: When you understand carry, you start reading institutional behavior instead of just reacting to price. That is a real edge.
Digital Leonard tweet media
English
0
0
0
109
Digital Leonard
Digital Leonard@DigitalLeonard·
The forex market runs 24 hours a day, but not all hours are equal. There are three major trading sessions, and knowing when they open changes everything. 1. ASIAN SESSION (Tokyo) Opens around 12am GMT. Lower volatility. Pairs like USD/JPY and AUD/USD move the most here. Good for range traders who like calmer conditions. 2. LONDON SESSION Opens around 8am GMT. This is where things heat up. London handles the largest volume of forex trades in the world. Expect bigger moves, tighter spreads, and more opportunity. 3. NEW YORK SESSION Opens around 1pm GMT. The second biggest session. When it overlaps with London between 1pm and 4pm GMT, that window is the most active period of the entire trading day. The overlap is basically rush hour for currency markets. More volume means more movement, and more movement means more chances to profit or get stopped out fast. So no, you do not need to stare at charts all day. Find the session that matches your timezone and your strategy, then focus there. Key takeaway: Trading at the right time matters as much as trading the right pair. Session awareness is free edge most beginners ignore.
Digital Leonard tweet media
English
0
0
4
197
Digital Leonard
Digital Leonard@DigitalLeonard·
This is one of my income streams I've been quiet about. Not AI. Not automation. Not OTC. Funded trading. $206,505 USDT in the account. $10K profit target. A few days left this month. Can we still make it? And why HyroTrader is the only prop firm I trust with crypto. Read 👇
Digital Leonard@DigitalLeonard

x.com/i/article/2070…

English
0
0
1
109