Patient Scot Invests

346 posts

Patient Scot Invests banner
Patient Scot Invests

Patient Scot Invests

@PatientScot

A Scottish investor documenting his long-term journey in the stock market. Analysing and learning every day. $OSCR $SOFI $NVO $AMD $URNM $NBIS $GRAB $FUBO $BITF

Dunfermline Entrou em Mart 2026
80 Seguindo59 Seguidores
Tweet fixado
Patient Scot Invests
Patient Scot Invests@PatientScot·
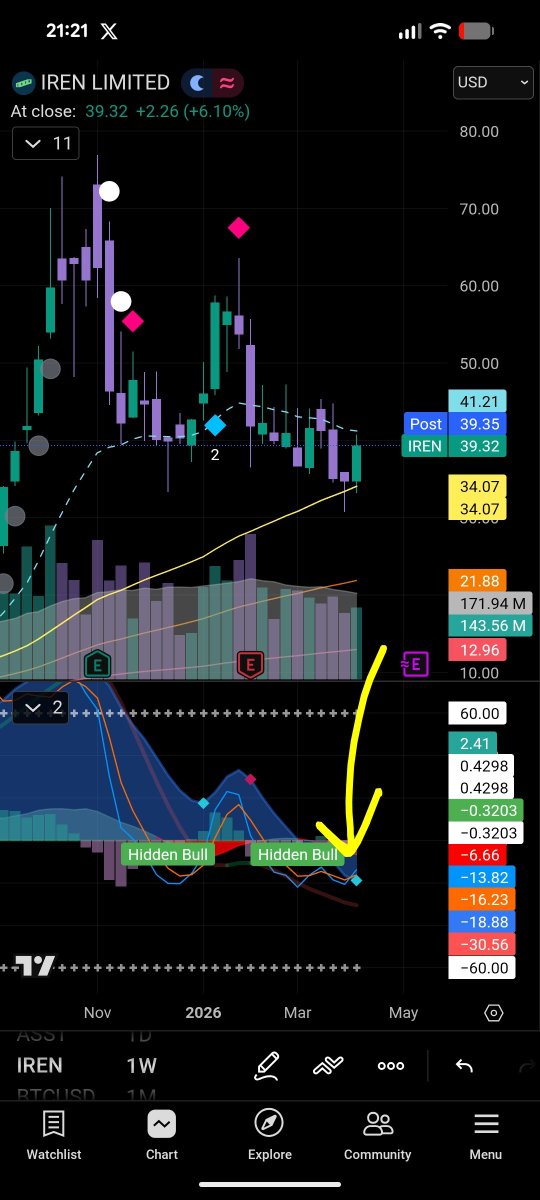
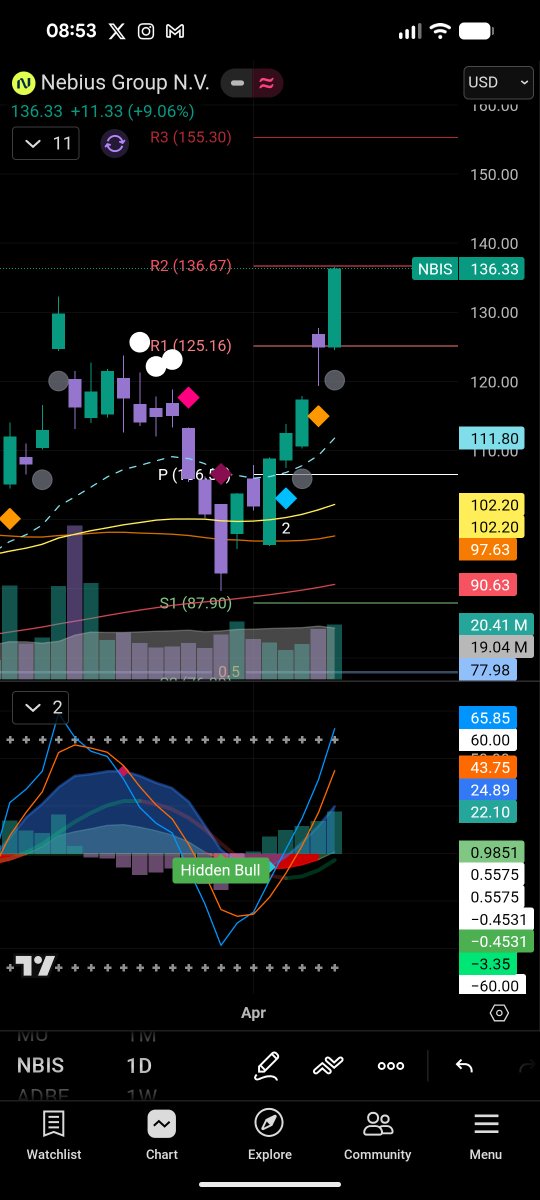
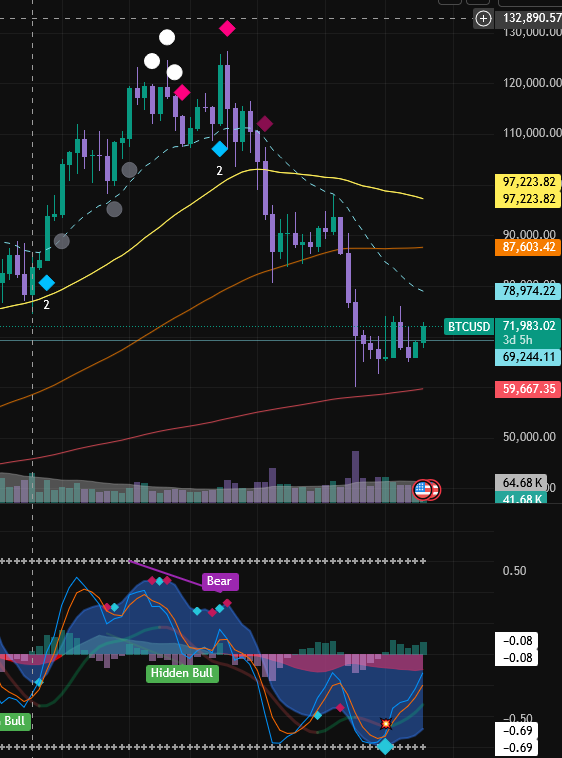
How to interpret my signal indicator: 👇
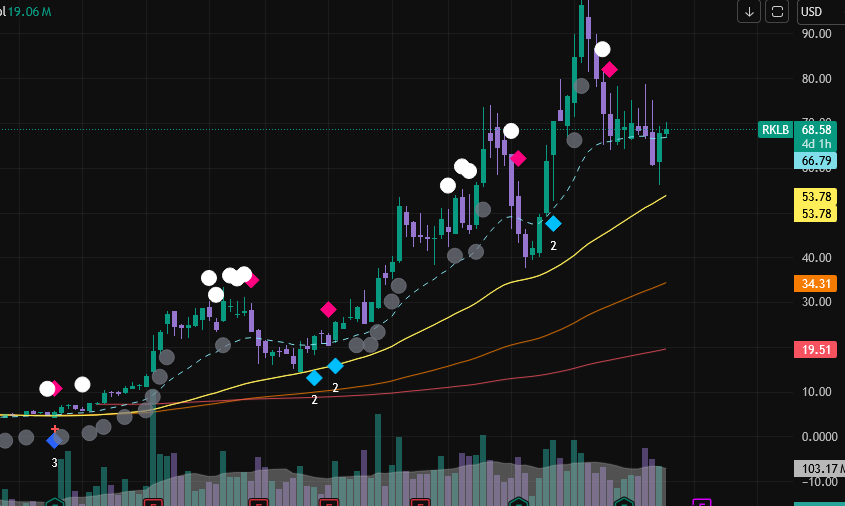
 Dark Blue Diamond 🔷 Bullish signal when presented on its own. Can feature with a red cross above it which is a proceed with caution warning as it is below a downward trending 50 day MA and can be a fakeout/dead cat/small pump so still bullish with your own risk appetite thrown in. Light Blue Diamond 💎 Very bullish signal. When these appear, price tends to go increase until it is invalidated by a pink/dark pink diamond. Can feature the number 2 or 3 below it which is how many confirmation signals it has with 3 being the best but 2 is most common and very strong. Pink Diamond ♦️ Bearish signal, the opposite of the dark blue diamond. Indicates price will likely head lower until it is invalidated or compounded into a dark pink diamond. Dark Pink Diamond 🛑 Very bearish, strong capitulation signal with price dropping significantly after it has printed most of the time. You would wait for another signal before entering as you would be catching a falling knife. White Circle ⚪️ Bearish warning signal. Its a bit like a pre-warning that a pink diamond is on the way. Not quite an exit sign but precedes the pink. Will print multiple times too and its essentially up to you if you want to exit the trade or hold for it to be invalidated. The more they print the higher likelihood of a pink appearing next. Grey Circle 🩶 Bullish early signal. Opposite to the white circle where it gives signals that precede blue diamonds or act as confirmation of continuation of trend (you have a blue diamond and then get a grey circle, this indicates continuation) Essentially we want to buy blue and sell pink 🤝 This chart features all of the signals barring the capitulation dark pink diamond. Price action plays a role in the effectiveness of the signals. A stock thats been trading sideways for 6 months will flag signals on and off quite consistently but a chart like the one here on $RKLB you can see the power of the indicator if you are a swing trader. Weekly/Monthly chart works best but can be used on pretty much any timeframe you like. Want to try it out? Send me a DM and ill fire it over 💎📈😄
Patient Scot Invests tweet media
English
0
0
0
89
Patient Scot Invests
Patient Scot Invests@PatientScot·
$AMZN weekly... The power of the market cipher!🔋 Last week it printed a blue diamond, this week saw a 13% move in Amazon. 📈 Now the chart has a fresh blue weekly bullish blue diamond however after a strong week I'd expect a bit of a pullback before a leg higher 🦵🏼 Are you in $AMZN?
Patient Scot Invests tweet media
English
0
0
0
36
Patient Scot Invests
Patient Scot Invests@PatientScot·
$IREN Weekly... Now then. Holding the 50WMA nicely and printed a brand new weekly blue diamond on the cipher! 💎 Nothing on the weekly chart yet but the daily does have a blue diamond with red cross (proceed with caution) that's still a bullish signal for those with more of a risk appetite just not as strong 💪🏼 I'm adding more here, next week could be big. Either way DCA all the way. NFA
Patient Scot Invests tweet media
English
0
0
1
172
Patient Scot Invests
Patient Scot Invests@PatientScot·
$NBIS Daily... I was wrong but also right?! My head told me yesterdays closes at R2 would see some profit taking today on a cheeky Friday before the weekend but noooooo.....😅 Instead the gold chart indicator was indeed correct, up 36% already but only a small position 🥲
Patient Scot Invests tweet media
Patient Scot Invests@PatientScot

$NBIS Daily.... Hit bang on R2 after this huge move over the last week. I would expect some profit taking here and a pullback before a leg higher 📈 R3 is $155 which is crazy to think it could get there when it was below $100 so little time ago. But slow and steady should win the race. Don't chase, don't FOMO & stay disciplined 🫡 Could it rip parabolically? Yes, it certainly could but be wary ⚖️

English
0
0
0
185
Cantonese Cat 🐱🐈
Cantonese Cat 🐱🐈@cantonmeow·
Just to remind you that we just came out of a March 2026 $IWM monthly candle that had larger capitulation volume than the COVID crash in March 2020. A strong resistance zone of 4 years have flipped into support.
Cantonese Cat 🐱🐈 tweet media
English
14
22
246
29.7K
Patient Scot Invests
Patient Scot Invests@PatientScot·
@Fibonacci_TA Yes it's certainly looking enticing. I'm in NBIS and IREN and KEEL(I don't want to talk about it 🥲) but have been in and out of CIFR but am very tempted to take a position and have a combo of the 4 in a mini ETF if you like 😂
English
0
0
1
89
Fibby.
Fibby.@Fibonacci_TA·
@PatientScot I’m not yet in this name but it’s one of the better setups for sure. Could be starting a position as the foundation keeps improving. Hoe about you?
English
1
0
1
79
Fibby.
Fibby.@Fibonacci_TA·
🏦 $CIFR Dark Pool — Apr 9 The institutional zone has expanded upward from $12–$13 to $12–$16. Same anchors at the bottom, new activity on top. 🥇 $13 → 16.6M shares (DP-dominant) 🥈 $15 → 12.6M shares 🥉 $12 → 8.8M shares Last week it was a tight $12–$13 with 48M shares. This week the range widened — $14 (7.4M), $15 (12.6M), and $16 (8.4M) all showed up with meaningful institutional volume. The zone stretched higher while the original anchors held. 🔑 $13 remains the heaviest single anchor. $15–$16 are the newer additions. Price above the entire zone with 54M+ shares of institutional volume concentrated beneath.
Fibby. tweet media
Fibby.@Fibonacci_TA

$CIFR (weekly) — Hold that demand zone and the targets for the upside look very juicy at $42 and $71.

English
2
2
17
10.1K
Patient Scot Invests
Patient Scot Invests@PatientScot·
$NBIS Daily.... Hit bang on R2 after this huge move over the last week. I would expect some profit taking here and a pullback before a leg higher 📈 R3 is $155 which is crazy to think it could get there when it was below $100 so little time ago. But slow and steady should win the race. Don't chase, don't FOMO & stay disciplined 🫡 Could it rip parabolically? Yes, it certainly could but be wary ⚖️
Patient Scot Invests tweet media
English
0
0
2
349
Patient Scot Invests
Patient Scot Invests@PatientScot·
@cantonmeow Bro, thanks for the positive software post. I don't think there will be as many casualties as people think through ai
English
0
0
0
7
Patient Scot Invests
Patient Scot Invests@PatientScot·
Ffs, another runner before I got the chance to build the position 🥲 Might have to change my name to the impatientscot 🤔
Patient Scot Invests tweet media
English
0
0
0
11
Patient Scot Invests
Patient Scot Invests@PatientScot·
$BTC Weekly... Still no new signal on our chart indicator since the dark pink signal which felt like aaaaages ago. We are patiently awaiting a new bull signal 🐂 We had no signal during the previous ladder step decline just after the dark pink diamond in which price was holding the 100WMA until it didn't... We got a blue diamond on the cipher then a pink one a few bars later and that was our warning ⚠️ However...Explosive blue diamond on the cipher and the last few weeks have looked positive for Bitcoin but despite this my gut tells me we take a trip to the 200WMA at $59K (I'm not complaining, id welcome it!) ⚖️
Patient Scot Invests tweet media
English
0
0
3
63
Stephenblaq
Stephenblaq@Steezehuman·
Small accounts tweeting to absolutely ZERO engagement
Stephenblaq tweet media
English
1.1K
436
3.6K
136.4K
QC Capital
QC Capital@QC_Capitals·
Growth stocks or Dividend stocks?
English
37
1
29
2.3K
CMS Invests
CMS Invests@cmsinvests·
$MSFT is a $700 stock trading at $350 btw…
English
59
19
530
53.2K
Patient Scot Invests
Patient Scot Invests@PatientScot·
$PLTR Weekly... Any Palantir fans out there? I am not a shareholder personally but thought i'd drop a chart for those that are. Pink Diamond ⏭️ Dark Pink Diamond ⏭️? We still have no new signals on the weekly chart since the dark pink diamond. Had a couple of blue's on the cipher but invalidated by the pinks pretty quickly. With no new signals, what looked like a bottom was just a relief rally before more downwards movement 📉 IMO this doesn't look pretty.... It felt as if it were inevitable $PLTR would have a major correction as it was valued waaaaay too high a few months back. That two year average at $107 is looking more and more likely if you want the non sugar coated version 🤭Hope im wrong though!
Patient Scot Invests tweet media
English
0
0
0
106
Patient Scot Invests
Patient Scot Invests@PatientScot·
$HIMS Weekly.... So we got the explosive blue diamond in the cipher at weekly close before the massive 60% gap up... aaaaand we missed it. 😅💎 can't get em all! I'm not $HIMS bull tbh, but I am in it for a swing at $20 as believe the upside is there. No new chart signals yet and a double rejection (so far) over the last 2 weeks of the 200WMA tell me its going lower and might potentially fill that gap which is roughly 18% lower from here. 😮‍💨 Of course i'll keep you updated if we get a chart signal change as that dark pink diamond on the left is still live waiting to be invalidated 🫡
Patient Scot Invests tweet media
English
0
0
0
173
RonnieV
RonnieV@TheRonnieVShow·
SaaS-Geddon Continues... $IGV -3.5% $MSFT -1.6% $PLTR -7.5% $ZETA -6.4% $CRM -3.2% $APP -3.1% $ADBE -3.7% Who are you buying here?
RonnieV tweet media
English
34
1
68
19.1K