
Sachin S.
350 posts
Sachin S.
@SHSspeak
trade and service, like charts, moving avg.
Maharashtra, India Присоединился Mart 2012
453 Подписки50 Подписчики

My family is in politics.
I'm in oral care.
They still don’t exactly know what I do.
People find that strange.
I find it simple.
I suffered with dental problems for 20 years.
The kind that cost you money, time, and confidence for years.
I didn't want to fix elections.
I wanted to fix the thing that quietly ruins people's lives before they even notice.
Oral health in India is broken.
Oracura is here to change that.

English

BIG NEWS -
BJP to ally with NCP and Congress for Raigad ZP Chairman Election.
Chairman post to BJP and Deputy Chairman to NCP.
Shinde Sena to sit in opposition despite winning maximum wards.
BJP : 15
NCP : 16
SS : 21
Both BJP and NCP are gaining maximum with their alliance.
English
@NewsArenaIndia Please correct, not NCP and Congress it's Nationalist congress means only NCP.
English
@nsitharaman @nsitharamanoffc It seems that carmakers can hike prices in January. Government relief in the GST cut can go to carmakers' wallets. Please ensure the customer benefits.
English


If you have completed all the steps, then please DM me. It will be easy for me to proceed.
Raushan Shrivastava@OptionsFlavour
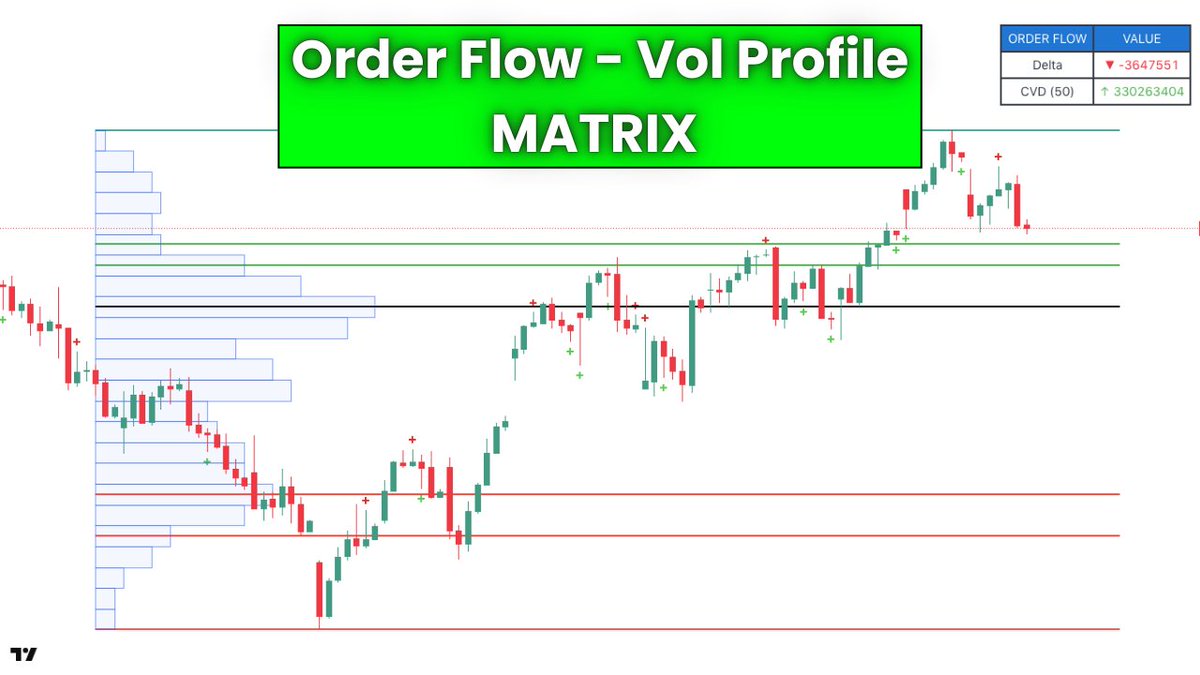
🚨 Order Flow & Vol Profile - Matrix 🚨 ✅ Green ‘+’ below a red candle: More BUY volume than SELL volume (hidden buying or absorption) ✅ Red ‘+’ above a green candle: More SELL volume than BUY volume (hidden selling or distribution) ✅ Delta: BUY volume minus SELL volume on the latest candle ✅ CVD (50): Total of (BUY volume – SELL volume) over the last 50 candles ✅ Black line (POC): The price level where the highest volume was traded within the selected lookback period ✅ Green lines (VAH 70%, 85%, 100%): Upper levels where most of the volume got traded ✅ Red lines (VAL 70%, 85%, 100%): Lower levels where most of the volume got traded Get this Indicator FREE in just 3 steps: 1️⃣ Follow @OptionsFlavour 2️⃣ Like ❤️ • Repost 🔁 • Comment 💬 3️⃣ DM your TradingView ID Access will be unlocked within 24 hours.
English
Sachin S. ретвитнул

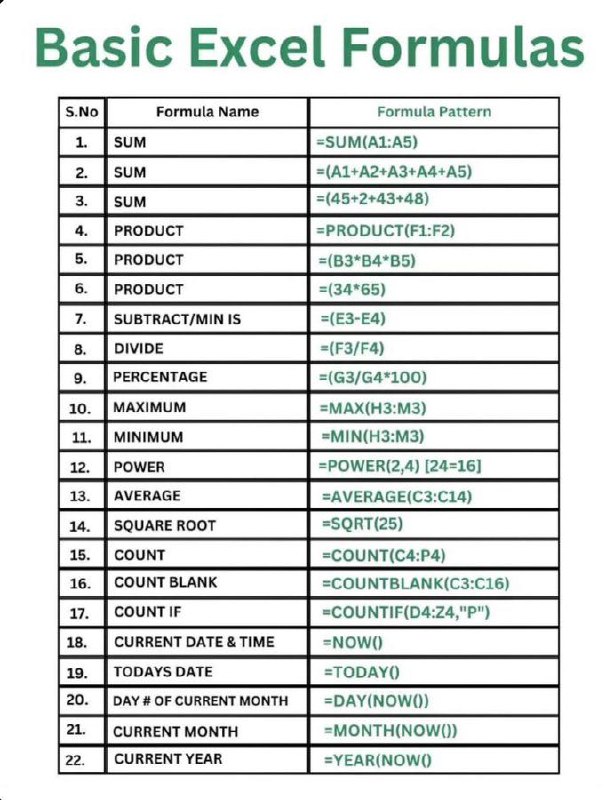
Excel is difficult to learn, but not anymore!
Introducing Complete Excel Training Course, All formulas, Tips & Tricks , shortcuts Absolutely Free
It helps you to save 80% time and money
To get it FREE, just:
👉 Like and Repost
👉Comment "Excel"
👉Follow me (so that I can DM)
(Free for only 48 Hours)
English
Sachin S. ретвитнул

Sachin S. ретвитнул

🚨 GIVEAWAY time!
My friends at @tradingview launched their Black Friday sale & to celebrate, I'll pick 2 lucky winners to receive 1 Premium & 1 Ultimate annual Sub - FREE!
Like & share this post & leave a comment to enter.
Winners picked on Nov 27!
tradingview.com/black-friday/

English
Sachin S. ретвитнул

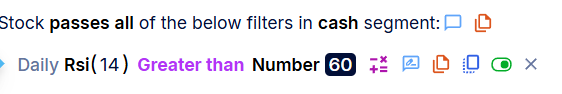
I create my own #scanner to find out such stocks.
This scanner is based on a powerful Tight Range pattern with Ema setup
To get this scanner Like, Repost, comment "Scan" .. I will send you the Scanner in your DM.
👉 After 100 Like ❣️ Scanner share my Telegram channel 🔗 t.me/Investwithdine…
You must follow me so I can DM you!
#Multibagger | #StocksInFocus | #NiftyMidcap100


English
Sachin S. ретвитнул
🚨 Order Flow & Vol Profile - Matrix 🚨
✅ Green ‘+’ below a red candle:
More BUY volume than SELL volume (hidden buying or absorption)
✅ Red ‘+’ above a green candle:
More SELL volume than BUY volume (hidden selling or distribution)
✅ Delta:
BUY volume minus SELL volume on the latest candle
✅ CVD (50):
Total of (BUY volume – SELL volume) over the last 50 candles
✅ Black line (POC):
The price level where the highest volume was traded within the selected lookback period
✅ Green lines (VAH 70%, 85%, 100%):
Upper levels where most of the volume got traded
✅ Red lines (VAL 70%, 85%, 100%):
Lower levels where most of the volume got traded
Get this Indicator FREE in just 3 steps:
1️⃣ Follow @OptionsFlavour
2️⃣ Like ❤️ • Repost 🔁 • Comment 💬
3️⃣ DM your TradingView ID
Access will be unlocked within 24 hours.
English
Sachin S. ретвитнул

Big shoutout to @TradingView for their incredible generosity — I'm giving away an Ultimate & Premium subscription! Don't miss out! 🔥
Read on to enter!
👇
1 of 3

English

🚨Giveaway Announcement!🚨
I have 1 free Premium giveaway for a whole year! @tradingview
Pick a lucky number from 1–99
1
2
3
.
.
97
98
99
1 numbers hide a surprise of Trading view premium plan
Follow These 2 Rules to Get Eligible!👇📈
1- Follow me on Telegram:
t.me/FinanceWithSun…
2- Like & Retweet this tweet!♥️
The 1 lucky winner will be revealed by 27th November.📌

English