Locki Capital

312 posts

Locki Capital banner
Locki Capital

Locki Capital

@Locki_capital

เข้าร่วม Şubat 2021
154 กำลังติดตาม34 ผู้ติดตาม
Locki Capital รีทวีตแล้ว
Mr. Anderson
Mr. Anderson@Truecrypto·
Weak Pullbacks Warn You Strong trend → weak pullback → big continuation. Weak trend → strong pullback → likely reversal. How price pulls back tells you who’s in control. Watch the retracement character, not just the direction.
English
15
18
276
19.4K
Locki Capital รีทวีตแล้ว
Mr. Anderson
Mr. Anderson@Truecrypto·
Want an #altseason so powerful it makes 2017 look small? Then stop rooting for Bitcoin dominance to break down. You should want it to climb higher first. Here’s the paradox most traders overlook: If Bitcoin dominance rolls over too early, altcoins don’t get a legendary run, they get a shallow one. But if dominance rips higher first, sucking in all the attention, liquidity, and headlines, it lays the foundation for an altseason that’s unforgettable. Although a parabolic surge in Bitcoin dominance ($BTC.d) would be the ultimate setup, you should at least be rooting for one more strong push, even if it only resolves into a lower high. Why? Because history has already written this script. In 2017, Bitcoin sprinted from $1K to $20K, draining every ounce of market liquidity. Maxi’s gloated, skeptics mocked, and alts were declared dead. And then, BOOM. The most explosive altseason in history erupted, catching everyone flat-footed. That cycle revealed the formula: •Step 1: Bitcoin dominance goes wild. A vertical run, a massive push into highs, or even a final sweeping lower high. •Step 2: Altseason detonates. Overflowing liquidity rotates, and suddenly everything runs. Now imagine BTC driving to $150K… $200K… even $250K. 24/7 news cycles, governments forced to comment, TV anchors wondering if Bitcoin should be the new reserve currency. That kind of euphoria is what supercharges the next rotation. Yes, some alts are playable now, if they’re already beating BTC, ETH, and SOL in relative strength. But the true fireworks don’t start until Bitcoin dominance makes that final, aggressive push. So don’t root for BTC dominance to collapse early. Root for it to expand, parabolic if possible, or at least one more strong push higher. Because the more Bitcoin eats now, the sweeter and more violent the rotation into alts will be when the tide finally turns. Stay patient. Let Bitcoin have its moment. The reward for waiting could be beyond imagination.
English
72
89
833
121.6K
Locki Capital รีทวีตแล้ว
IncomeSharks
IncomeSharks@IncomeSharks·
How money likes to flow through crypto every cycle: $BTC pumps -> $ETH pumps -> Alts pump -> Midcaps pump -> MARKET DROPS -> Microcaps pump -> MARKET GET BORING -> Memes pump -> MARKET BLEEDS -> Scams/anger/fear -> FINAL DUMP then :RESTART:
English
101
706
3.4K
2.1M
Locki Capital รีทวีตแล้ว
Mr. Anderson
Mr. Anderson@Truecrypto·
You will enter the world of trading in pursuit of money. However, if you persevere, you will gain something much more valuable: – Discipline – Confidence – Self-awareness The profits will come, but the real transformation will be within you.
English
12
16
231
16.5K
Locki Capital รีทวีตแล้ว
God of Prompt
God of Prompt@godofprompt·
I just built a complete Asset Management System in rocket.new From dashboard design → integrations → automation. Here’s the full process 👇
God of Prompt tweet media
English
9
18
79
31.2K
Locki Capital รีทวีตแล้ว
CryptoAmsterdam
CryptoAmsterdam@damskotrades·
Again: > Staying positioned and not selling to buy back lower > Not chasing here into highs after weeks of green > Focus on unexpected high fear entries or confirmation Sticking to spot, not chasing green, and preparing for unlikely high fear dip scenarios where the bull market is still intact but on an edge.
English
5
1
50
6.3K
Locki Capital รีทวีตแล้ว
CryptoAmsterdam
CryptoAmsterdam@damskotrades·
// Positioning in a bull market > how > from here on > altcoins One of the things I’m most proud of this cycle: the low amount of execution, only positioning at the extremes. While most are locked in trying to time daily moves and execute weekly, I made just a handful of big moves this cycle. My three biggest positioning moves this cycle: 1. Initial Bitcoin 30K reclaim early cycle → mainly BTC + SOL 2. Total 3 chart retest of the range lows in 2024 3. The tariffs FUD dip in April/May → ETH around $2000, and HYPE around $13, for example. Of course, there have been trades in the meantime, like buying PUMP a couple of weeks ago, but these were the 'bigger portfolio shifts'. If you want to ride this bull market, you need to accept that every trade carries the risk of being wrong. Take too many trades, and eventually you’ll end up trapped in a bad spot. Just like the April/May tariffs dip in the screenshot above, I prefer waiting for the extremes to be tested, while the overall structure still holds. That’s the zone where fear, panic, and hopelessness take over. The zone nobody, including myself, expects it to go. Buying these zones will either prove you wrong quickly, and you will be stopped out on new trades, or give you entries that you can actually sit on for a while (ETH sub 2000 and hype sub 15, for example) Yet most do the opposite and chase green straight into resistance. Trading on emotions. Buying into extreme panic and fear, while you feel it yourself, never feels good. It feels terrible. But it’s necessary. / What from here? While I'm mostly positioned now, I'm still eyeing a few setups and am happy to get more exposure, but am not chasing here. Important to understand: I don’t necessarily expect such a dip, nor am I betting on it by selling. I’m simply prepared and ready to execute if it comes. By always mapping out even low-probability scenarios, where the market stays intact but looks nasty, fear is high, and key altcoins drip into support, you put yourself in a position for comfortable entries. It’s not the scenario I expect, but it’s one I’ll be ready for. From here on, I'll wait for either some extreme fear or a confirmed breakout. My bias is that the best for Altcoins has yet to come. So I'm interested in playing them. Why? > Bitcoin dominance It always drops on Bitcoin’s second leg into new highs, right where we are now. > Total Altcoin market cap catch ups Total altcoin market caps always, every cycle, complete a similar structure to Bitcoin. Range low reclaim, range highs, and the final more parabolic wave into new highs. They always lag behind, but they always catch up in the last part of the cycle. I don't expect it to be any different this cycle. As you can see, Bitcoin is looking pretty decent here, but retesting the highs + total 3 is showing a lot of strength here above the range high but into the local high resistance. Even though I’m macro bullish, you need to make it emotionally easier to hold. Buying after weeks of green, into resistance, when you didn’t execute in April/May or on later dips, likely means you’re acting on emotions now. Those same emotions will probably push you to sell after a 10–30% altcoin dip if you buy here at resistance. No matter how bullish the macro looks, dips in this part of the cycle are savage. At resistance, the probability of seeing them is higher. (Not guaranteed, but higher.) That’s why I prefer either buying after an extreme dip, or waiting for confirmation after a breakout. This approach: > Gives you a clear invalidation when entering (because where is your invalidation after weeks of green?) > Gives you a higher probability of not getting an immediate dip right after buying Again, I'm talking about buying. I'm NOT betting on a dip by selling or whatever. This entry strategy provided me with opportunities to sit on them for a while and take a dip from here. When I sell (very slowly), some here and there, it's with the purpose of taking profit on the cycle. (slowly over time > timing the top, but that's another topic) So again, this is not a scenario that I expect, but simply based on a scenario that I would be interested in buying. When I posted earlier in 2024, when the total 3 was at the range low support, nobody wanted to buy. Today we are at the range high When I posted in April/May that I was buying ETH at the range low reclaim, nobody trusted the green after weeks of red. Today, at the range, everyone wants to buy. (x.com/damskotrades/s…) And, even though I think both the total 3 and Ethereum will go higher, I'm not buying (not selling either) here and simply sit on my current positions. I expect Bitcoin to form a higher low and continue up—but so does everyone. At the same time Ethereum and the Total 3 are against resistance. That’s why I’m not buying here. I’ll wait for Total 3 and Ethereum to break above, then look for reclaim setups on the altcoins I want. Patience until confirmation, not buying into resistance. The other scenario I’m watching (not expecting, but ready for): > If Bitcoin takes out the lows again, maybe even dipping under 100K into the 90s. That would likely push Ethereum into blue support, and Total 3 back to the lows of its local range. If that plays out, many altcoins on my watchlist would drop into key support zones—prime entries. Again—this isn’t something I expect, and I’m not selling for it. But these unexpected fear scenarios are exactly the moments I like to position in. They always come. Every cycle, a handful of times—and we’ve already seen a few this one.
CryptoAmsterdam tweet mediaCryptoAmsterdam tweet mediaCryptoAmsterdam tweet mediaCryptoAmsterdam tweet media
CryptoAmsterdam@damskotrades

There is so much going on, but Bitcoin is still in the same spot. I'm still waiting for either of these: 1. reclaim range low resistance 2. previous ath structure 3. local lows sweep and reclaim

English
37
30
312
98.3K
Locki Capital รีทวีตแล้ว
ZERO IKA 🗡️
ZERO IKA 🗡️@IamZeroIka·
Plan continuation went really good. In here, apart from the idea itself, there was the confluence provided by the big conjunction mentioned, therefore found in the opposite side of the market where most charts (T2/OTHERS/OTHERS D.) were taking their major levels alongside plenty of HTF breakers on individual altcoins. When you make a plan and organize your trades, I will never stop to repeat it, the most difficult thing is context as finding levels is something that everyone can do, but the experience that it takes to contextualize everything..well, that is another different beast. For this reason yesterday I also posted a video explaining you my BTC thought process "in-tandem" with this update that I highly suggest you watching if you missed out on it: x.com/IamZeroIka/sta… Now as you can see we broke down from the HTF rising wedge where the demand at 4.37% provided a decent reaction (useful for taking partial profits) but during the push down, 4.44% (white rectangle) perfectly acted as breaker to re-load and smash the demand (1D+2D) which was mitigated several times. This breakdown is interesting because has created a 12H BOS below the 4.37% key level and this a first promising sign. In the meantime, as you can see, plenty of altcoins are performing extremely well with OTHERS + OTHERS D. that are breaking out and in this context altcoins can continue to perform while USDT D breaks down or consolidate. 4.22% now is a potential sensible area within a semi-HTF CBOB so in case we go there I would pay some attention cutting some partials on spot and longs to protect yourself in case the 4.35% area gets tested as a bearish breaker. However, we're looking for a potential break of the 4.17% that will likely open the doors for the 4.07%/4.10%, levels created during Mid-August and that must be taken into consideration for at least partial take profits. 3.69% remains a level I'm closely watching as potential final target.
ZERO IKA 🗡️ tweet media
English
7
17
202
18.2K
Locki Capital รีทวีตแล้ว
ZERO IKA 🗡️
ZERO IKA 🗡️@IamZeroIka·
🎯- Educational content: Qualifying demand/supply areas based on market activity - 🎯 This is probably one of the most important educational content I wrote and I suggest you to carefully read it since I believe it will help you to understand but most importantly to contextualize the areas you're watching on your charts in the way I do it. (and I believe it works) -------------------------------------------------------- 1⃣ Theory In my opinion, you cannot qualify a demand or supply zone based on levels alone, and this is where so many people go wrong. A horizontal box drawn around a low or high may look neat and convincing on a chart, but in isolation it tells you nothing about the structural participation of the market. A “zone” is only an assumption until the depth of activity within it is qualified, and this qualification cannot be derived from price alone. Price is simply a print on the tape: it is the reflection of trades that have already taken place. Without context, without the density of volume that shows us where business was actually conducted, those levels are hollow drawings that might just as well be wishful thinking. The FRVP (Fixed Range Volume Profile) is what transforms an arbitrary level into a zone with statistical legitimacy. The reason context is non-negotiable is because market structure is an auction, and auctions do not revolve around arbitrary highs and lows, but around the negotiation of value. The FRVP offers a lens into this negotiation by displaying where the majority of transactions occurred within a defined segment of price action. This creates what I like to call a "map of the battlefield": where buyers and sellers have already agreed on value, where value has been rejected, and where price is attempting to build or fail to build acceptance. Without this, the notion of a demand or supply zone is just narrative and not evidence. If price taps a level that you’ve drawn as supply, but volume data shows it sits in a thin, low-participation pocket, the rejection there is unlikely to be sustained as it’s air, not foundation. If price interacts with the VAH (Value Area High) and is instantly rejected, that rejection is not arbitrary but it's a clean evidence that participants are unwilling to reprice value higher, and this transforms a level from conjecture into a statistically-qualified zone. Similarly, if a demand zone aligns with the VAL (Value Area Low) and price begins to build acceptance above it, the implication is that buyers are attempting to redefine value upward from the outer boundary of consensus. These are actionable insights that cannot be gleaned from candlesticks alone. The problem with relying on levels in isolation is that it assumes the market respects static lines...well, it doesn’t. The market respects liquidity, and liquidity is embedded in volume. A level may appear to hold price for a moment, but unless the FRVP reveals substantive order flow and distribution there, that “hold” is fragile. The VP tells you whether the market considered that level worth fighting over, or whether it was simply bypassed with little interest, making this the context that separates professional qualification from amateur annotation. And this brings us back to mitigation and unmitigation. A mitigated zone sitting at the POC is not the same as an untouched unmitigated zone resting at the Value Area Low. One has been normalized into the market’s perception of fair value, while the other still carries untested liquidity that can fuel an aggressive move. FRVP is the only tool that lays this out clearly as it distinguishes between zones that have been processed and zones that remain potent. To pretend otherwise, to treat all levels as equal simply because they’ve been drawn on a chart, is to reduce analysis to little more than drawing areas and hoping. The blunt truth is this: you cannot qualify demand and supply without volume, and you cannot contextualize volume without the profile. 2⃣ Application + explanation The starting point is always the same: anchor your FRVP from a meaningful swing high to a meaningful swing low (or vice versa, depending on the direction of the move). "Why from swing high to swing low?" Because this isolates the auction leg, the segment of market activity where the imbalance originated. A swing high followed by an impulsive move down is the beginning of a potential supply structure. A swing low followed by an impulsive move up is the beginning of a potential demand structure. By anchoring your FRVP across this exact leg, you capture the entire distribution of traded volume that underpins the move which is not arbitrary, it’s the footprint of where "business" was done, and it’s the only way to distinguish whether your “zone” is real or a mirage. 👁️When you apply the FRVP from high to low, you are left with 3 critical levels: - POC (Point of Control): The single price level where the most contracts or shares traded. If your supposed demand or supply sits directly at the POC, understand that this level has already been normalized into the market’s perception of fair value. Don’t expect explosive rejection as it’s processed liquidity. - VAH (Value Area High): The upper boundary of 70% of all traded volume within that swing. Supply zones that overlap with VAH are powerful when price retests and rejects them. Why? Because they mark the edge of accepted value. If the market refuses to build above that edge, sellers are defending. - VAL (Value Area Low): The lower boundary of that same 70% distribution. Demand zones that overlap with VAL gain legitimacy when price retests them and then builds acceptance back above. Buyers are showing up to keep value inside the range. Now watch what happens when you use this method concretely. Let's say that price drives down from a swing high, leaving behind what you’ve identified as a potential supply zone. When you anchor FRVP from that swing high down to the swing low of the move, you can immediately see whether your zone overlaps with the VAH or whether it sits in a thin low-volume pocket above value. If it aligns with VAH, rejection there carries real structural weight as it’s the market defending value. If it sits in a low-volume pocket above VAH, it may act like a vacuum where price snaps back quickly but struggles to hold. If it’s at the POC, don’t fool yourself into expecting an outsized reaction as that’s where the market already agreed value resides. 3⃣ Examples 1. DOGE HTF areas validation: ("novice") 2. LTC HTF areas validation + breakers ("intermediate") 3. BTC MTF + HTF areas validation 4x VP ("advanced") As you can see from the examples above you can overlap VPs in order to have a clean map of different VAHs/VALs/POCs based on the context and on the timeframe, giving you a fantastic and sound perspective not only on the areas, but also to build your long and short theses depending on how the price action evolves (above or below volume clusters) こちらの内容が気に入ったら、「いいね」と「リポスト」をぜひお願いします!
ZERO IKA 🗡️ tweet mediaZERO IKA 🗡️ tweet mediaZERO IKA 🗡️ tweet media
English
25
65
483
28.9K
Locki Capital รีทวีตแล้ว
ZERO IKA 🗡️
ZERO IKA 🗡️@IamZeroIka·
We live in an age that pushes us to run endlessly. Always toward something new, bigger, more “important.” The more we achieve, the less it seems to be enough. It’s as if life has become a constant race to see who owns the most, especially in economic terms. But let’s pause for a moment and reflect: are we really seeking freedom or are we stepping into a golden cage? Many believe that money is the key to feeling free. In a big part, it is because it gives us opportunities and security but if it becomes the only measure of our worth, we stop living and start merely chasing. It’s a race that has no finish line. The philosopher Epicurus said that wealth does not consist in having much, but in desiring little and modern psychology confirms that gratitude is one of the most powerful tools for cultivating well-being and happiness. Because what truly matters is not having everything, but being able to appreciate what we already have. The problem is that today’s society constantly distracts us from this truth: it makes us compare ourselves to those who have more, it shows us “perfect” lives that often don’t even exist, and it makes us forget how lucky we already are. For years I too chased the idea that “having more” would make me free but over time I realized that my true search wasn’t about accumulating, nor about proving anything to anyone. What I really wanted was just one thing: the freedom to live on my own terms and today, I can say I have achieved it. I no longer seek money to feel fulfilled. Of course, I still want to grow, improve myself, and learn new things but I don’t chase a material goal anymore, because I’ve already achieved my main goal: freedom and for me, that is enough. True freedom doesn’t come from accumulation. It comes from knowing we are not slaves to endless desire. It comes from pausing for a moment and telling ourselves: I already have enough, I already am enough. Perhaps we should learn to slow down, to look at what we have with new eyes: the people who care for us, the small moments of peace, the genuine gestures, the opportunities we already live. Because if we are always running toward tomorrow, we risk losing the present. And the present is the only place where happiness can truly exist.
English
30
34
349
20.3K
Locki Capital รีทวีตแล้ว
Mr. Anderson
Mr. Anderson@Truecrypto·
The fastest way to ruin your life? Chasing approval. No matter what you do, you’ll never please them all. Stop performing. Start living.
English
24
15
242
23K
Locki Capital รีทวีตแล้ว
IncomeSharks
IncomeSharks@IncomeSharks·
Waiting for a good trade is a trade. There's a couple opportunities each year where if you wait long enough and have cash ready you'll outperform a years worth of trading.
English
136
114
1.5K
88.4K
Locki Capital รีทวีตแล้ว
Mr. Anderson
Mr. Anderson@Truecrypto·
A country run by banks will always be in debt Healthcare run by Big Pharma will never cure disease A state run by war will never know peace A nation run by media will never know the truth
English
29
59
470
21.1K
Locki Capital รีทวีตแล้ว
Crypto Feras 
Crypto Feras @CryptoFeras·
#Bitcoin bookmark this 🔖 if PA is noisy and confusing, remove the candles and keep the 4H EMAs 🧠 Since 22.Aug, EMAs had their bear cross ✍️ easy money mode when EMAs cross #bullish again. $btc #protip #trading
Crypto Feras  tweet media
English
27
14
103
8.1K
Locki Capital รีทวีตแล้ว
cevo
cevo@cryptocevo·
Gm
cevo tweet media
188
277
2.6K
137.6K
Locki Capital รีทวีตแล้ว
ZERO IKA 🗡️
ZERO IKA 🗡️@IamZeroIka·
August monthly candles on both BTC and TOTAL1 need to be monitored and taken into consideration, in my opinion. I already discussed about my BTC overall view in this post x.com/IamZeroIka/sta… and the last closure is strengthening the thesis. Technically speaking we can identify this formation as a clean tweezer top, a pattern where both candles share approximately the same high with similar bodies size, hinting at absorption and potential trend reversal. While the pattern/name alone doesn't mean much, I believe that context matters a lot and if we take it with a broader perspective, this acquires more validity. We come in fact from an uptrend that started in December 2022 that has already produced an average of a +700% in a context where returns are clearly diminishing. As you can see, also T1 is displaying a clean monthly SFP reaching the significant mark of 4T (target I discussed months ago) with a very thin body candle and a long wick. This doesn't mean lower from here as this is a monthly TF and there could be still another impulse in confluence with the plan I shared on the USDT D, potentially reaching the fibs you see in my BTC chart and 4.4/4.5T on T1, but this should regardless suggest you to be extremely careful and that, overall, is not the time to buy Bitcoin for the long term as the trend is weakening. Different topic is the altcoin one where T2/OTHERS are positioned slightly better and might hold another macro leg up before concluding their cycle. Sharing my thoughts here with you as a reason to not get absorbed into "supercycle" or "up only" things that might slaughter you.
ZERO IKA 🗡️ tweet mediaZERO IKA 🗡️ tweet media
ZERO IKA 🗡️@IamZeroIka

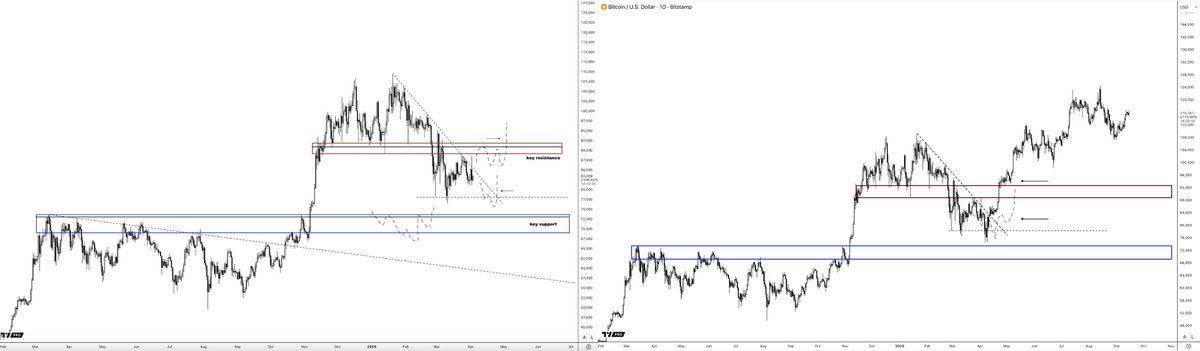
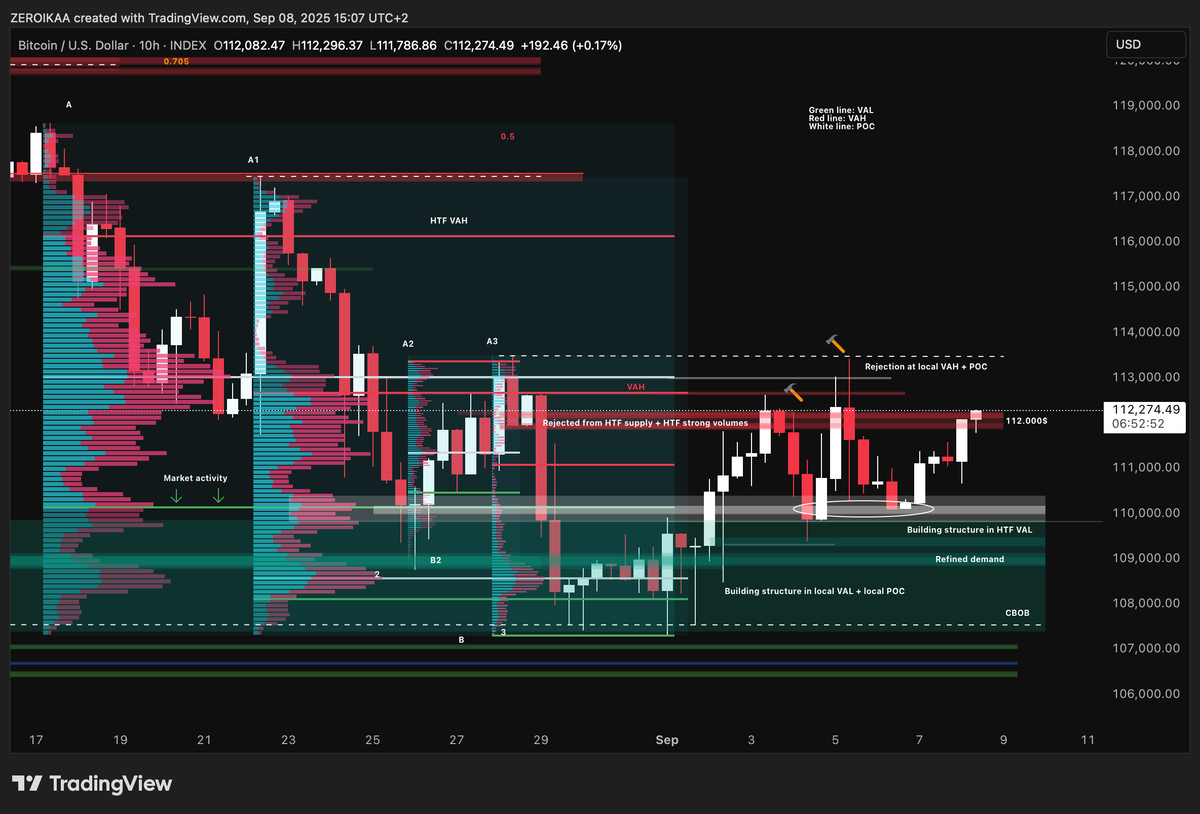
Week after week, the HTF distribution on BTC appears increasingly evident to my eyes, not only through volumes (where every downside move is accompanied by disproportionately large volume while each upside attempt lacks support) but also through the way price behaves, with violent spikes and heightened volatility. In an HTF distribution phase, price and volume dynamics converge toward highly recognizable patterns. The core factor is the progressive imbalance between supply and demand: bearish impulses show strong volume, indicating that large players are actively unloading positions, whereas rebounds occur on compressed volume and fail to sustain momentum, signaling the absence of genuine institutional demand. (also the body size of the candles matter) 
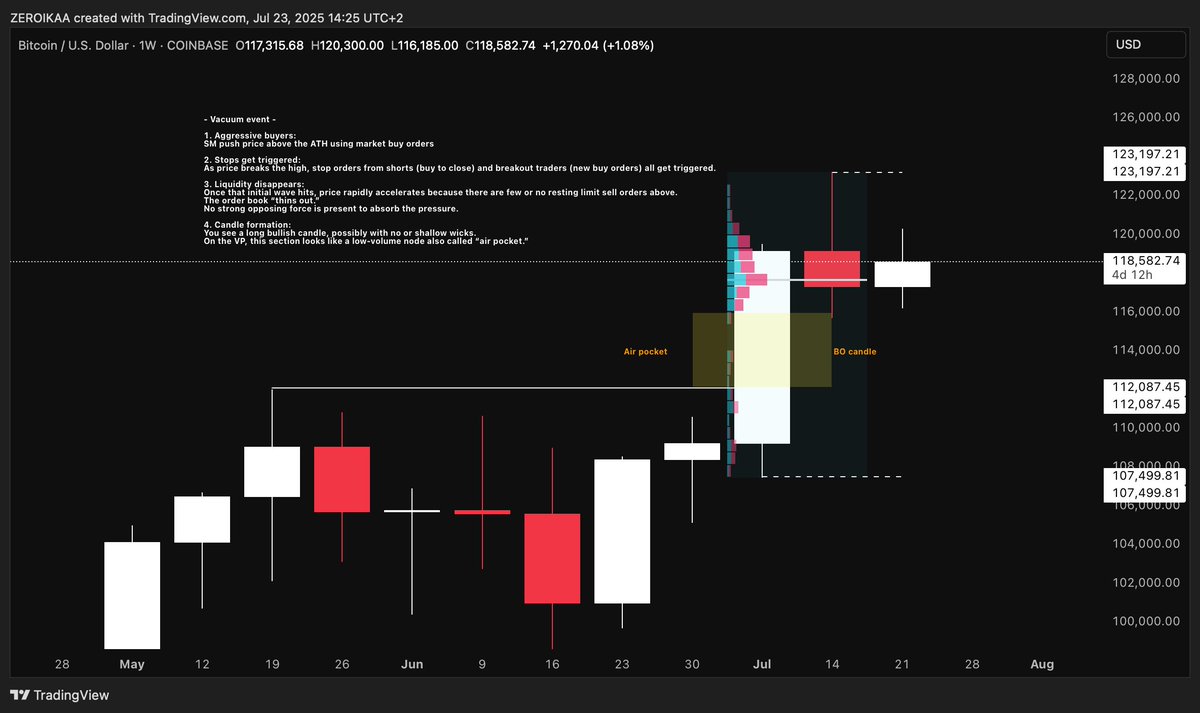
On a microstructural level I'm noticing sharp spikes and rising volatility that are clearly highlighting stop-hunting activity where liquidity pools are deliberately targeted to generate artificial flows and secure counterparties for distribution. This is translating into erratic price action marked by false breakouts above resistance (UTAD in "Wyckoffian terms") quickly followed by bearish confirmations, while demands are repeatedly tested with marginally lower lows and swift recoveries, a classic sequence of liquidity grabs. (something we've seen during the Jackson hole and yesterday, for example) Now, is this bad? Yes and no, in my opinion. Yes because all of these tests are creating damages consuming internal liquidity and therefore favoring a strong bearish candle when the time will come (path of least resistance) 
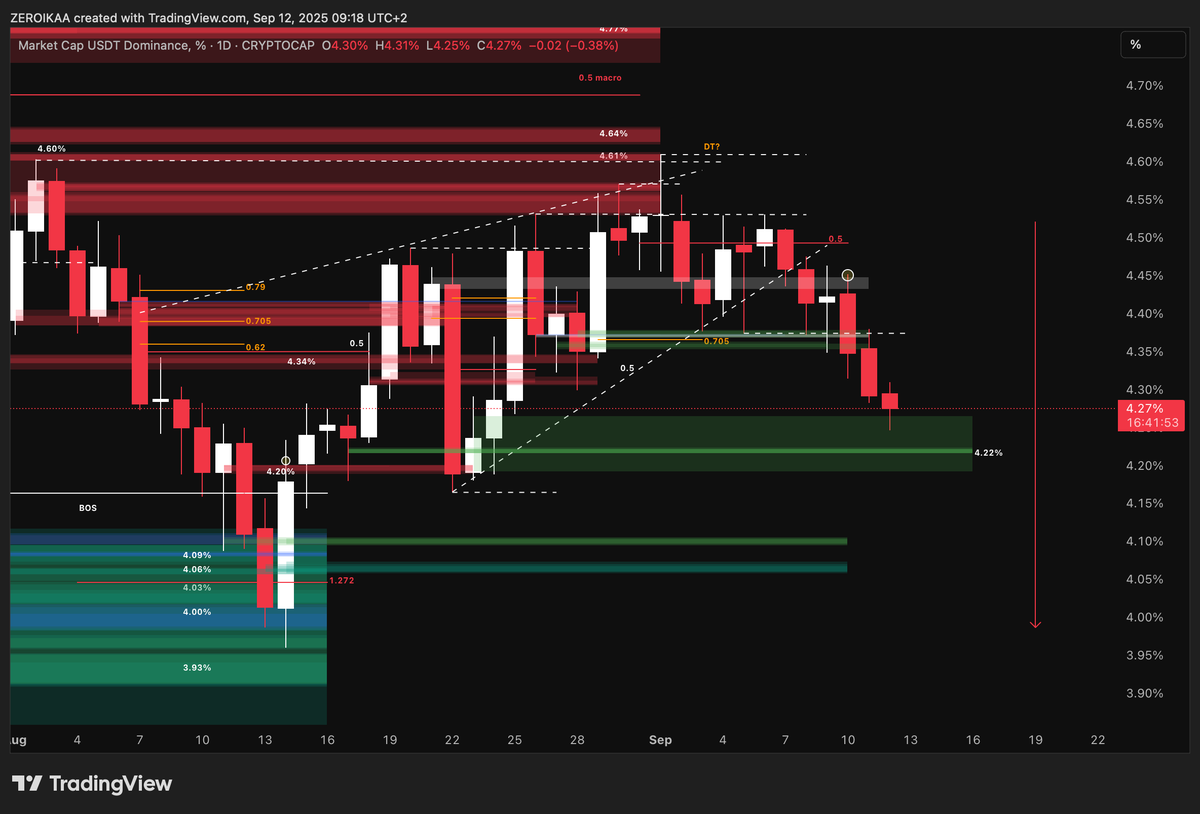
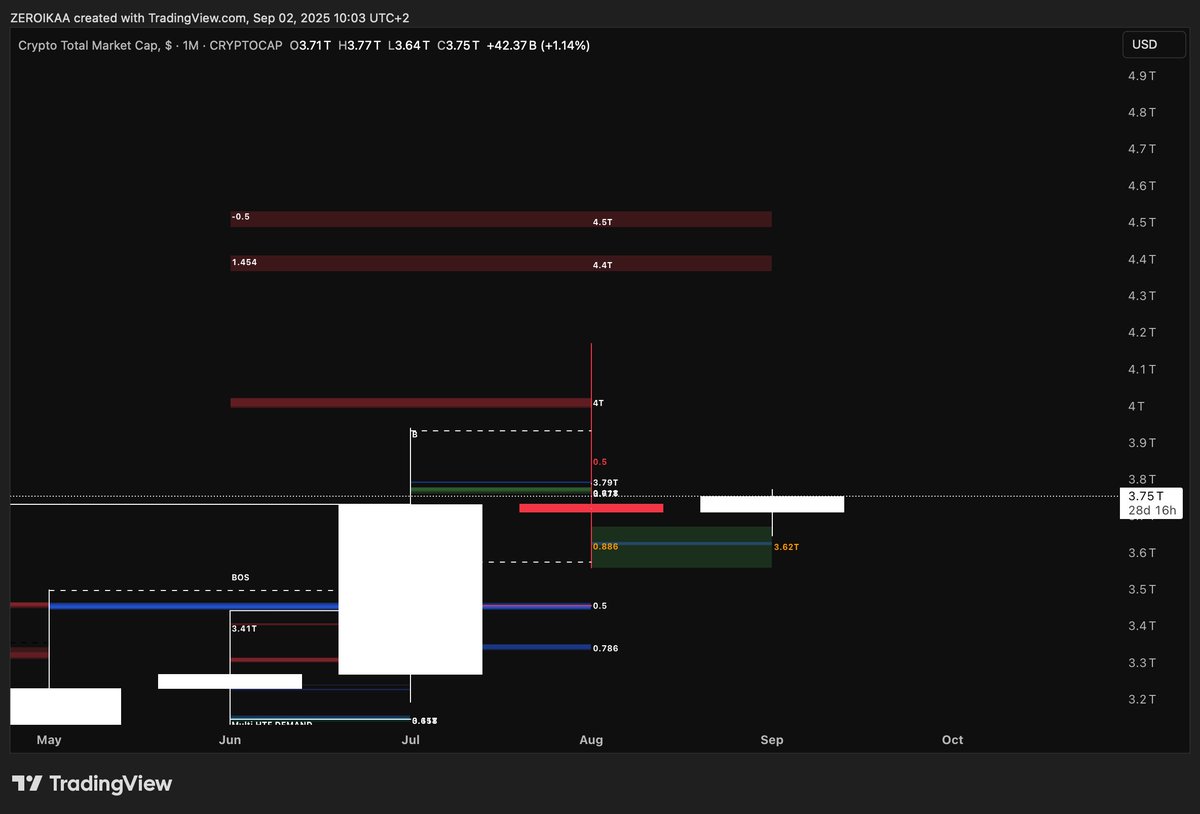
No because on the opposite side this situation is favoring capital rotation (observe BTC D. + ETH/BTC + altcoins in general) as they are not decreasing as they would have in the opposite scenario. On altcoins, we're seeing a lot of absorption toward demand/breakers confirmed by the volumes and this means that smart money are sustaining individual strength. This capital rotation is, in my opinion, a clean statement that they're amplifying the gains they made through BTC and, for this reason, this should be a +1 in the distribution thesis. Which is also the most fascinating and entertaining part of the cycle.

English
9
13
220
16.9K
Locki Capital รีทวีตแล้ว
ZERO IKA 🗡️
ZERO IKA 🗡️@IamZeroIka·
When trading, the paradox is that mastering one coin can often be more profitable than trying to manage many. If you select a coin with high liquidity and solid underlying technical structure (you'll understand which ones they are based on experience) you reduce market noise and give yourself the ability to focus entirely on its mechanics. High volume ensures a cleaner order flow, allowing you to study how liquidity is positioned, how price reacts to FVGs, and how order blocks form and get mitigated. With a single, technically sound coin, you can build an extensive library of observations. You can build up a spot position, hedging it with longs and shorts, taking profits at key areas while always remaining in the game. This concentrated approach also strengthens the psychological side of trading. By working with one instrument, you’re exposed to fewer false correlations and random setups. Your mind adapts to the coin’s “flow,” which reduces hesitation and over-analysis. Decision-making becomes faster, not because you rush, but more because you’ve internalized its order flow dynamics.
English
22
30
514
33.4K
Locki Capital รีทวีตแล้ว
Mr. Anderson
Mr. Anderson@Truecrypto·
@CastilloTrading Layer those buys... I might miss once or twice, but I rarely strike out. Give yourself a chance at a hit!
English
7
6
71
15.8K
Locki Capital รีทวีตแล้ว
ZERO IKA 🗡️
ZERO IKA 🗡️@IamZeroIka·
- Price discovery, my methodology - 🎯 I receive plenty of questions on how to operate when the price of an asset enters the "price discovery" mode, so I decided to show you my methodology. (so you can avoid getting rekt) When the price of an asset enters price discovery mode, you're navigating entirely uncharted territory. This is a phase where historical reference points like previous highs, supply or demand zones simply don’t exist. Many people find this intimidating, but if you understand the mechanics and mindset required, it becomes one of the most lucrative phases of a market cycle. In price discovery, the market is essentially seeking equilibrium. It’s trying to find out how far it can go before it meets sufficient exhaustion. SM will often leave behind very subtle clues, not levels to be trusted as firm barriers, but behaviors to interpret. Without predefined zones therefore, my focus shifts from levels to behavior. I pay attention to how price moves rather than where it moves. This means observing the strength of impulsive moves, the quality of pullbacks, the presence of absorption, and the reactions to volume nodes if they even exist at this stage. It's less (not nothing) about technical tools and more about narrative: who is in control, and are they still motivated to push the price? Market structure becomes extremely fluid in this environment. I might find myself using LTF structure to navigate, identifying bullish or bearish shifts based on classic swing highs or lows, but also on how price reacts to newly formed inefficiencies or how aggressively one side dominates the environment. (the concept of momentum) In price discovery, you’ll often see a phenomenon known as “liquidity vacuum.” Since there are no resting orders above (in an uptrend) or below (in a downtrend), price can accelerate with little friction. This is where many retail traders get caught trying to fade the move, thinking it’s “overextended,” while in reality, the lack of opposing liquidity is precisely what fuels the expansion. It’s important to internalize that in this phase, price is not “wrong.” It's not "too high" or "too low." It is simply finding out where the next significant opposition lies. Your role isn’t to guess where that might be based on a static chart, it’s to react to how price behaves as it moves, especially as it begins to slow or generate distribution behaviors. The core of my methodology in price discovery is adaptability. "Ok mate, but how do you determine an ideal level where the price can stop, just to have a reference?" In this example I utilized the macro extensions picking the low that generated the HTF impulse till May high (that impulse broke previous internal structure and was followed by shallow pullbacks, a clear sign of intent by SM) obtaining the 1.272 as first important level of reference and, as you can see, the price perfectly reacted giving me a first idea on a potential stop. I could have utilized the macro range using RH+RL and applying negative Fibs, but for these types of moves I prefer to select the HTF impulses. Then at this point I wait for the price to establish a clean range and I follow the guidelines that I wrote in the example below: This is what I personally do. I never chase a breakout nor I try to short a candle because "it has to retrace" since it hasn't. The key is never to control price, but to interpret it: being able to read the pace, the aggression, the absorption, and the structure as it forms. This allows me to align with the SM’s intent rather than fight momentum. Above all, discipline and flexibility are paramount. I let the market prove when it’s ready to slow, consolidate, or reverse, not before. This method lets me stay in sync with the flow of price discovery, exploiting opportunities, if presented.
ZERO IKA 🗡️ tweet mediaZERO IKA 🗡️ tweet mediaZERO IKA 🗡️ tweet media
English
20
37
381
18K