TheLineReport
131 posts

TheLineReport
@DaLineReport
The Line Report is an insights and information broker, covering sports betting markets across traditional sports books, sports exchanges and prediction markets.
New York, New York Sumali Ocak 2026
100 Sinusundan32 Mga Tagasunod

Liquidity Map — #Athletics vs #Braves
Moneyline
Braves side showing a downward ladder:
-135 → $2.9K
-137 → market
-139 → $5.1K
Liquidity increases as price moves lower, with the largest pocket at -139.
Clear magnet below the market.
Liquidity shows intention.
Absorption shows conviction. I

English
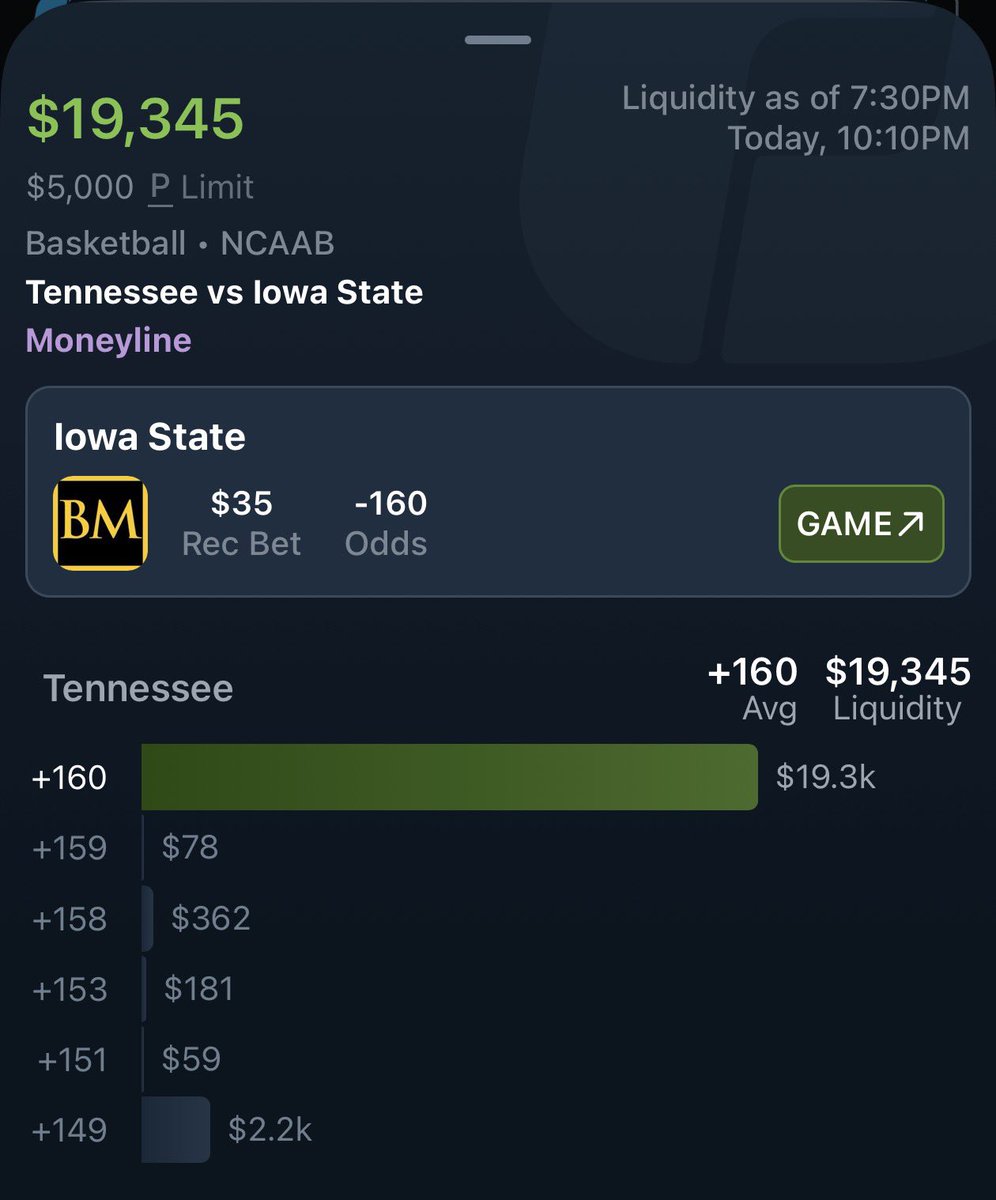
Liquidity Map — #Tennessee vs #IowaState Moneyline
This is a full concentration.
Tennessee:
+160 → $19.3K (entire market sitting here)
+149 → $2.2K
No ladder. No distribution.
This is a pin level at +160.
If it holds, price stays locked.
If it breaks, move likely comes quickly.
Liquidity shows intention.
Absorption shows conviction.
English
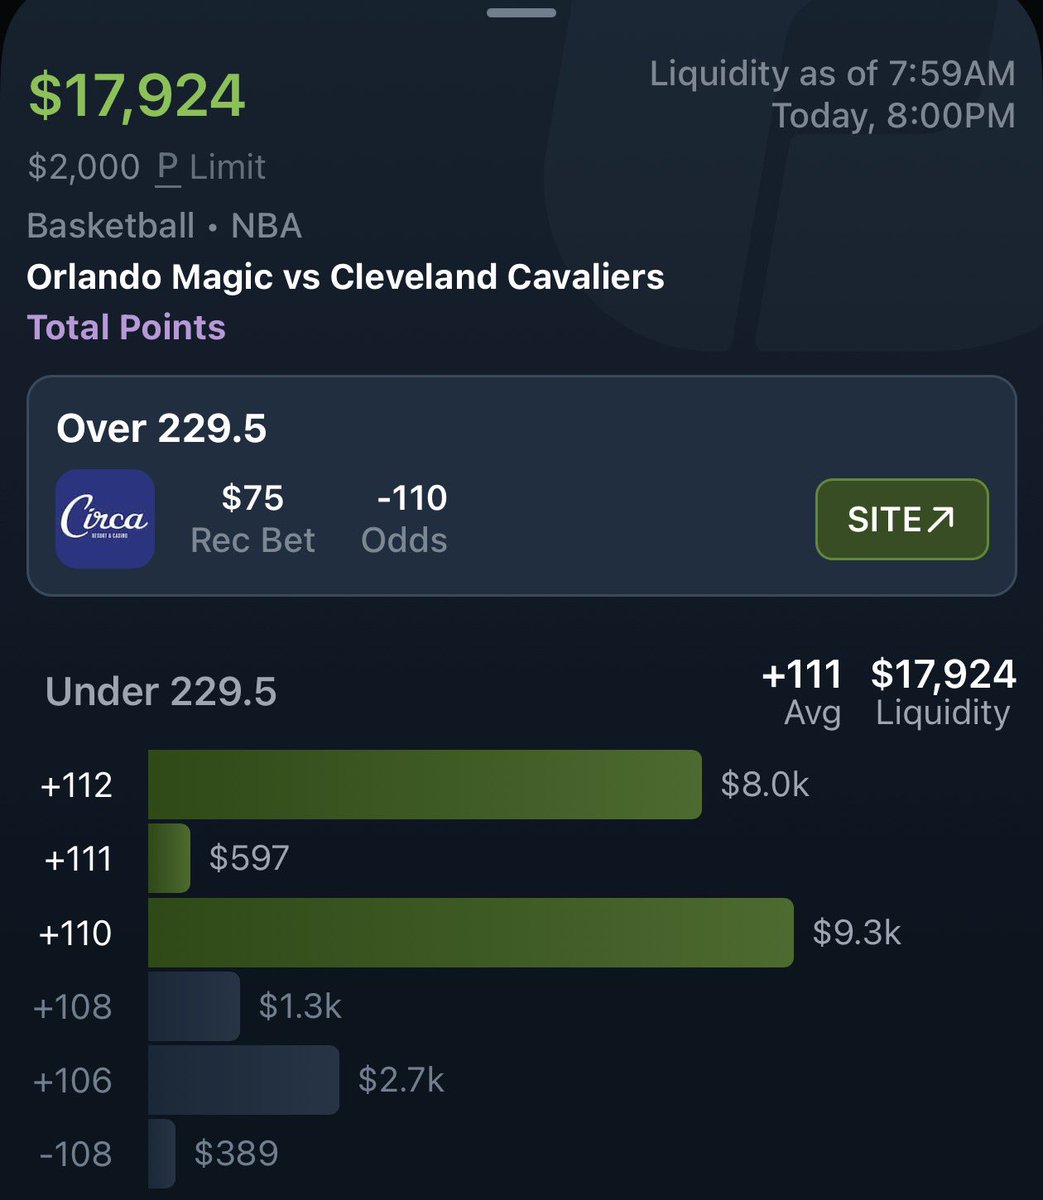
Liquidity Map — #Magic vs #Cavaliers
Total: 229.5
Under side showing a tight cluster:
+112 → $8.0K
+111 → market
+110 → $9.3K
Largest pocket sitting just below at +110.
Not a ladder — more of a contained range with a slight pull lower.
Liquidity shows intention.
Absorption shows conviction.
English


Who is the best college football comparison to Matt Painter?

English
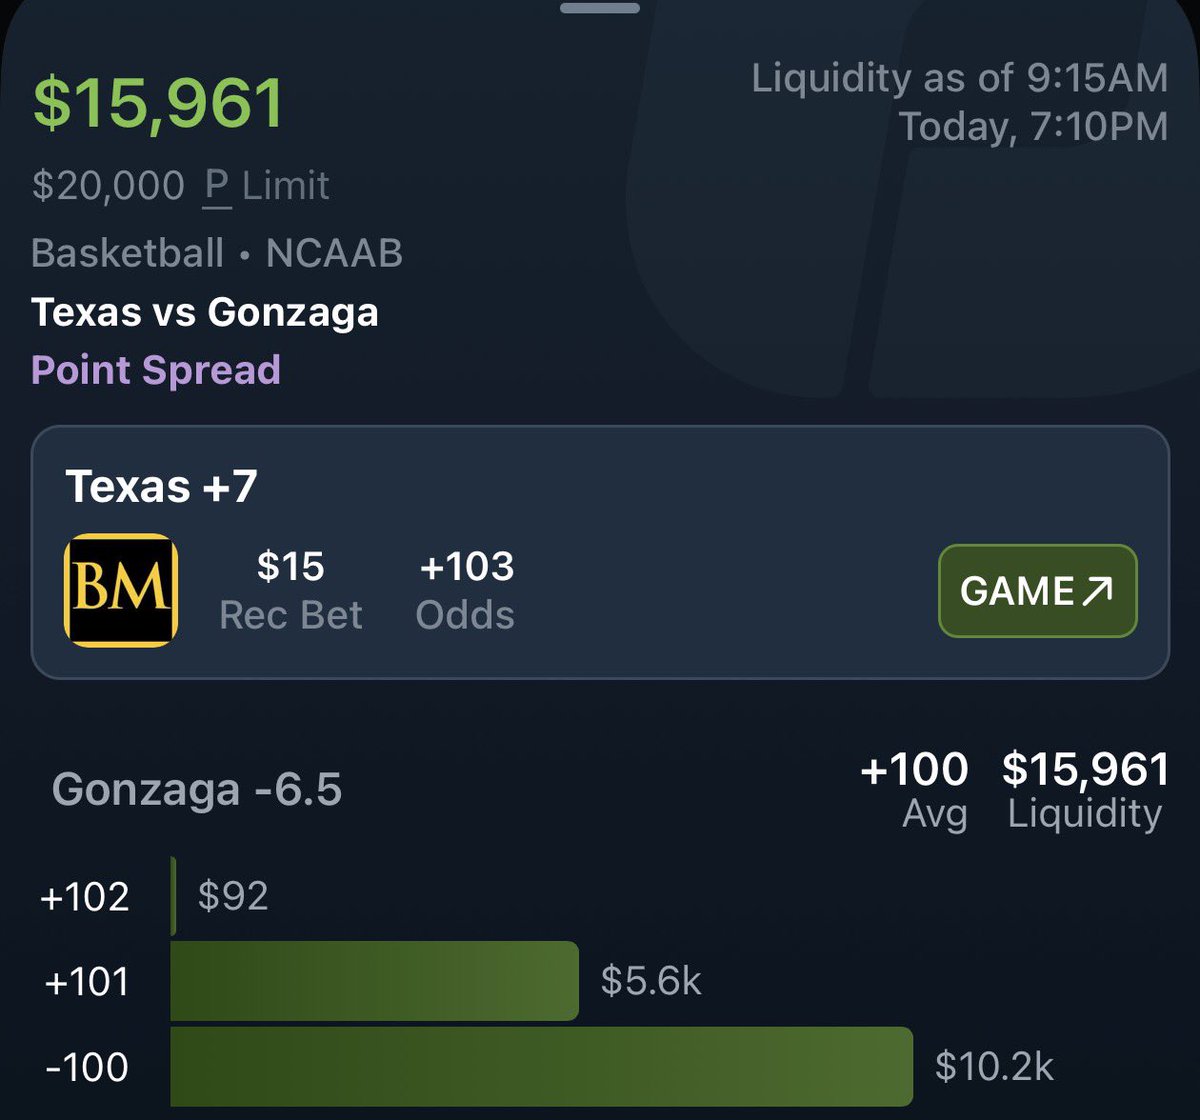
Liquidity Map — #Texas vs #Gonzaga
Spread: Texas +7 / Gonzaga -6.5
Tight market, two key levels:
-100 → $10.2K
+101 → $5.6K
Market sitting around +100
Largest liquidity anchored at -100 — that’s the level controlling price.
No ladder here — just a clear pivot.
Liquidity shows intention.
Absorption shows conviction.
English
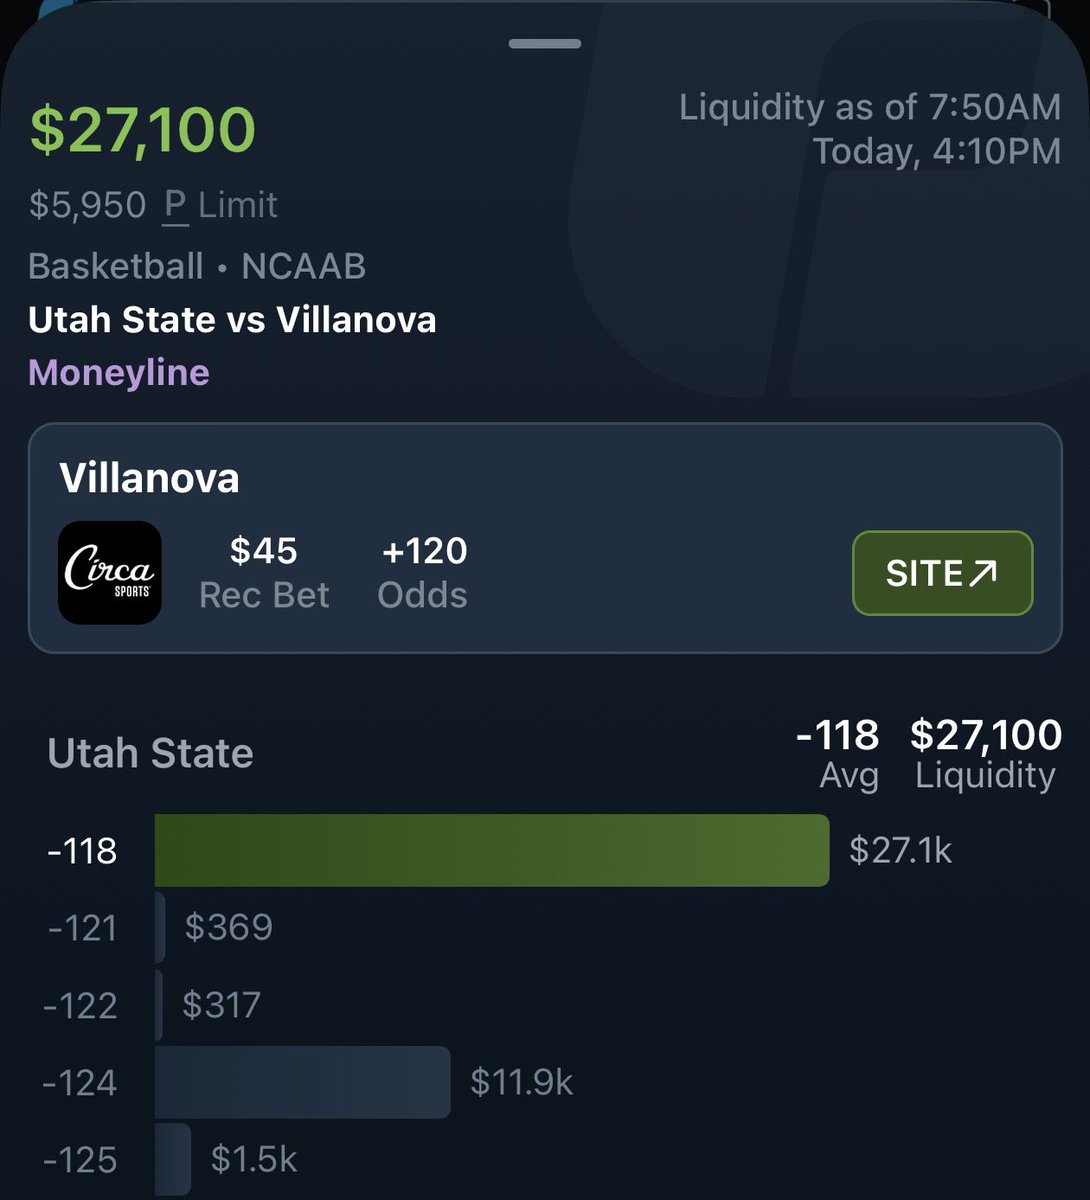
Liquidity Map — #UtahState vs #Villanova
Moneyline
This is a concentration, not a ladder.
Utah State:
-118 → $27.1K (entire market sitting here)
-124 → $11.9K
No real distribution — everything stacked at the current price.
This is a hold level, not a drift setup.
If -118 clears, next real pocket is lower.
If it holds, price stays pinned.
Liquidity shows intention.
Absorption shows conviction.
English
Liquidity Map — #HighPoint vs #Wisconsin
Spread: +10.5
High Point side showing a clear pocket below the market:
-104 → $5.1K
-106 → market
-107 → $7.8K
Largest liquidity sitting at -107, just below the current price.
If the market moves, that’s the next key level.
Liquidity shows intention.
Absorption shows conviction.

English

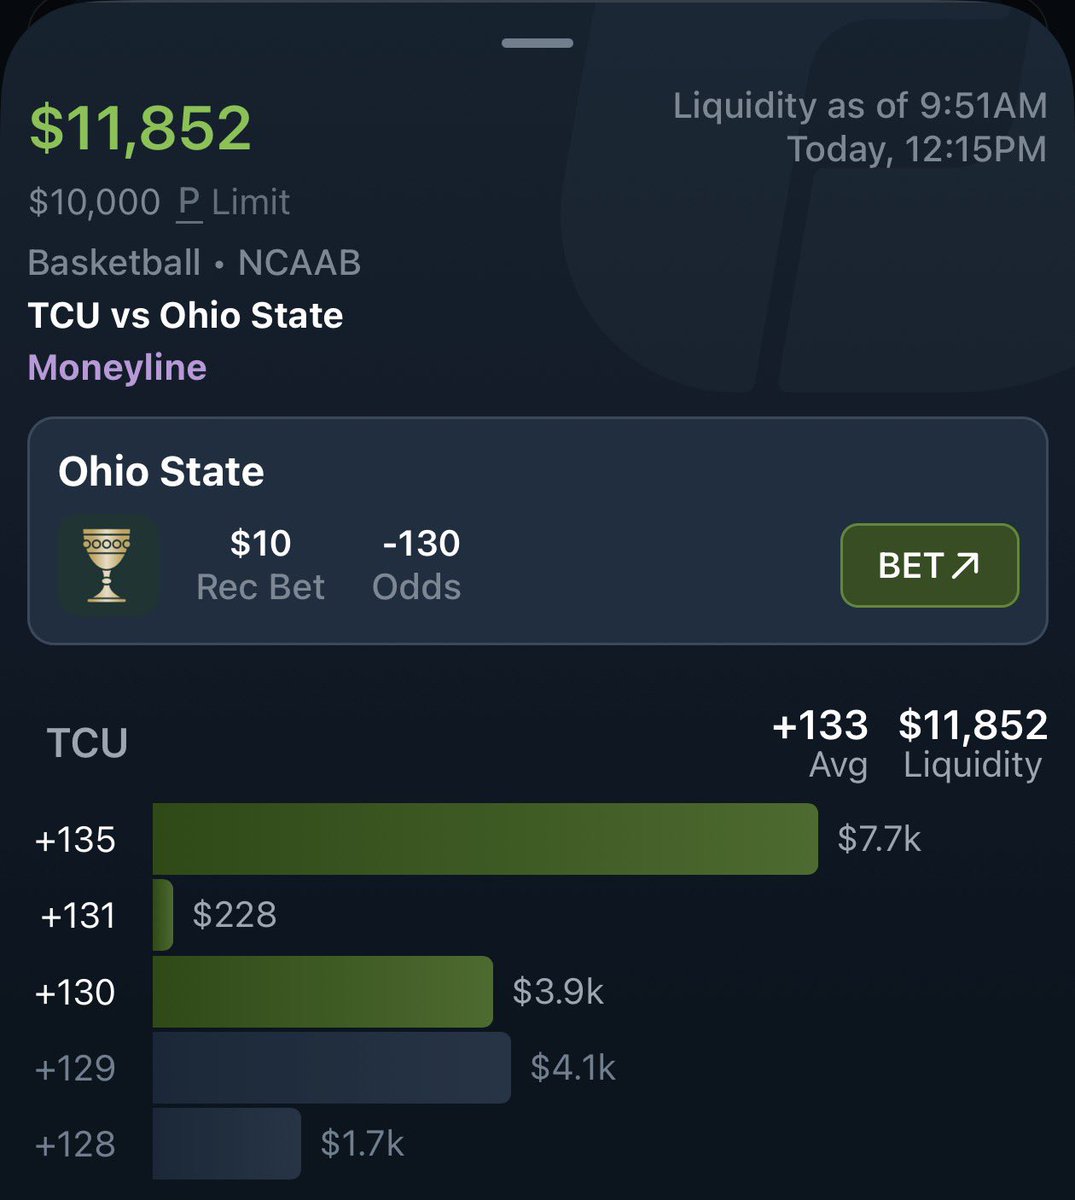
Liquidity Map — #TCU vs #OhioState (ML)
TCU side showing top-heavy liquidity:
+130 → $3.9K
+133 → market
+135 → $7.7K
Largest pocket sitting at +135, above the current price.
If the market pushes higher, that level becomes the key test.
Liquidity shows intention.
Absorption shows conviction.
English
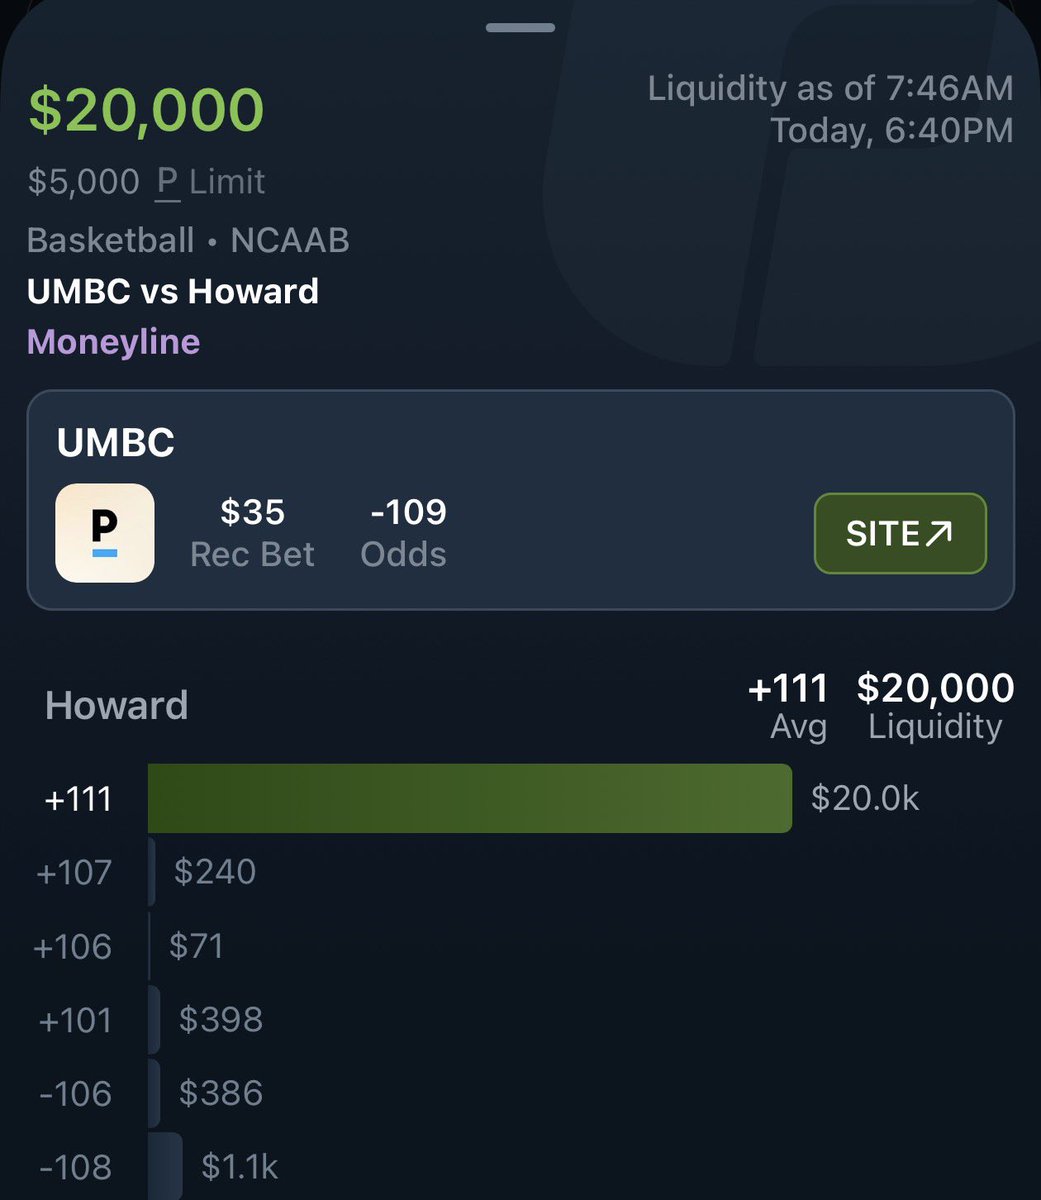
@bama_girl__ great question. The map is showing that sharp bettors have already backed UMBC, leaving a huge pool of liquidity (available bets) on Howard on Sports Exchanges (like Kalshi, Novig, ProphetX, Polymarket)
English

Liquidity Map — #UMBC vs #Howard (ML)
Howard side showing extreme concentration:
+111 → $20.0K
Total market liquidity: $20.0K
The entire book is sitting at a single price.
That level becomes the market.
Liquidity shows intention.
Absorption shows conviction.
#MarchMadness
English
Liquidity Map — #Suns vs #Celtics
Total: 214.5
Under side showing the most liquidity:
Under 214.5 (-100) → $9.5K
Under 214.5 (+101) → $4.8K
Total market liquidity: $14.2K
Largest pocket sitting directly on the Under, making that the key level for this total.
Liquidity shows intention.
Absorption shows conviction.

English
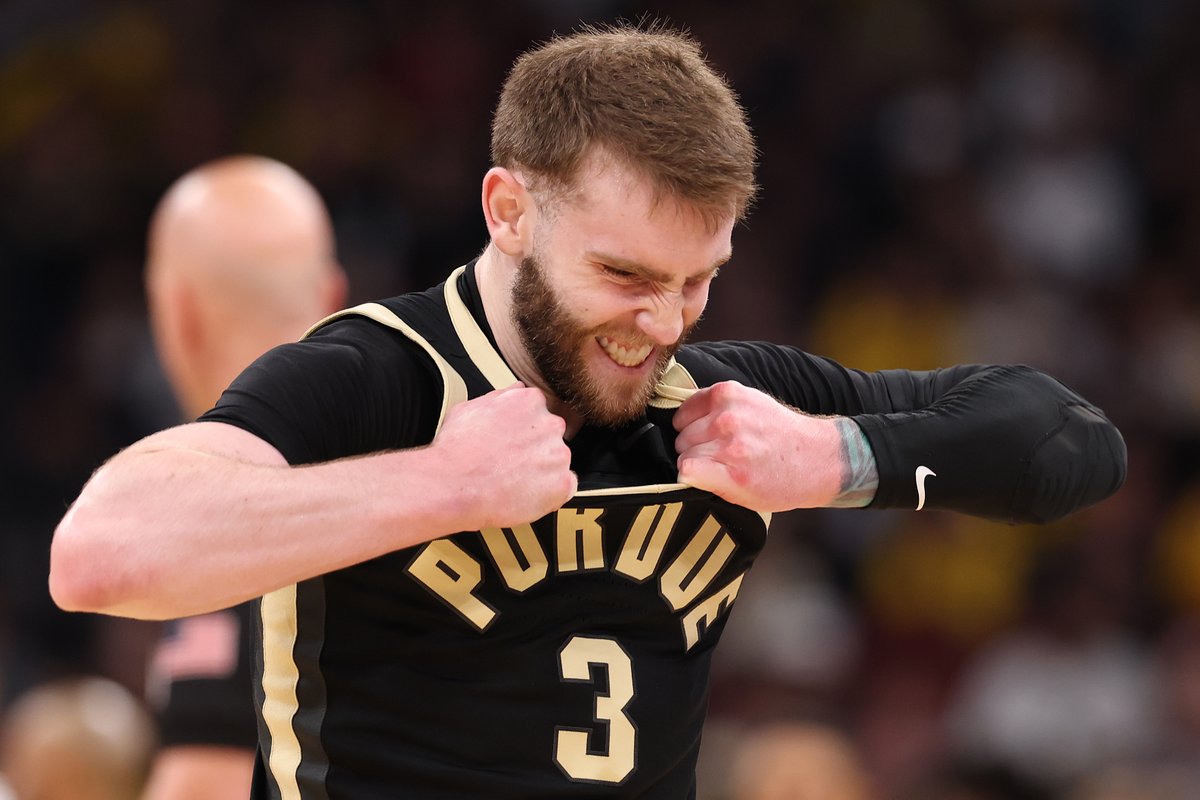
@CBBonFOX unfortunately for him, he cannot rip that tattoo off.
English

Braden Smith ripped his jersey during the first half of the Big Ten Tournament championship 😳


English
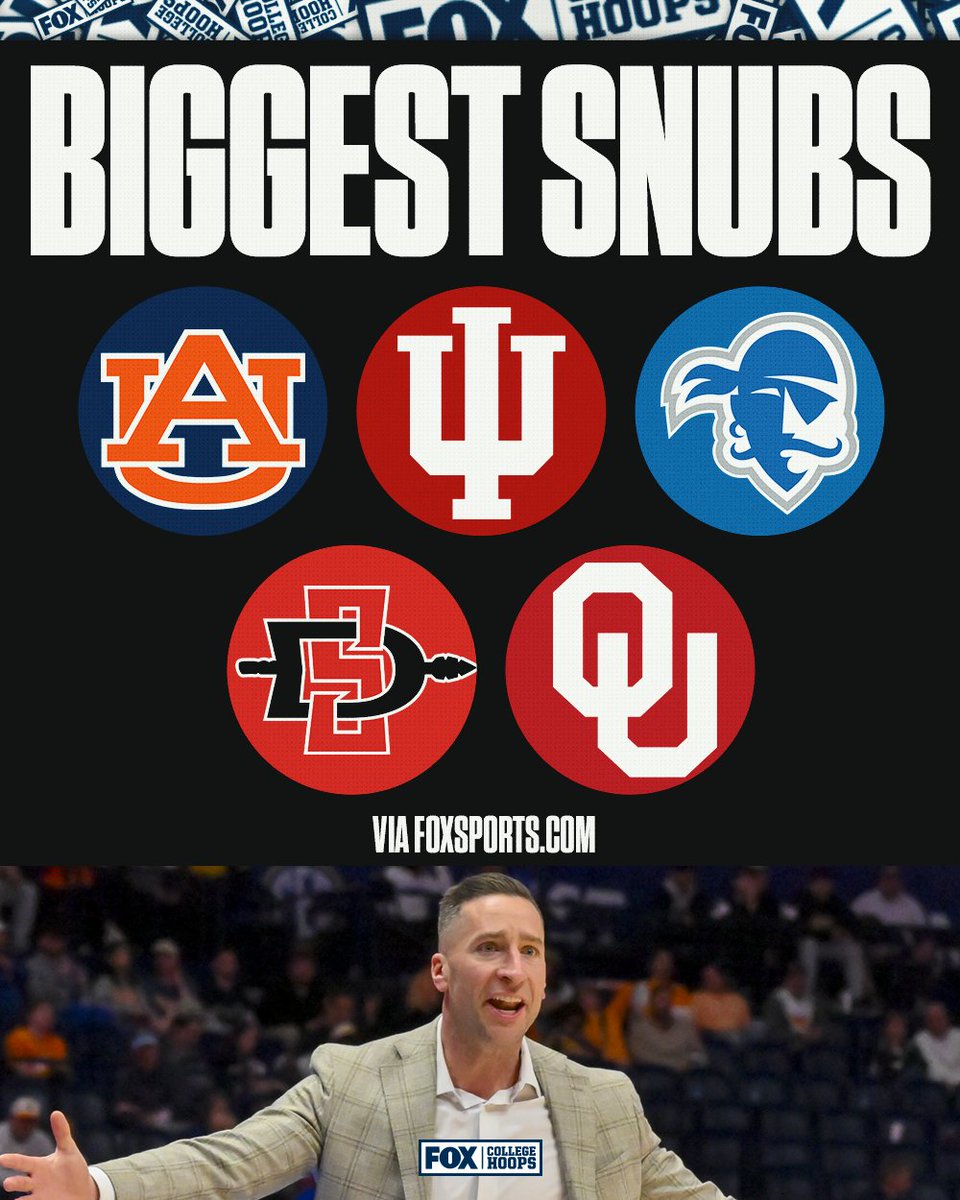
These are the FIVE biggest snubs from the NCAA Men’s Tournament.
Which team was the most deserving of a spot? 🤔
English
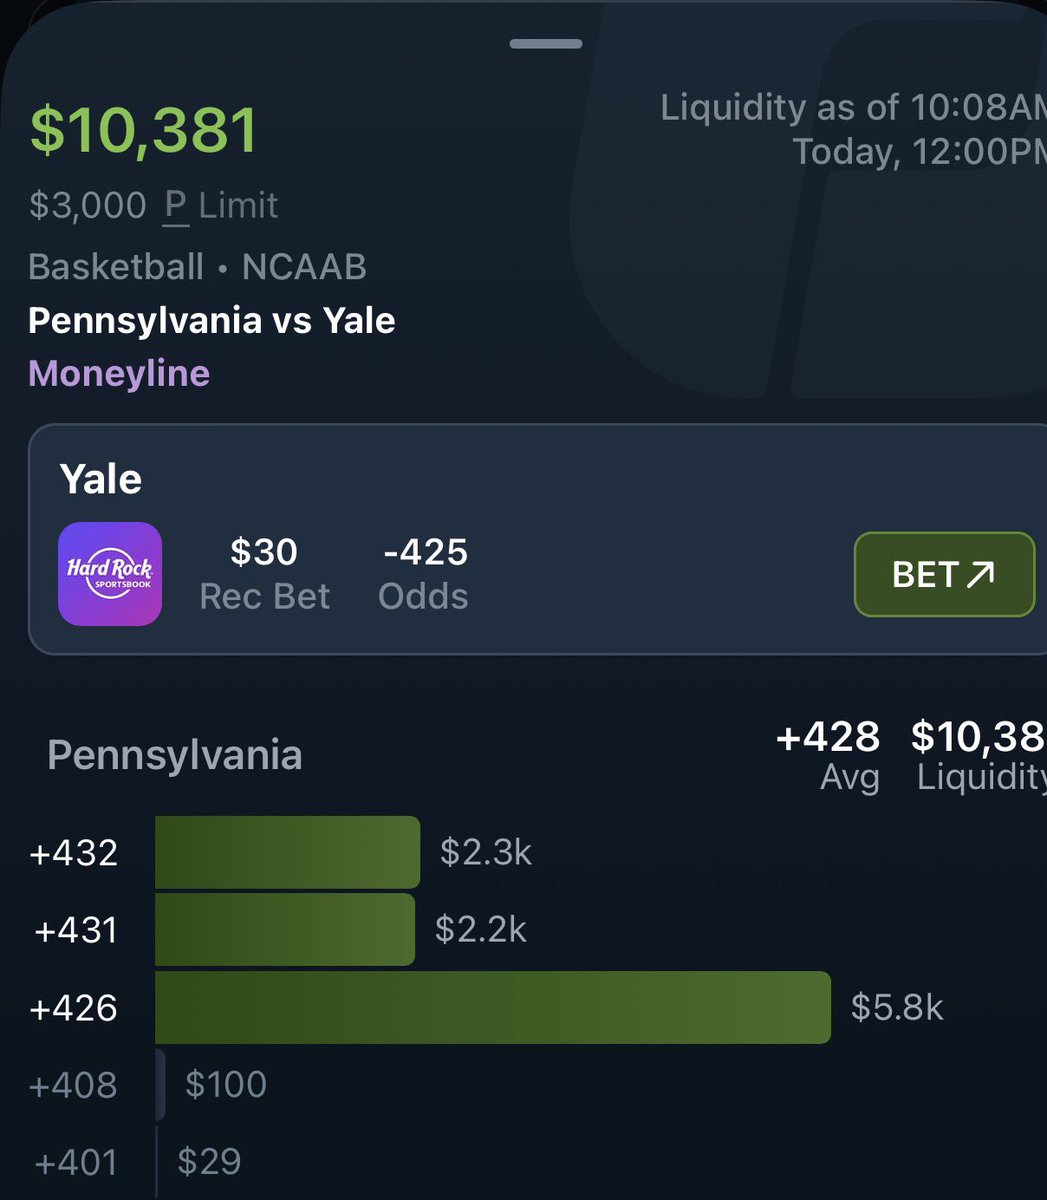
Penn ML showing liquidity concentration near the market:
Largest pocket → +426 ($5.8K)
Market → ~ +428
When liquidity clusters like this, price discovery often happens right around that level until a side gets absorbed.
English
Liquidity Map — #Penn vs #Yale (ML)
Pennsylvania side showing clustered liquidity:
+426 → $5.8K
+431 → $2.2K
+432 → $2.3K
Current market ~ +428
Largest pocket sitting at +426, making this the key level where the market is comfortable doing size.
Liquidity shows intention.
Absorption shows conviction.
English
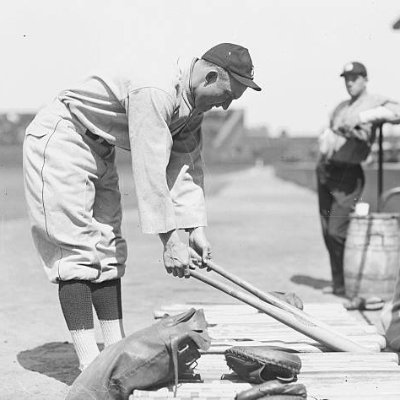
First player to come to mind when seeing this logo
English