Naka-pin na Tweet

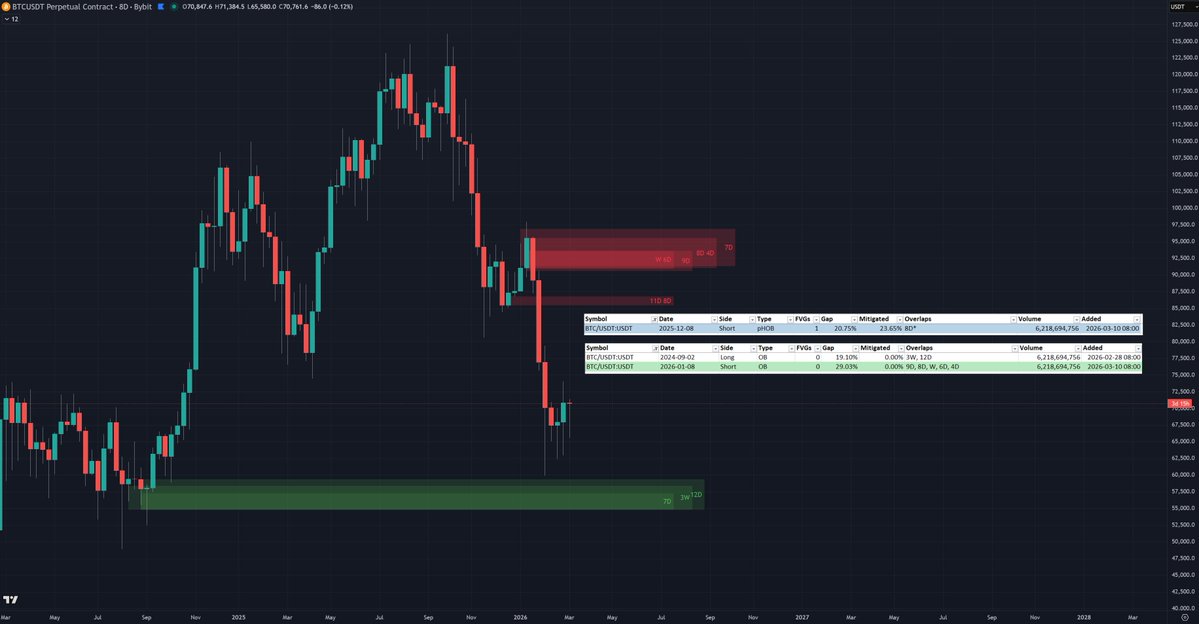
⚙️ The Liquidity Scanner automates OB / HOB scans across many perp pairs, timeframes and exchanges.
📄 It applies a fixed rule set and outputs structured Excel files with pre-filtered liquidity blocks.
English
Liquidity Scanner
84 posts

@LiquidityScan_
⚙️ Automated OB / HOB scans 🎯 Built for the Moneytaur trading community ⏱️ On-demand scans via Telegram 📄 Docs & access via Telegram No trading advice

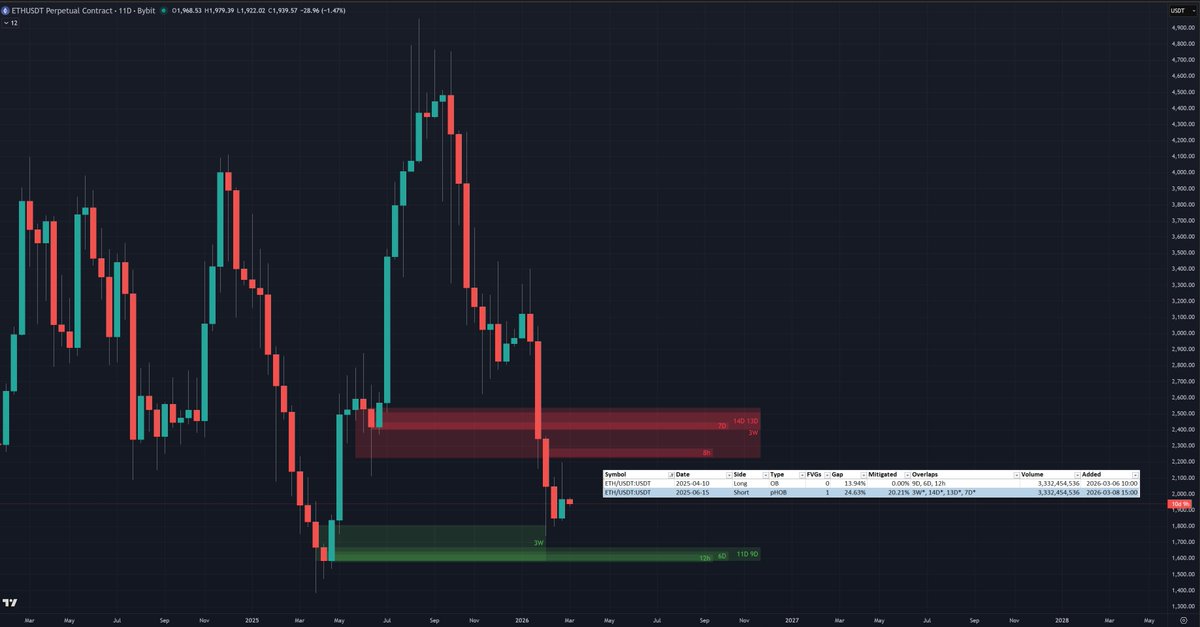
📊 ETHUSDT on Bybit price is trading between a fresh, refined HTF demand and a partially mitigated supply HOB. These are exactly the HTF blocks and overlaps automatically identified by Liquidity Scanner from a 27-timeframe scan.


Dear Moneytaur traders, you just found your new secret weapon... Have you ever spent hours charting various coins, only to realize there's no actionable OBs in the bunch? Have you ever wished there was some kinda tool that automates the "screening" process and just somehow delivers you a map of ALL the relevant/nearby OBs from HUNDREDS of charts to your door at the click of a button? If so then you'll seriously wanna check this out... WHAT IS IT: - It's a tool that generates a spreadsheet on command, which contains lists of nearby OBs (yes and HOBs) across multiple coins of an ENTIRE exchange, across MULTIPLE TIMEFRAMES. - The tool is essentially a FILTER, it shows only the relevant OBs that withstood a rigorous filtration process. E.g. Only OBs within 20% of current price, coins must be over a certain volume amount, OB candle bodies must not be under a certain size, stuff like that (see website for details). It delivers only the very finest. - Then you can filter the actual spreadsheet yourself. Maybe you'll choose to only chart the HOBs instead of just the OBs. Or maybe you'll only chart the OBs with 0% mitigation. But you wanna hear the REAL game changer? It also shows you if an OB has OVERLAPPING OBs from OTHER TIMEFRAMES. 🔥🔥🔥 This thing is the king for finding A+ setups quickly. I'll show you my workflow in the comments. SO WHAT DOES THIS MEAN 4 ME: - It means that you only have to focus on JUST CHARTING. It will feed you the LOCATION of the various relevant OBs, but it's still up to you to assess MS context, find confluence with fibs etc, read PA, and execute. - If you're a serious trader, this thing will not only save you tons of time, but brain power too. Everybody's brain has only so many "micro decisions" they can make per day, and this tool reduces those so you can focus on what matters: charting / execution / management. - Minimize decision fatigue. Maximize time. I SAID WHAT IS IT: It's called the Liquidity Scanner - @LiquidityScan_ Essentially the main design principle is that showing you the nearby OBs allows you to act on it soon after charting it, while it's still fresh in mind. - Site: liquidity-scanner.gitbook.io/liquidity-scan… - TG bot: t.co/mJ6uVSVGXW WHAT'S THE CATCH: - It takes 10-60 mins for the spreadsheet to generate (depending on how many timeframes you choose) - It costs money (it's for serious traders only) - It just filters the relevant OBs for you, you still have to actually chart it up, find confluence etc - Once you use it you wont be able to live without it- Warning! WHY ARE YOU SHOWING ME THIS: Straight up: because i want the dev to get more subscribers so he keeps the tool running lol. It's THAT fkn useful. That's my bias. But what that should tell you is this: I value this tool enough to put effort into this post even though i don't get money out of it. This thing is seriously handy. I've been feeding feature requests to Simon for almost a year and he has been very receptive, he adds suggested features quicker than you can say "liquidity scanner". The thing has steadily improved every month, and he still has more improvements in mind for the future. But here's the thing guys, right now this thing apparently has only 5 regular daily users, so this is still a very hidden edge. Whoever signs up after reading this will be among a small group of smart cookies. I don't get any kickback by the way, i just want the lights to stay on. ENOUGH TALK SHOW ME: See comments for workflow... 🧵