
Picte
1.5K posts

Picte nag-retweet

Picte nag-retweet

The Illusion of TA vs. The Harsh Reality of Quantitative Trading
Let’s explore a critical aspect of trading: the disparity between the illusions created by Technical Analysis (TA) and the often harsh reality of quantitative trading. It’s time to break down most common illusions and examine why these two approaches yield such different outcomes.
The Allure of TA
TA tools like RSI, MACD, moving averages, chart patterns and suport/resistance trendlines are popular for their simplicity. Traders can easily spot patterns, which creates the illusion that success is just about recognising and acting on these signals. This approach makes trading feel intuitive and straightforward, leading to a sense of control over market movements.
False Sense of Control
The allure of TA can breed overconfidence. The belief that one can "time" entries and exits based on historical patterns can be misleading. This false sense of control often leads traders to believe that mastering TA is the key to consistent profits.
Ignoring Market Complexity
However, what TA often overlooks is the inherent complexity of financial markets. Price movements are influenced by a great sum of factors, including economic data, geopolitical events, and market sentiment. By focusing solely on price patterns, TA reduces this complexity and creates an incomplete picture of market dynamics.
Market Inefficiencies
Moreover, TA fails to identify true market inefficiencies/price discrepancies that could be exploited for profit. These inefficiencies often arise from irrational behaviour among market participants. Unfortunately, TA indicators lack rigorous statistical validation, they’re more akin to educated guesses than thorough analyses.
Chasing Illusions
Traders using TA often fall into the pattern-chasing trap. What one trader interprets as a bullish signal, another may see as bearish. This subjectivity can lead to inconsistent decision-making and, ultimately, poor trading outcomes. Traders may also succumb to confirmation bias, only recognising patterns that reinforce their beliefs while ignoring contrary evidence.
Quantitative Indicators: Rigorous but Rare
In contrast, quantitative indicators aim to incorporate statistical rigour into trading. These methods also analyse historical data and employ sophisticated models and statistical tests to identify true market edges. Truly rigorous quantitative tools are very rare in the trading space and that goes double for the retail space.
Understanding True Inefficiencies
True market inefficiencies, like persistent mispricings due to behavioural biases or market constraints, can occasionally be quantified and exploited through quantitative tools. Yet, these inefficiencies are typically rare and fleeting, often eroding quickly as more participants leverage similar strategies.
Exposing Limitations
Quantitative trading reveals the complexity and randomness of financial markets. Unlike the perceived certainty of TA, the reality of quantitative models often uncovers the limitations of previously identified edges. Many backtests of strategies lack statistical rigour and validity. For instance, a strategy that appears profitable in backtesting might only succeed because it fits historical data too closely. This is known as overfitting.
Example: Imagine a trading strategy that has you buying based solely on a moving average crossover in a trending market. The backtest shows impressive profits over the past decade, but it was designed to account for that specific market condition. When market conditions shift or enter a sideways range, the strategy may perform poorly, exposing its limited applicability. Without proper statistical validation methods such as cross-validation or out-of-sample testing, traders may be misled into believing the strategy is robust when it's only a product of the specific dataset used.
Usually, when TA tools are combined with a quantitative approach, the illusion quickly falls apart. Quantitative tools are often not the most attractive to traders, as they paint the market picture in the most realistic way. And the reality of the markets is often disappointing for those who see it as an escape or an easy way to financial freedom!
The key point you should take away from this thread is not necessarily that TA indicators don't tell you anything useful about the market. Some might...sometimes... rarely...almost never😁. The key point is that they do not offer or help you identify a market edge in the form of an inefficiency/mispricing.

English

@DrNo1111 @nomamesgwei @MetropolisDEX @SonicLabs bruh, opened x again today just to call people retards tbh
English

@nomamesgwei just delete this post before further embarrassing yourself. @MetropolisDEX is still on sonic and team always said in dc there will be no migration despite community constantly asking them to do so. spread FUD about @SonicLabs all you want but don't throw shades at legit projects.
English
@HankiSpank True maybe luxury would be a better word. Our data has been a commodity for a good while already anyway
English

The more I reflect on this cycle the more I get the feeling the trojan horse has entered the Bitcoin eco and is taking over.
Month by month I only see $BTC being transferred from retail to Black Rock etc.
Month by month the powers $BTC was meant to counter, are taking it over.
English
Crypto has 2 possible futures.
A) separation from government and government organizations to control money.
B) Full surveillance tech to see every transaction of every person and to apply maximum possible control over them.
Right now it seems we are heading towards scenario B
English
Picte nag-retweet

@MetropolisDEX @SonicLabs I know sonic peeps know the ask side very well, but please show them the bid side next time as well. I would really need them to start using it at this point
English
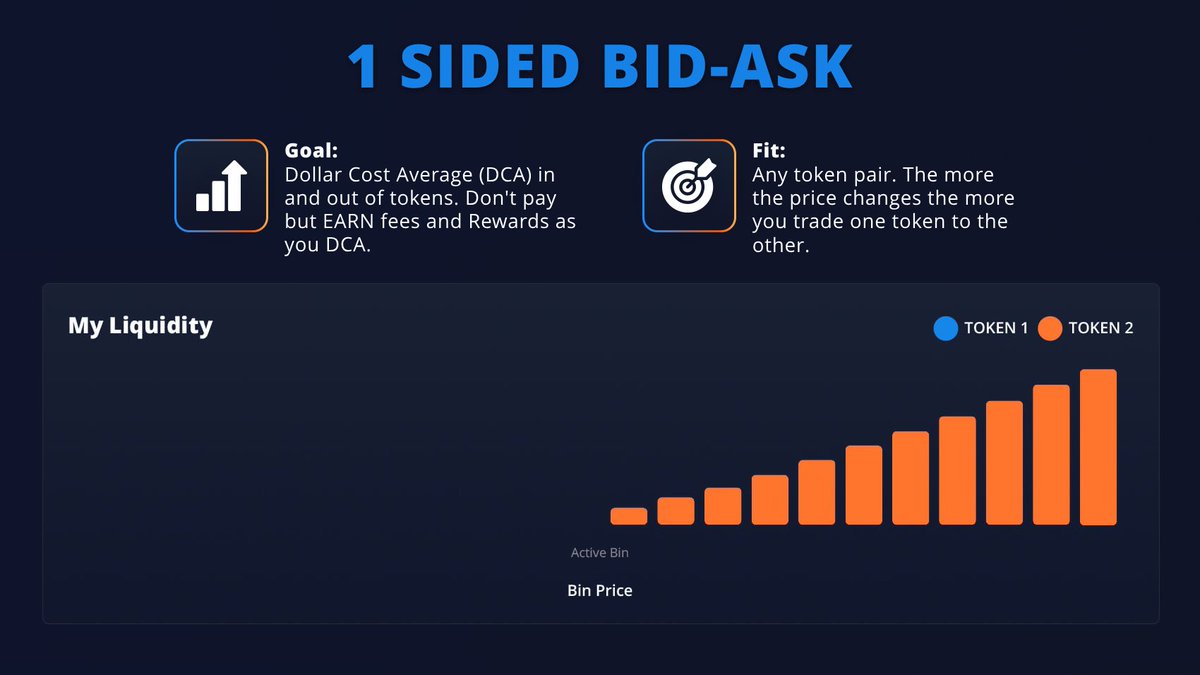
One-sided Bid-Ask is still the best way to DCA in and out of tokens.
➡️ no leverage
➡️ no liquidation risk
➡️ no slippage
➡️ no fees
➡️ full control
Only on Metropolis on @SonicLabs.
English


@MetropolisDEX @dr_tangle Oh my almost forgot about the competition already! I appreciate the $metro and i will continue striving to be among the best in the game.
Through the dumplings and the pumplings!!
Lets fucking metrooo!!!
English
Picte nag-retweet
🏆 Maker Vault Arena Champions Announced! 🏆
Over the past 30 days, 7 curators battled across 3 pools - navigating one of the toughest markets yet.
A huge congratulations to our winners:
🏅 S–USDC → @_picte
85.44% Real APR (+7.12% vs market)
🏅 S–ETH → @dr_tangle
112.68% Real APR (+9.39% vs market)
🏅 USDC–ETH → @DigitalSoulx
73.20% Real APR (+6.1% vs market)
Each winner takes home 1,000 $METRO 🎉
And special kudos to Dr. Tangle, who was crowned the overall champion by achieving the highest profit, earning himself a METRONIX NFT!
A big THANK YOU to every curator who joined the Arena and every community member who supported them. Check out each of their strategies, they are all beating the market!

English


I want to put my first METRONIX NFT(@MetropolisDEX ) up for sale and get $METRO tokens for the number of $Sonics $S sold. What price do you suggest?

English