Analytics

4.6K posts

Analytics banner
Analytics

Analytics

@analytics777a

Daily technical analysis on Gold, Silver, Crude, Indices & Some FX pairs | Pure chart breakdowns | Educational only | Not financial advice

Sumali Şubat 2022
11 Sinusundan1.6K Mga Tagasunod
Naka-pin na Tweet
Analytics
Analytics@analytics777a·
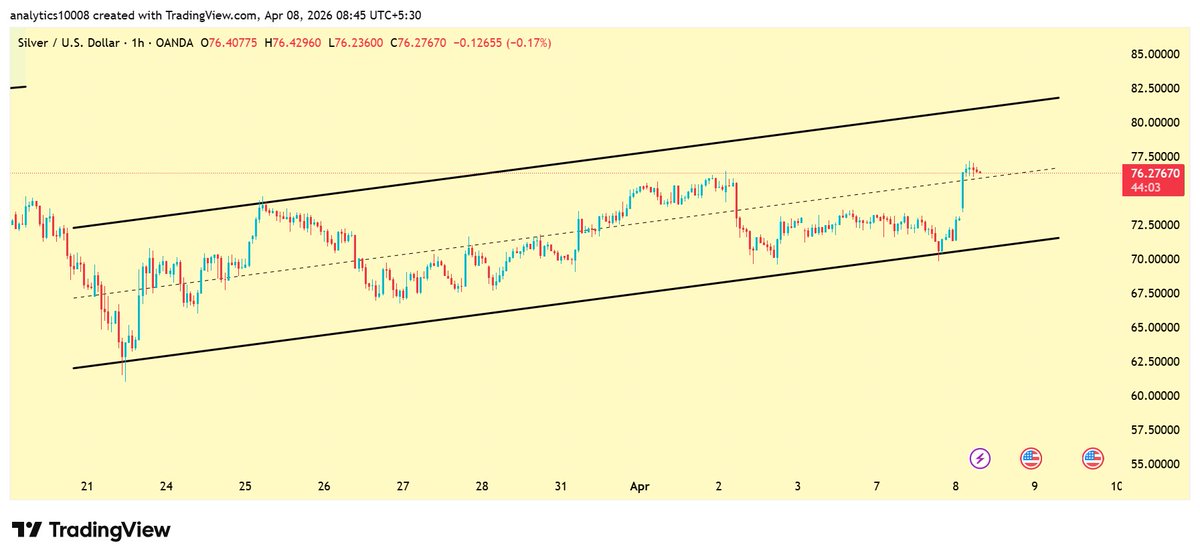
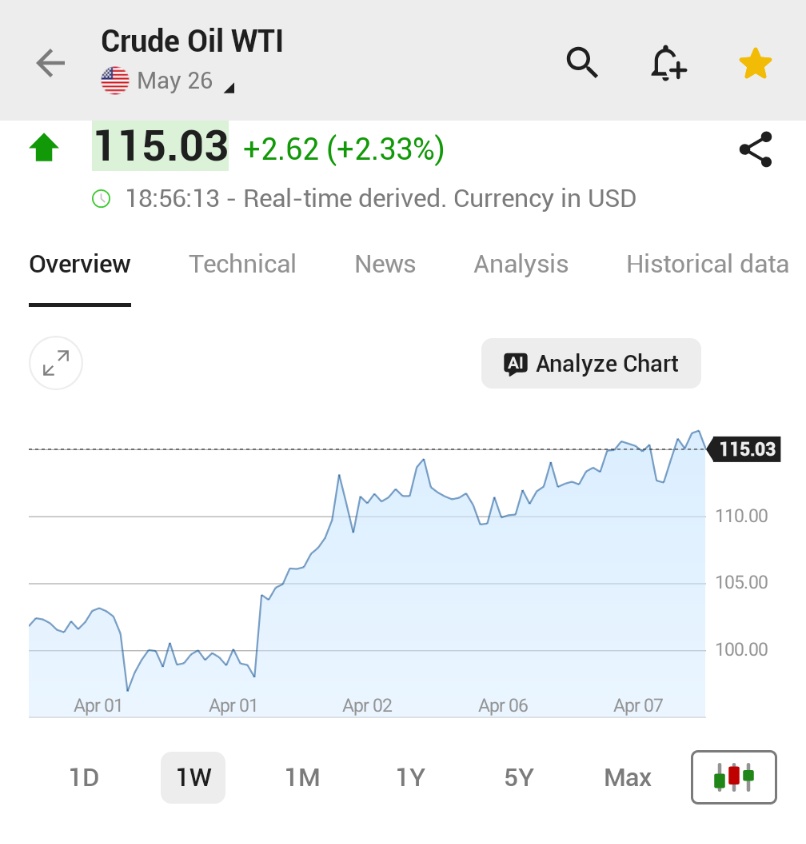
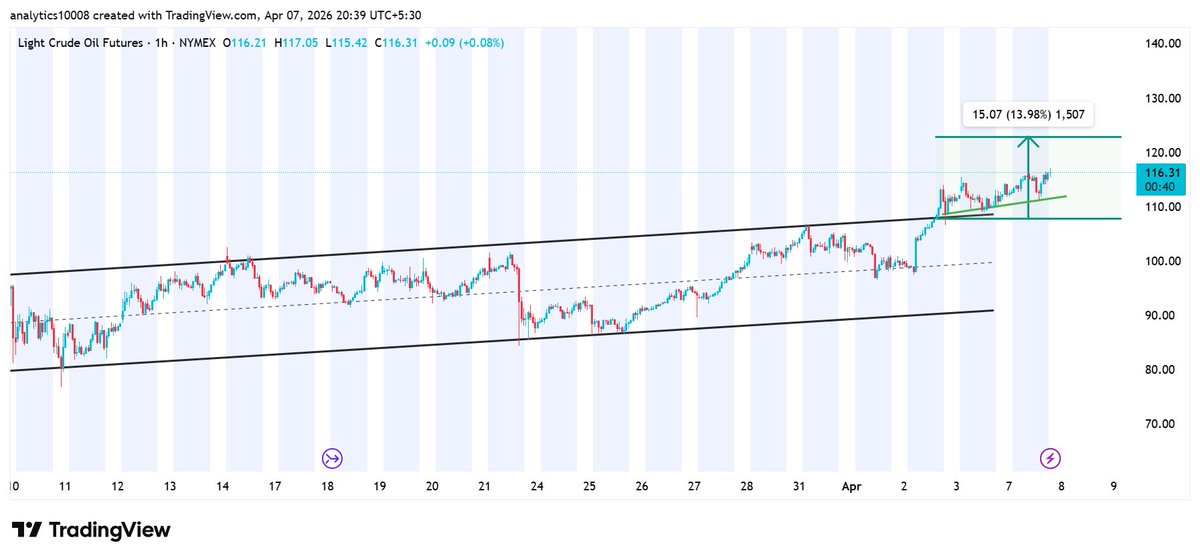
For gold,silver ,crude and forex pair t.me/analytics21 
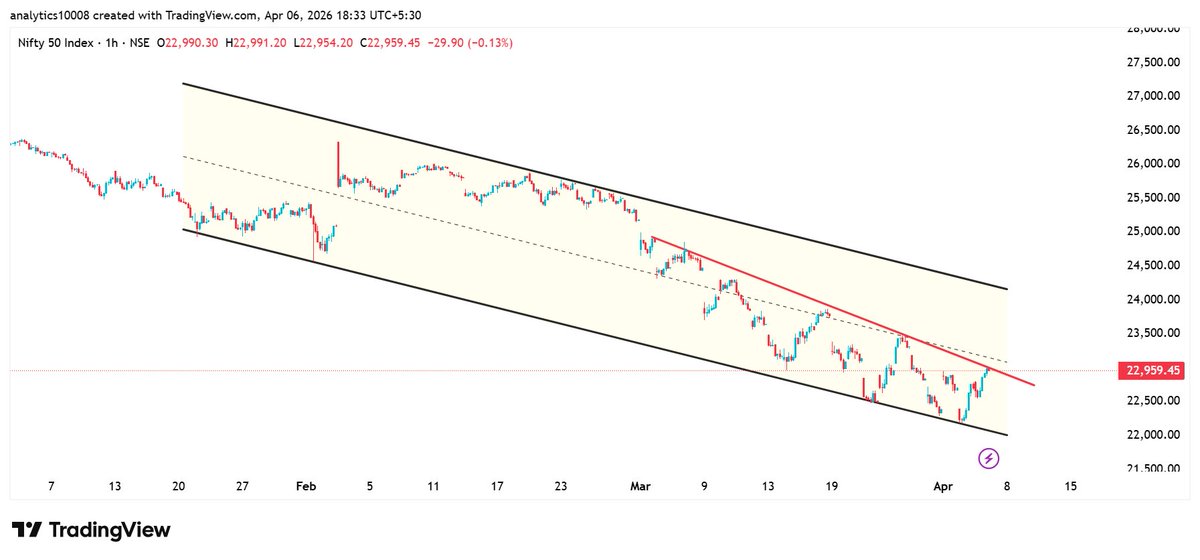
For Nifty and sensex t.me/analytics77 
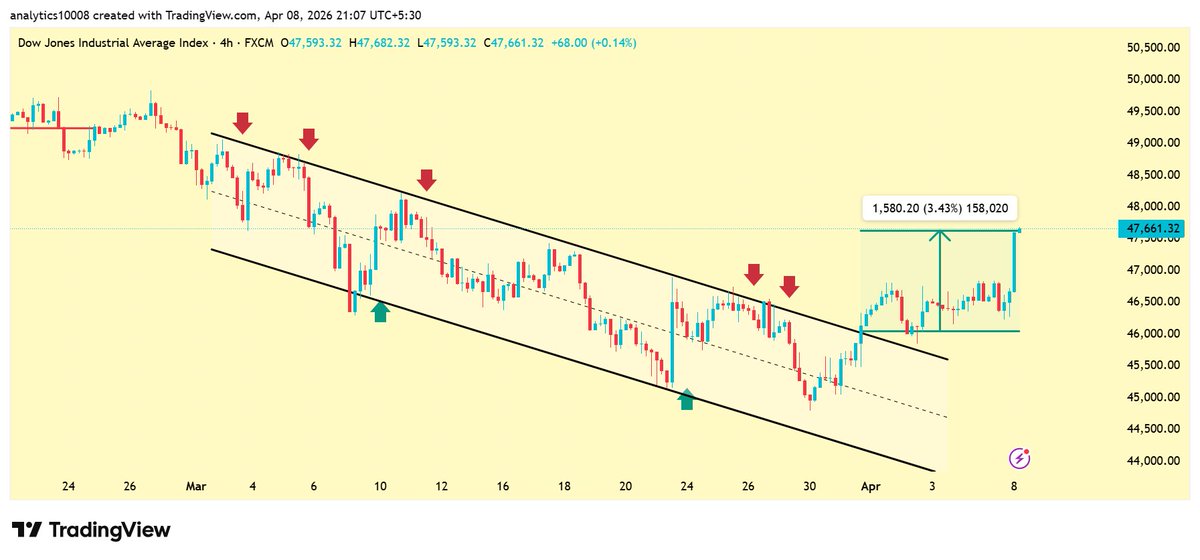
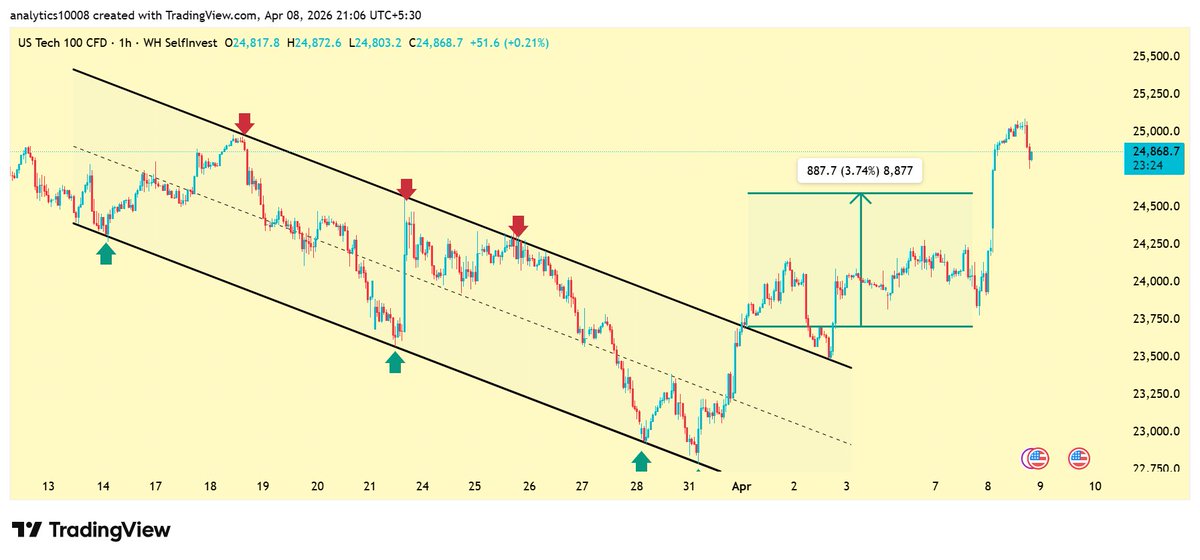
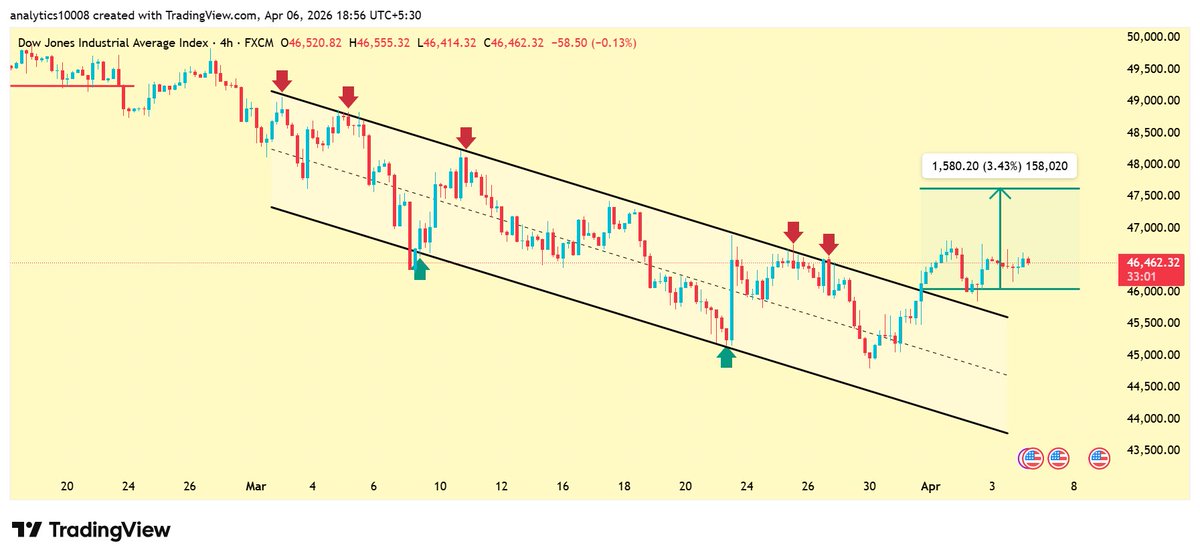
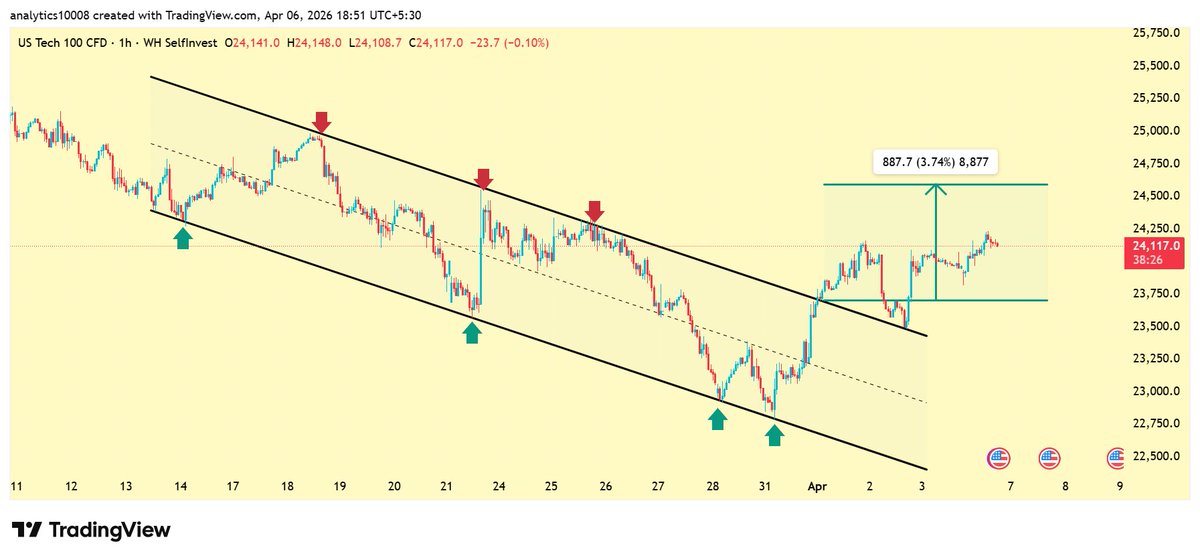
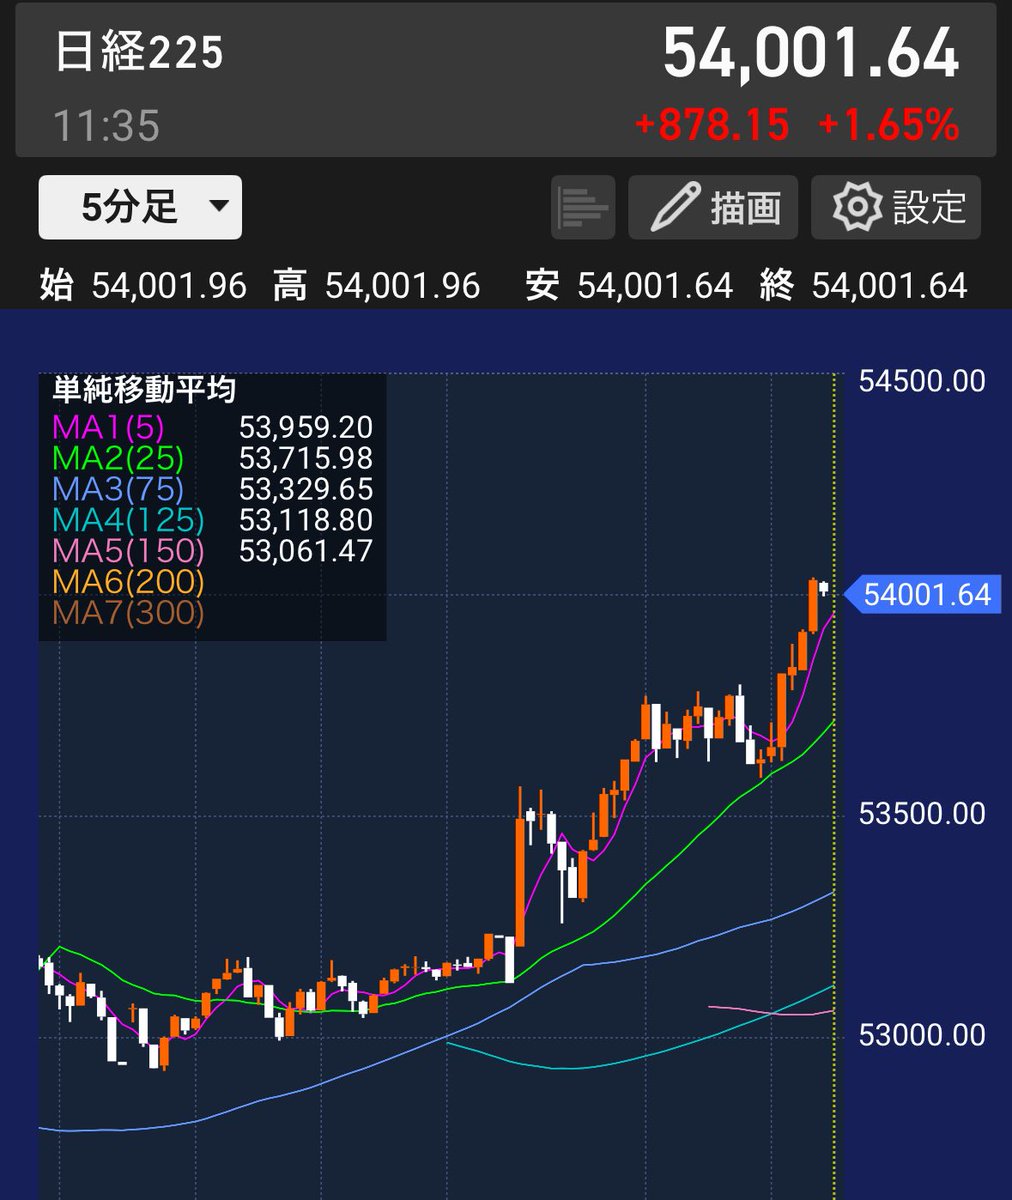
For other indices like Us30,Us500,Nasdaq and Nikkei 225 t.me/analytics16 Here i post short term chart and sometimes target oriented chart . This is completely free.
English
1
3
5
5.1K
Analytics
Analytics@analytics777a·
#DOWJONES #US30 As expected price moved up and hit the target .
Analytics tweet media
Analytics@analytics777a

#US30 #DOWJONES 4HR CHART After the breakout from the descending channel, the measured target has come into play. The price has backtested the support level from where it was breakout of channel and bounced back. The breakout point is now acting as a key support level. A sustained move above the upper trendline would validate further upside toward the measured target. A reversal back inside the channel would invalidate the bullish thesis

English
0
0
0
95
Analytics
Analytics@analytics777a·
#USTECH100 #NASDAQ 1HR CHART As expected , price moved up and hit the target .
Analytics tweet media
Analytics@analytics777a

#USTECH100 1HR CHART After the breakout from the descending channel, the measured target has come into play. The price has backtested the upper trendline of the channel and bounced back. The breakout point is now acting as a key support level. A sustained move above the upper trendline would validate further upside toward the measured target. A reversal back inside the channel would invalidate the bullish thesis.

English
0
0
0
85
Analytics
Analytics@analytics777a·
#SILVER #XAGUSD 1HR CHART The boundaries of the ascending channel have shifted slightly. Price is currently trading above the midline of the channel, which will now act as intermediate support. If price holds above the midline, it is likely to continue toward the upper trendline. However, if it fails to hold, it may decline back toward the lower trendline.
Analytics tweet media
Analytics@analytics777a

#XAGUSD #SILVER 1HR CHART Price has broken below the lower trendline of the channel and has now retraced back to the lower trendline boundary, where it is currently trading. If price re-enters the channel, expect a bounce toward the midline, which should act as intermediate resistance. Conversely, if price fails to reclaim the lower trendline and trades below it, further decline is likely.

English
0
1
1
330
zerohedge
zerohedge@zerohedge·
IRGC COMMANDER DECLARES ‘NEW PHASE’ OF REPRISAL ATTACKS AGAINST AGGRESSORS, WARNS THAT IF US CROSSES RED LINES, IRGC'S RESPONSE " WILL EXTEND FAR BEYOND THE REGION": PRESS TV
English
93
109
846
105.7K
zerohedge
zerohedge@zerohedge·
*BRENT OIL REVERSES GAINS TO TRADE BELOW $109 A BARREL
English
39
58
630
108.9K
Jesse Cohen
Jesse Cohen@JesseCohenInv·
WTI Oil rises to $115 as Trump's deadline looms. Will the situation resolve in TACO or FAFO?
Jesse Cohen tweet media
English
37
36
223
25.5K
The Kobeissi Letter
The Kobeissi Letter@KobeissiLetter·
BREAKING: President Trump provides an update on his 8 PM ET deadline for Iran tonight. President Trump says: 1. The US is preparing to carry out "heavy strikes" against Iran if his 8 PM deadline is not met tonight 2. If negotiations with Iran make progress today and something tangible emerges, the deadline could change 3. If the deadline ends without reaching an agreement with Iran, the US will "launch an attack the likes of which they have never seen" Meanwhile, Iran appears to have ended diplomatic discussions amid President Trump's threats. The deadline is now 8 hours away.
English
272
623
6.2K
1.1M
Analytics
Analytics@analytics777a·
#CRUDEOIL 1HR CHART As expected, the price is rising toward the target level slowly while holding the trendline marked on the chart.
Analytics tweet media
Analytics@analytics777a

#CRUDEOIL 1HR CHART Price has broken above the upper trendline-which was the major resistance of the channel. The previous resistance now acts as support. From this point, due to the breakout above the upper trendline, the measured target has come into play. As we can see, the price touched the upper trendline and bounced higher, confirming the support. However, if volume starts to decline as the price rises, the move may reverse before hitting the measured target. Furthermore, if the price closes back inside the channel, it indicates a "bull trap" or false breakout. This occurs when institutional sellers use the liquidity provided by breakout buyers to exit large positions.

English
0
1
2
873
The Kobeissi Letter
The Kobeissi Letter@KobeissiLetter·
PRESIDENT TRUMP ON IRAN: "The entire country could be taken out in one night, and that night might be tomorrow night."
English
379
472
3.5K
681.8K
Analytics
Analytics@analytics777a·
#US30 #DOWJONES 4HR CHART After the breakout from the descending channel, the measured target has come into play. The price has backtested the support level from where it was breakout of channel and bounced back. The breakout point is now acting as a key support level. A sustained move above the upper trendline would validate further upside toward the measured target. A reversal back inside the channel would invalidate the bullish thesis
Analytics tweet media
Analytics@analytics777a

#US30 #DOWJONES 4HR CHART After a breakout above the channel, the upper trendline, which previously acted as resistance, has now turned into support. The next move depends on this support level: If the price holds above the upper trendline, the breakout is likely to sustain, and further upside can be expected. If the price fails to hold and falls back inside the channel, it may indicate a fake breakout, with the price potentially declining toward the midline of the channel.

English
0
1
3
435
Analytics
Analytics@analytics777a·
#USTECH100 1HR CHART After the breakout from the descending channel, the measured target has come into play. The price has backtested the upper trendline of the channel and bounced back. The breakout point is now acting as a key support level. A sustained move above the upper trendline would validate further upside toward the measured target. A reversal back inside the channel would invalidate the bullish thesis.
Analytics tweet media
Analytics@analytics777a

#USTECH100 1HR CHART After a breakout above the channel, the upper trendline, which previously acted as resistance, has now turned into support. The next move depends on this support level: If the price holds above the upper trendline, the breakout is likely to sustain, and further upside can be expected. If the price fails to hold and falls back inside the channel, it may indicate a fake breakout, with the price potentially declining toward the midline of the channel.

English
0
1
2
1.2K
Analytics
Analytics@analytics777a·
#Nifty50 1HR CHART The price has reached the downtrendline, which is now acting as immediate resistance. The next hurdle is the midline of the channel, serving as additional resistance. If the price successfully clears both resistance levels, the upper trendline of the channel will come into play. Conversely, if the price gets rejected at the downtrendline, a decline toward the lower trendline is expected. #indianstocks #IndianStockMarket #nifty
Analytics tweet media
Analytics@analytics777a

#Nifty50 1HR CHART The price has been trading within a descending channel pattern. As I mentioned in my previous post, the lower trendline of the channel is acting as a major support level--and it has held perfectly. As soon as price touched the lower trendline, it bounced higher and is now moving toward the midline of the channel. The downtrendline is also continuing to cap the price, keeping it within the overall downtrend. The next intermediate upside resistance levels are therefore the downtrendline and the midline of the channel. Everything depends on how price reacts at these levels. If the price successfully clears both the midline of the channel and the downtrendline, the next movement would be toward the upper trendline of the channel. If price is rejected from these resistance levels, it is likely to head back toward the lower trendline. #Nifty #NIftyfifty #sensex #sharemarket #stockmarket #investing

English
1
1
3
8.6K
Analytics
Analytics@analytics777a·
What will be the low in the #Nifty before it makes its next new all-time high (ATH)?
English
2
0
0
255
Analytics
Analytics@analytics777a·
If possible ,write the reason ?
English
0
0
0
87
Analytics
Analytics@analytics777a·
@kei_toshi__ Agree with you ,if price able to clear the resistance level then only upside continuation
English
0
0
1
69
けい@高配当株投資家
日経54,000円台に回復してブラックマンデー回避。嬉しい気持ちもあるが強気で攻めていけない自分がいる。 この気持ちになっているの自分だけではないはず...? 一言で急落もありうる状況。
けい@高配当株投資家 tweet media
日本語
10
0
51
4.5K
ほたる
ほたる@grooooooomy·
前場お疲れ様でした。 日経平均54000円回復📈 この強さは本物ですか...信じたらまた下げますか...分からない...
ほたる tweet media
日本語
21
5
184
10.9K
なつ
なつ@kiseki_okoru·
なにこれ!!! どこまで下げんねん。 ほんと頭が痛い😣 辛すぎる。
なつ tweet media
日本語
106
38
416
101.3K
The Kobeissi Letter
The Kobeissi Letter@KobeissiLetter·
President Trump's "48 hour deadline" has just been extended to 82 hours for Iran: President Trump has now stated to multiple news outlets that he will "blow everything up" in Iran if they do not make a deal by Tuesday. However, the "48-hour deadline" for a deal, which he set on Saturday, expires on Monday at 10:05 AM ET. Now, Trump has made a post that states "Tuesday, 8:00 P.M. Eastern Time!" It appears that President Trump has shifted his deadline for US strikes on Iranian power plants for the 4th time.
English
652
1.2K
8.8K
1.2M