Charts First | Clarity Over Noise
Crypto • Stocks • FX • Commodities • Macro
No Promos. No Paid Posts. Everything shared 4 free.
Here to be useful.
INC|HEX FTW!
Let’s get into it.
One of the key signals I’ve been watching closely is the Copper to Gold Ratio.
And interestingly…
shortly after mentioning it here, I started seeing similar ideas show up across the space…
even from some of the bigger voices.
No need for credits.
If the right message is being spread, that’s all that matters.
---
Now, why does this even matter?
The Copper/Gold Ratio is a reflection of risk appetite.
* Copper → growth, expansion, risk
* Gold → safety, fear, protection
When copper starts to outperform gold,
it signals a shift toward a more risk-on environment.
---
And historically… this matters.
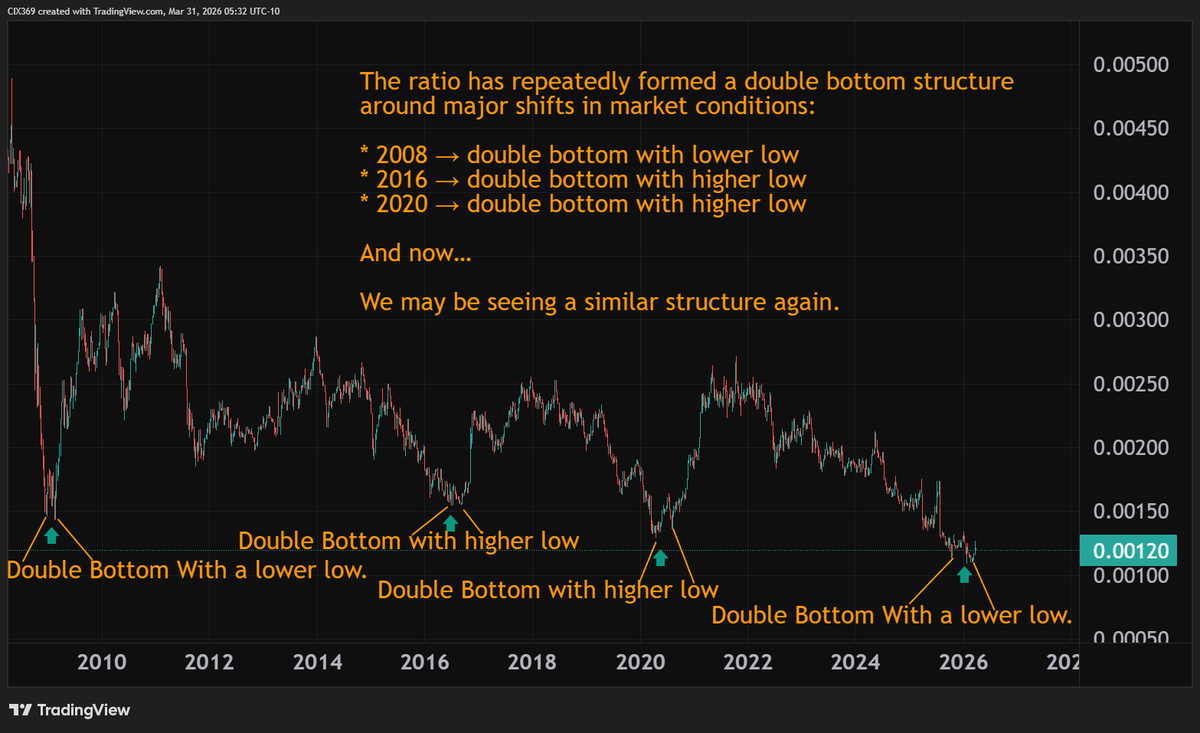
The ratio has repeatedly formed a double bottom structure
around major shifts in market conditions:
* 2008 → double bottom with lower low
* 2016 → double bottom with higher low
* 2020 → double bottom with higher low
And now…
We may be seeing a similar structure again.
---
The first bottom already formed in October.
Right when we saw the largest liquidation event in altcoins…
around $20B wiped out from the market.
Even low leverage positions got taken out.
That wasn’t random.
That was a reset.
---
Since then…
Copper has already started to outperform gold by roughly 15%.
That alone doesn’t confirm everything…
but it tells you one thing:
Conditions are shifting.
Crypto just reacts faster to these changes.
---
Do your own research.
But understand what you’re looking at.
This is where I first paid attention.
#Crypto#ETH#Bitcoin#Altcoins#ETHBTC#BullMarket#CryptoTrading#BuyTheDip#SmartMoney#CryptoCommunity#ProTrader#Investing#Ethereum#BTC#Markets#Gold#Copper
Now it’s time to focus on the signals.
Not opinions.
Not noise.
Not hope.
There are a few structures I’ve been watching closely...
and they matter more than most people realize.
ETHBTC...
Copper-Gold Ratio...
and a few other pieces most still ignore.
That’s where my attention is.
I’ll show you why.
Sometimes the best trades come when you least expect them.
Haven’t taken a position for maybe even months… just observing, waiting, staying patient.
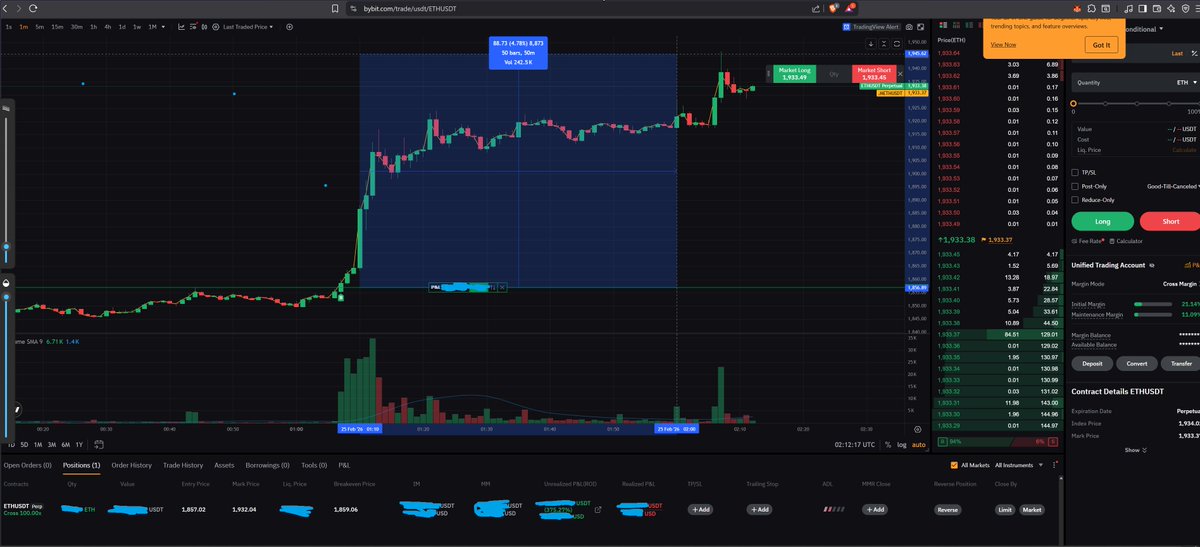
Then today… completely spontaneous… entered a clean setup together with a friend.
Position moved +4% within minutes and yeah... we are 100x 'ing that beauty.
No rush.
No forcing trades.
Just structure… timing… and execution.
So far… everything looks according to plan.
Let’s see how it develops.
@CIX369#Crypto#ETH#Bitcoin#Altcoins#ETHBTC#BullMarket#CryptoTrading#BuyTheDip#SmartMoney#CryptoCommunity#ProTrader#Investing#Ethereum#BTC#Markets
Because of the chart I shared earlier… many people are now expecting another massive leg down.
But you know how markets work.
When everyone expects the same outcome… reality often moves in the opposite direction.
So let’s step back and look at something much more interesting…
…the BTC Weekly Chart.
---
### Weekly Structure… Something Very Familiar
If you open the weekly chart and strip it down to structure only… one thing becomes very clear:
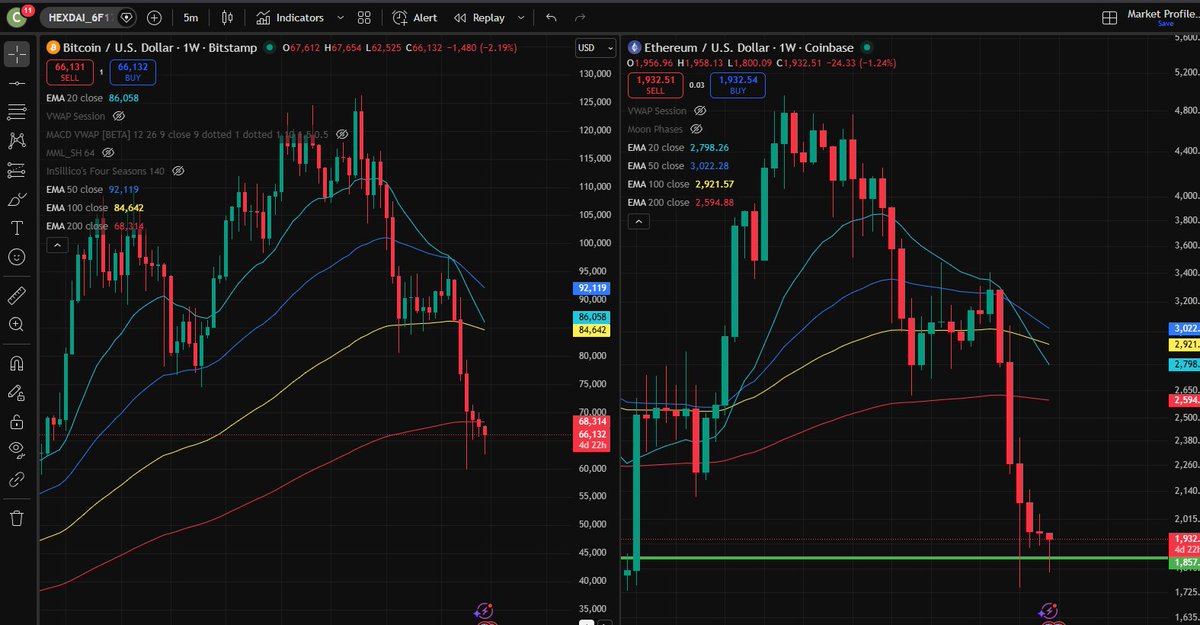
Bitcoin already revisited the 200 Weekly EMA.
Not only that…
…it actually overshot it to the downside.
Historically, this is nothing new:
… 2016 overshoot
… COVID crash overshoot around 30%+
… 2022 bear market overshoot roughly 35%+
And now?
We overshot again… roughly in the same magnitude.
That puts price in a very interesting technical position.
---
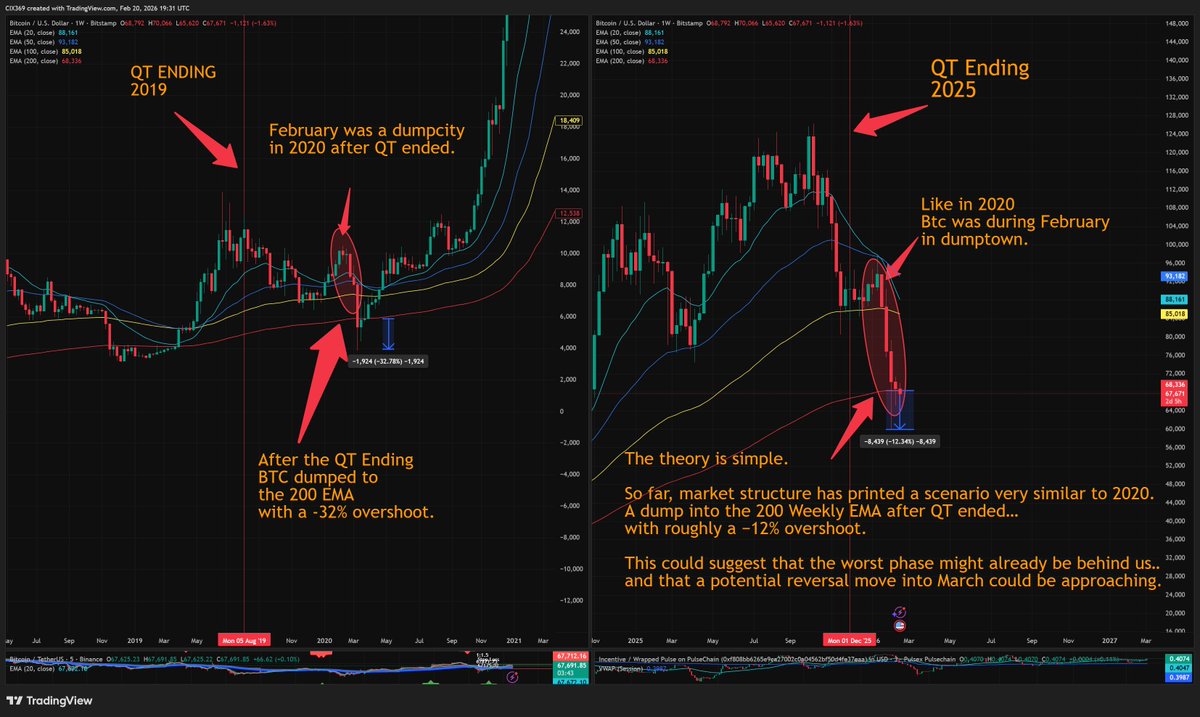
### The COVID Mirror
Here’s where it gets really interesting.
During COVID:
QT environment… panic… massive dump
Bitcoin broke down fast
Price overshot key averages
Then… the recovery phase began.
Now compare it to today:
QT recently ended
Bitcoin dumped aggressively
Price revisited and overshot the 200 Weekly EMA
Structure looks eerily similar.
I’m not saying history repeats perfectly…
…but the rhyme is hard to ignore.
---
### Timing Comparison
Back then…
Bitcoin sold off through most of February…
and printed the ultimate bottom around mid-March.
If the current structure continues to mirror that behavior…
then statistically speaking… a strong reaction phase somewhere around March would not be surprising.
Again… not a prediction.
Just an observation of how closely the pattern aligns so far.
---
### My Take
Right now the chart shows:
… fear at extreme levels
… technical overshoot already done
… structure similar to one of the strongest reversal phases in BTC history.
I’ll post a side-by-side comparison chart next…
COVID dump vs current structure.
Interesting pattern… right?
Just needed to get this off my mind.
@CIX369#Crypto#ETH#Bitcoin#Altcoins#ETHBTC#BullMarket#CryptoTrading#BuyTheDip#SmartMoney#CryptoCommunity#ProTrader#Investing#Ethereum#BTC#Markets
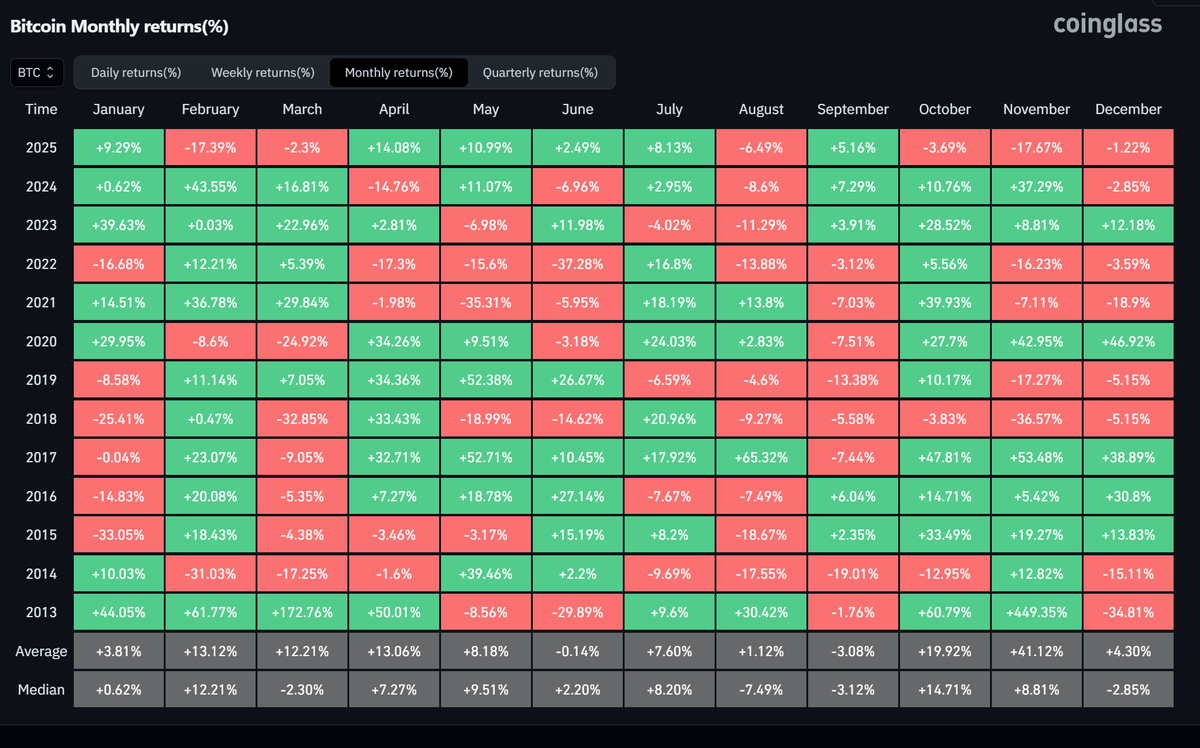
Guys…
Today no fancy indicators… no noise… no overcomplicated theories.
Just the BTC monthly chart… classical moving averages… and where we could realistically be inside the cycle.
I’ll show two charts so you can follow the structure visually.
---
### Monthly BTC Structure
Look back to the moment when Bitcoin touched the 20 Monthly EMA.
My theory back then was simple…
I expected a gold-like continuation pattern… meaning we would hold that level and continue higher.
That didn’t happen.
Instead… price did exactly what Bitcoin has done many times before…
it moved deeper and went to test the 50 Monthly EMA.
And yes… we visited it.
No emotions… just structure.
---
### Where Are We Inside the Cycle?
If we strip everything down to pure moving averages… the chart becomes very clear.
The 50 Monthly EMA has historically been a strong reaction area…
but it has never guaranteed the absolute bottom immediately.
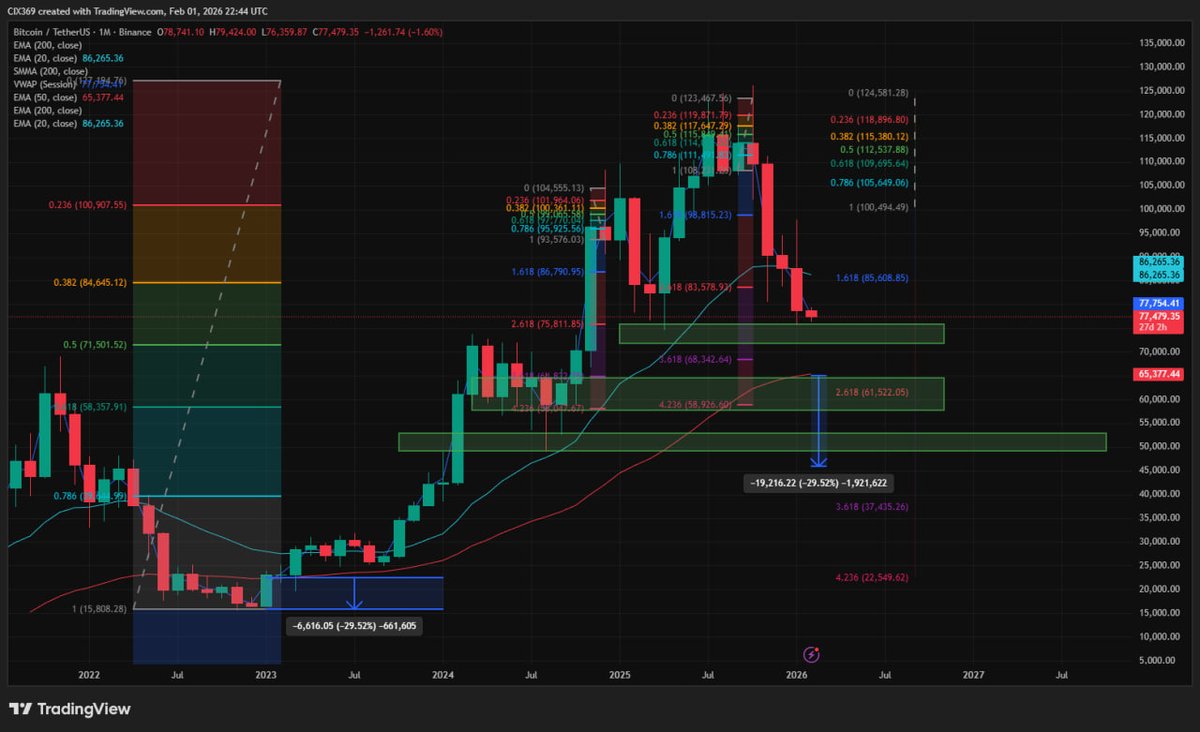
Now… let’s talk about the true worst-case scenario.
On the monthly timeframe… the only level that has acted as the ultimate structural support since Bitcoin’s inception is the 200 Monthly EMA.
That level currently sits roughly in the 46k–50k region.
Bitcoin has revisited that area only twice in its entire history…
and every single time… it held.
No exceptions.
That’s why… if someone asks me what the absolute worst case would look like from a pure chart perspective…
It’s not panic…
It’s simply a potential revisit of that historical support zone.
---
### What This Means
I’m not saying we will go there.
I’m not predicting anything.
I’m simply mapping the structure:
… 20 Monthly EMA failed
… 50 Monthly EMA tested
… 200 Monthly EMA remains the ultimate historical support
That’s the reality of the chart… without emotion.
Sometimes the simplest view… is the clearest one.
More context in the next post when....
#Crypto#ETH#Bitcoin#Altcoins#ETHBTC#BullMarket#CryptoTrading#BuyTheDip#SmartMoney#CryptoCommunity#ProTrader#Investing#Ethereum#BTC#Markets
2 weeks ago I made a post where I mapped out the important Bitcoin bottom levels on my chart.
Back then I said very clearly…
If the 75k–70k zone doesn’t hold…
the next logical level would be around 65k…
and my strongest overall confluence sat much lower… around 58k.
Now look at what actually happened.
Bitcoin printed its artificial bottom only about 2 % away from the strongest confluence area I highlighted.
Not perfect… but close enough to show that structure matters.
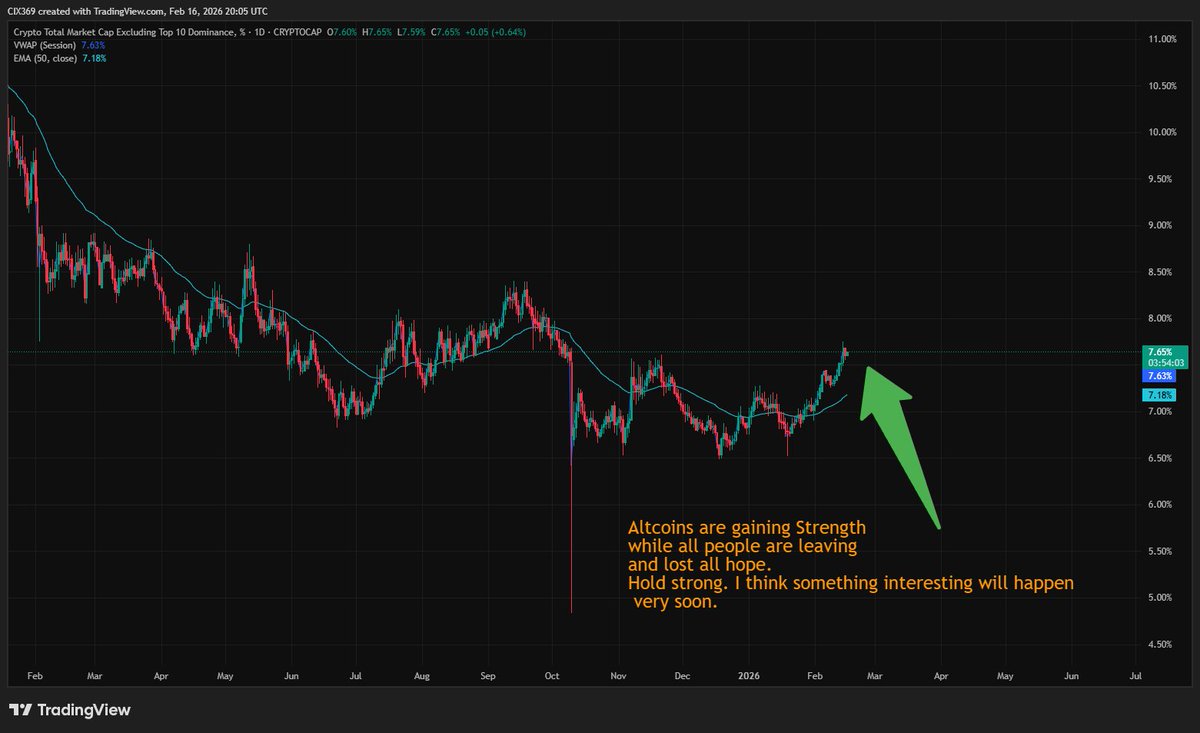
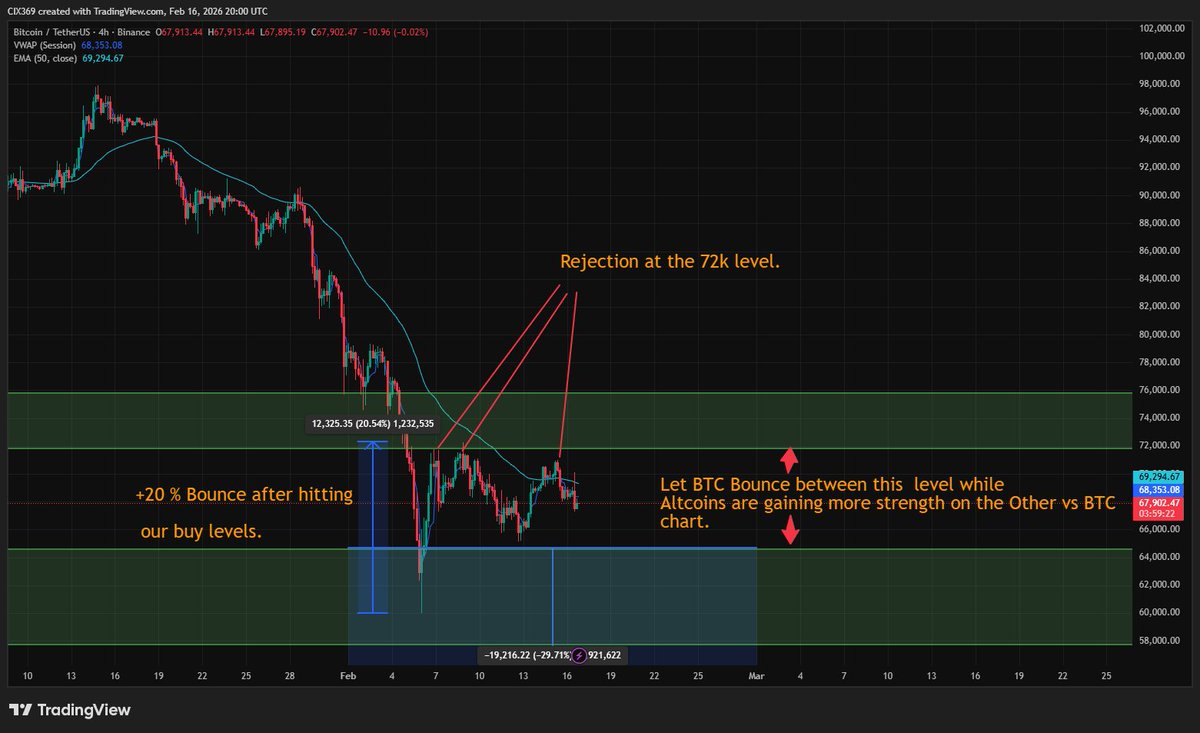
Since that moment… Bitcoin has already moved roughly +20% up.
And right now price is doing something interesting.
It’s consolidating almost exactly inside the channel I drew back then.
We’ve seen two touches around 72k… both rejected.
And currently price seems to be moving inside a range between roughly 64k and 72k.
Nothing random about that.
---
We still know what the worst-case scenario would be.
We tested the deeper zone… and the reaction was strong.
A 20% bounce is not small.
For me the takeaway is simple…
I don’t try to call the exact bottom.
But accumulating near a bottom has always been smarter than chasing after confirmation.
Structure over emotion.
Let’s see how this channel resolves.
@cix369#Crypto#ETH#Bitcoin#Altcoins#ETHBTC#BullMarket#CryptoTrading#BuyTheDip#SmartMoney#CryptoCommunity#ProTrader#Investing#Ethereum#BTC#Markets
Guys... quick clarification before we start.
I said I’d share all the thoughts in my head within 24 hours... realistically, that’s impossible.
So I’ll do it step by step... post by post... chart by chart.
Today we focus only on Bitcoin... and on possible scenarios, especially the worst case, so nobody gets emotionally wrecked by uncertainty.
---
### Bitcoin – Current Structure & Scenarios
Bitcoin has now tagged the 75k area over the weekend... and this is not random.
Between 75k and 71k I have a very important zone.
Why?
Because this zone contains:
* a key Fibonacci level
* and most importantly... it marks the 0.5 retracement of Bitcoin’s entire impulse move
from roughly 16k to the recent top around 120–125k
That’s a massive move and a 0.5 retracement in such structures is often a very strong reaction point.
So yes...
a bounce from here would make complete sense.
Easily.
---
### If this zone holds
If 75k–71k holds as support...
Bitcoin can turn from here and continue higher very fast.
Liquidity moves fast when everyone is positioned the wrong way.
---
### If it does NOT hold
If this zone fails... the next logical level is around 65k.
I have multiple Fibonacci confluences there.
Below that... the strongest confluence I see is around 58k.
That area has historically been very relevant.
---
BLX Chart… What History Actually Shows
Now let’s look at the BLX (Bitcoin Liquid Index)… the cleanest long-term Bitcoin chart.
The red line on the chart is the Monthly 50 EMA.
Historically, what happens when Bitcoin reaches it?
There is usually a bounce…
and in most cycles, a temporary undershoot below the EMA…
only after that does a more durable bottom form.
The data:
2015… around 15 percent undershoot
2019… around 20 percent
2020… around 37 percent
2021… around 29 percent
2022… around 35 percent
This is not weakness.
This is cycle reset behavior.
——-
### Worst Case Scenario
Historically... every time Bitcoin touched the 50 Monthly EMA, it produced an undershoot.
If we assume a typical undershoot of ~25% from the EMA level...
that would point to roughly 49k.
Personally...
I do not believe a move much lower than that would make sense.
That would already represent a very deep reset.
---
### My Positioning
I’m not saying all of this will happen.
I’m saying this is the map I keep in my head while holding positions.
I’m not selling.
I’m watching price.
I’m letting liquidity do what liquidity always does.
Bitcoin can move straight up from here just as easily as it can go lower first.
Both are valid paths.
---
More charts and deeper context coming in the next posts.
Today was Bitcoin only.
Stay calm... stay rational... don’t let short-term price action break your mindset.
We play probabilities... not emotions.
#Bitcoin#BTC#Crypto#Macro#Liquidity#MarketStructure#TechnicalAnalysis
What a January, my brothers and sisters…
Well, well.
Time for some new angles…
angles most people wouldn’t even think of.
I can’t wait to show you what I’m seeing so far.
It’s honestly crazy how they seem to be repeating very similar patterns on the charts with their recent moves.
February is getting closer…
and with it, that time window where a larger move could start to unfold.
But at the end of the day, fam…
I’m here to give you clarity, not copium.
And yes…
I truly, with all my heart, believe in what’s coming.
-----_____________________-----
I think I’ll drop all the points…
with chart proof…
within the next 24h.
I’m not selling.
And I’ll show you exactly why.
Stay sharp… stay patient.
The year didn’t start that bad...
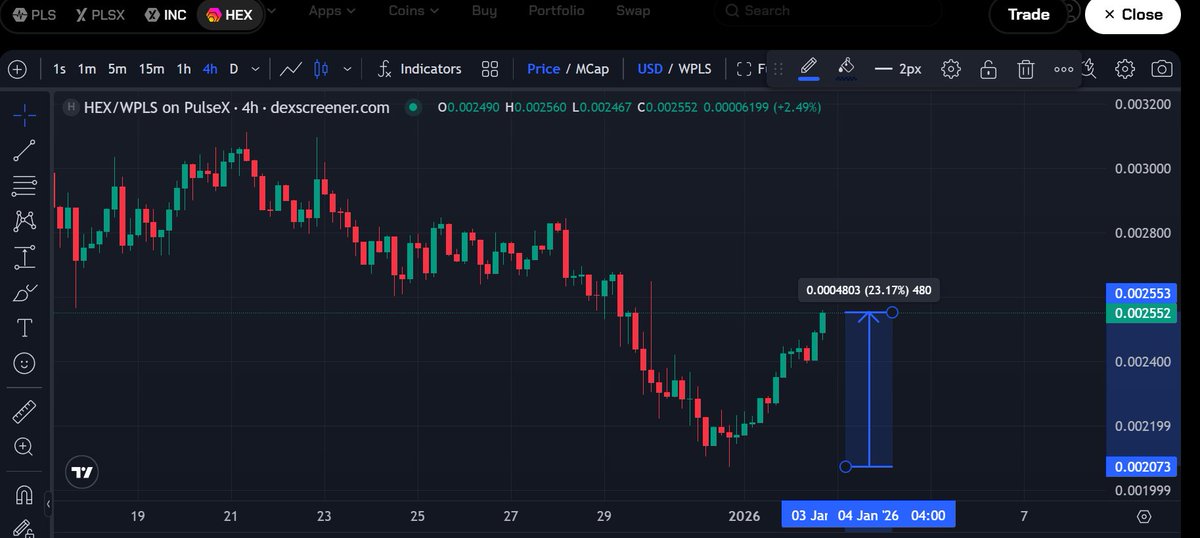
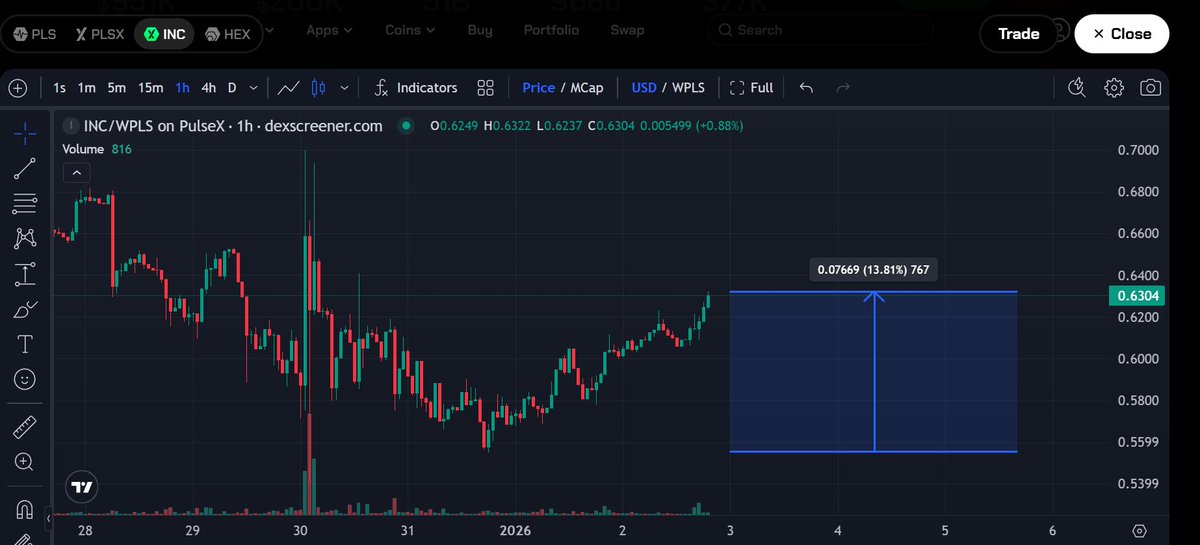
Altcoins have stabilized over the last 2 days.
HEX ~23% up... INC~13% up...
Top 100 showing first signs of relief.
Can it still go lower in 2026?
Yes.
Am I prepared?
Yes... all the way to zero if needed.
My thesis remains:
January positioning... February momentum.
I stand by it.
#Crypto#Altcoins#Markets#Bitcoin#Trading#Investing#MarketCycles
New Year
The last years taught many lessons...
about markets... and about life.
Altcoins have been at the bottom for a long time.
Yes... I believe the next cycle will come.
But one thing matters more than any chart...
When you die... you take nothing material with you.
What remains is who you were... how you lived... how you treated people.
This year... I move forward with zero expectations.
I will do the work... stay disciplined... and follow God’s plan.
One more thing...
I promised you something for 2025.
Give me a few more days... it’s very close.
The beginning of a new chapter.
No chasing... no forcing... no noise.
I wish you a calm... strong... meaningful New Year.
Happy New Year.
Next layer of the puzzle – why I’m confident we’re near a bottom.
To understand market cycles, you don’t start with opinions.
You start with ratios.
---
1) What is a stock ratio and why it matters
A ratio compares the performance of two assets.
It’s calculated by dividing Asset A by Asset B.
• If the ratio goes up → Asset A outperforms
• If the ratio goes down → Asset B outperforms
Ratios don’t care about narratives.
They show rotation and relative strength.
This is how professionals track cycle shifts.
---
2) The Copper / Gold ratio – one of the most important macro signals
The Copper/Gold ratio is a classic barometer for risk appetite.
• Copper = economic growth, industry, expansion
• Gold = safety, fear, uncertainty
When Copper outperforms Gold, markets are looking forward.
When Gold outperforms Copper, markets are defensive.
Historically:
• Rising Copper/Gold = risk-on
• Falling Copper/Gold = risk-off
---
3) Why this matters for altcoins
Here’s the key observation:
Every major altcoin bull run started AFTER Gold and Copper bottomed and began to trend up.
Not before.
Not during panic.
After the turn.
That’s when:
• macro pressure eased
• confidence slowly returned
• capital rotated into higher risk
• altcoins finally moved
Altcoins are late-cycle assets.
---
4) Where we are now
The Copper/Gold ratio is sitting near cyclical lows.
At the same time, a bullish divergence is forming between price and momentum.
That means:
• downside pressure is weakening
• selling is exhausting
• risk appetite is quietly stabilizing
This is not a breakout yet.
But historically, this is where bottoms form.
---
Why this gives me confidence
We have:
• low liquidity
• exhausted sentiment
• long high-risk bear market
• macro ratios near historical turning points
That combination has always preceded, not followed,
major risk-on phases.
Not instantly.
Not loudly.
But structurally.
---
We don’t need hype here.
We need context.
This is why I’m confident we are very close to an important transition.
Stay patient.
Stay structured.
Cycles reward those who wait through silence.
#Crypto#Altcoins#MarketCycles#Macro#Liquidity#RiskOn#Patience
Market Context... read this calmly.
What we are seeing right now is low liquidity.
Not because crypto is dead…
but because the market is calendar-drained.
End of December means:
• holidays
• thin order books
• funds closing books
• traders offline
• almost no fresh capital
This always hits altcoins the hardest.
Why?
Altcoins are high-beta assets.
They don’t move without liquidity.
Not because they are weak…
but because nobody is pushing yet.
---
Now here’s where my confidence comes from.
Historically, no high-risk market stayed dead forever.
Even the worst penny stock bear market in history
lasted around 5 years.
And then penny stocks moved again.
Not slowly…
but aggressively.
Altcoins behave structurally the same:
• they peak first
• they crash the hardest
• they go quiet for years
• nobody believes anymore
• then rotation happens
Cycles are not opinions.
They are statistics.
---
Where are we now?
• after the crash
• after capitulation
• deep in the patience phase
Low liquidity feels empty.
But it is not the end state.
It is the phase before expansion.
Historically:
• January = positioning
• February = first real expansion window
Not guaranteed.
But statistically very strong.
---
That’s why we stay calm.
That’s why we don’t chase.
That’s why we keep our structure.
In the next post, I’ll show you a chart
most people have never seen before
and it explains exactly where we are in the cycle.
Stay focused.
Patience is not weakness.
It’s preparation.