DV | Analytics

1.5K posts

DV | Analytics banner
DV | Analytics

DV | Analytics

@DVB00N

Market insights and proprietary institutional-grade risk management systems, strategy creation engines, and TradingView indicators. Not financial advice.

شامل ہوئے Ocak 2026
200 فالونگ106 فالوورز
پن کیا گیا ٹویٹ
DV | Analytics
DV | Analytics@DVB00N·
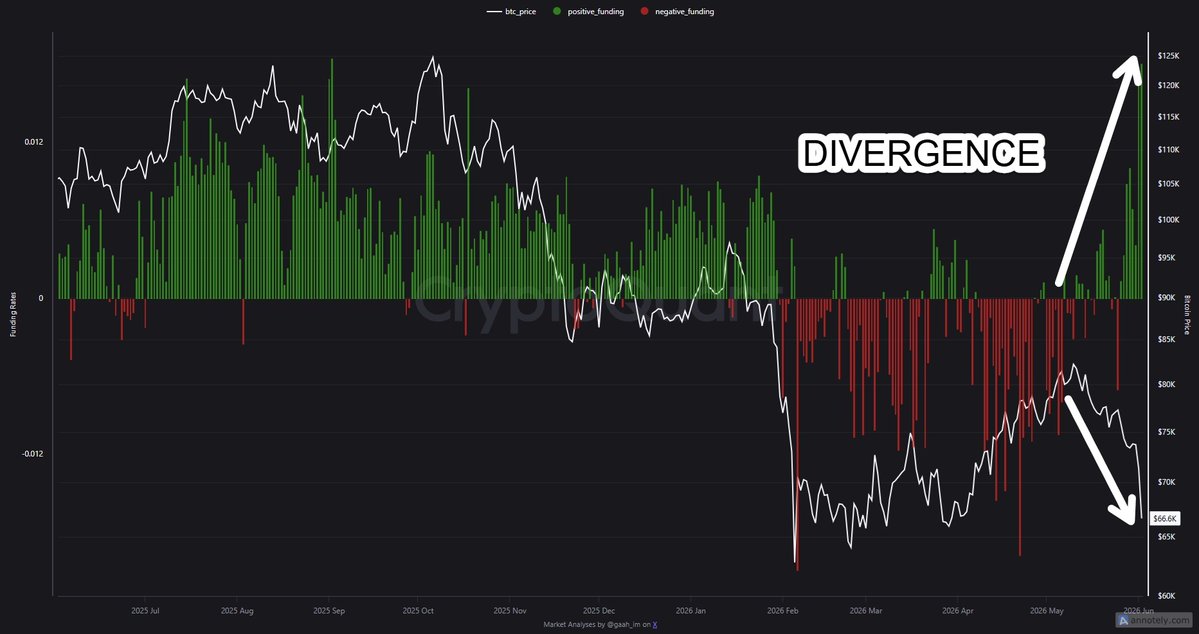
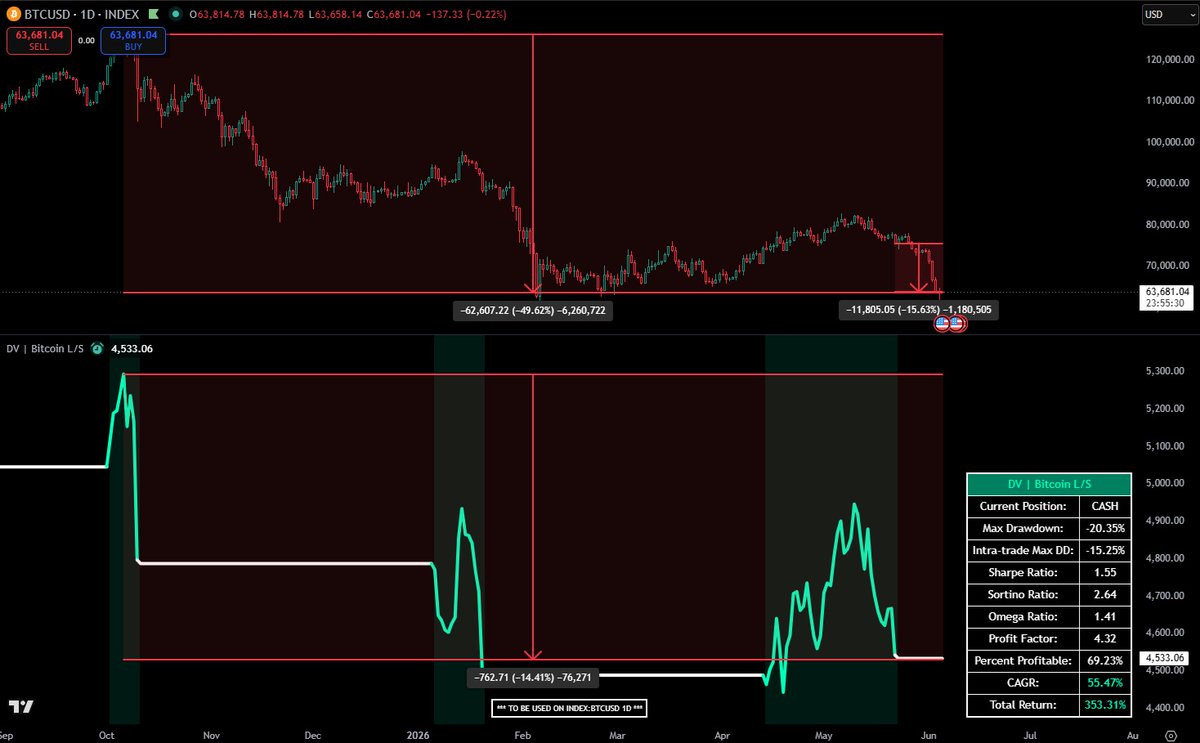
The systems have saved us from this recent 15% drop. In fact, the system is only down 15% from the peak, compared to Bitcoin's 50% drawdown. Being in cash while Bitcoin continues its decline is a beautiful thing. It helps us preserve capital but also prevents us from having to go through the emotional turmoil associated with that loss of capital. Why is capital preservation so important? That is because it takes far larger gains to recover whatever you lose. A 10% loss requires 11% to break even. A 20% loss requires 25%. A 50% loss requires 100%. And a 60% loss requires 150%. A 10% loss is not so hard to recover from, requiring only 1% more than you lost to get to breakeven. But the bigger your losses, the larger the multiples required to get it back. By utilizing systems to cut to cash and sidestep these deep distribution tails, we avoid the trap of compounding losses, ensuring we preserve our capital to exploit the next high-probability market cycle. #Crypto #Bitcoin #Systems #RiskManagement #DontLose
DV | Analytics tweet mediaDV | Analytics tweet media
English
0
0
3
50
DV | Analytics
DV | Analytics@DVB00N·
Bitcoin has moved back to being undervalued. The Valuation Suite suggests that Bitcoin has cooled to the slightly undervalued zone with the majority of Z-scores in the negatives and the aggregate Z-score sitting at -0.74. The Z-score indicator has it at an even deeper value sitting at -2.15, suggesting that the probability of this level occurring by pure chance is less than 2%, highlighting a significant historical deviation from fair value. And price has been hugging the lower bound of the Standard Deviation Bands during this decline and currently has it sitting at a Z-score of -2.67. If we take an average of the three, we get an overall Z-score of -1.85, suggesting that Bitcoin is trading in the bottom 3.2% of its historical distribution. This points to a statistically oversold market state that has historically preceded high-probability relief periods or trend reversals once selling exhaustion confirms. The probabilities of a reversion to the mean are in our favor. #Crypto #Bitcoin #Zscore #Statistics bitcoin:native
DV | Analytics tweet media
English
0
0
5
133
DV | Analytics
DV | Analytics@DVB00N·
The Bitcoin futures open interest 7D change model is below its -2 standard deviation band. Historically, this has been a good bottom indicator with a 75% hit rate over the course of this bull market. 2 out of 8 times prices continued to decline following this signal, but 6 out of 8 were at or near bottoms prior to a reversal. With price as low as it is and a signal like this, you have to ask yourself, is this likely to go lower again, or is this a bottom signal? #Crypto #Bitcoin #OI #BottomSignal
DV | Analytics tweet media
English
0
0
1
32
DV | Analytics
DV | Analytics@DVB00N·
Selling has been increasing over the past week, led by forced selling due to longs being liquidated. Volume has been dominated by sellers and is almost 3x above its average and has increased over the last 5 days with a 1 sigma event, two 2 sigma events, and culminating in a 3 sigma event over the past 24 hours. This has brought Bitcoin down to its current support level at $62,500, and price has been bouncing around there for the past 24 hours as buyers step in to arrest this recent decline and try to put in a floor. Let's see if support can remain as support. #Crypto #Bitcoin #Volume #Support #Resistance
DV | Analytics tweet media
English
0
0
2
31
DV | Analytics
DV | Analytics@DVB00N·
Funding rates (FR) are starting to cool. At the same time open interest (OI) is dropping off. FR dropping means leveraged long traders aren't willing to pay a premium in order to keep their positions open anymore. OI dropping means fewer new positions are being opened in the futures market. What does this tell me? The data indicates that the large number of long positions that were opening up and fueling this recent decline are starting to subside. Leveraged long traders have been hammered and are starting to lick their wounds rather than come back for more pain. Does this mean the pain is over? Unlikely. While fewer positions are being opened, of the positions that are, we can see on the liquidation maps posted in an earlier post that there are still a lot of leveraged traders attempting to long the bottom. And the higher timeframe liquidation maps are still heavily stacked to the downside. This means we could have some sideways chop, or perhaps even another drop, before the market has put in its floor. #Crypto #Bitcoin #OnChain #Funding #oilmassage bitcoin:native
DV | Analytics tweet mediaDV | Analytics tweet media
English
0
0
2
23
DV | Analytics
DV | Analytics@DVB00N·
An almost 5 sigma event! The crowding model plots the RSI and the Z-score of fund flows for an asset. Currently the amount of funds flowing out of Bitcoin is an almost 5 standard deviation (sigma) event. In a standard normal distribution, this kind of event is a 1-in-a-million event. This means it should mark the end of this recent nuke, and the majority of sellers exiting the market have already done so. This doesn't mean that we are going to V-reverse from here. Momentum could cause price to drag sideways while the market hammers out a floor. But the probabilities of a floor are in our favor. #Crypto #Bitcoin #Crowding #5Sigma
DV | Analytics tweet media
English
0
0
2
37
DV | Analytics
DV | Analytics@DVB00N·
These longs just love getting wrecked. Price has yo-yo'd between $61k and $65k for the past 24 hours as buyers are beginning to step in to buy at these lower prices and futures traders attempt to long the bottom and catch the falling knife. We can see that on the 1D the shorts are starting to stack up, but we can also see that the longs continue to stack up also. The 1W maps look a bit better than the 1D, but we may have more yo-yoing ahead of us as the market attempts to find a floor. #Crypto #Bitcoin #Liquidations bitcoin:native
DV | Analytics tweet mediaDV | Analytics tweet media
English
0
0
1
21
DV | Analytics
DV | Analytics@DVB00N·
A lot more downside! If the 4-year cycle bros are right, we may still have quite a way to go. Past bear markets have not finished near the intersection of the STH cost basis and true market mean (TMM), but when price crossed below the LTH cost basis. We have only just passed that intersection, which typically is about halfway through the bear market. If this does play out like a typical 4-year cycle, it could mean that Bitcoin is due to make a move down below $48k if it were to pass the LTH cost basis as it has done in previous bear markets. Of course, this all depends on IF the 4-year cycle thesis plays out. #Crypto #Bitcoin #4YearCycle #OnChain bitcoin:native
DV | Analytics tweet media
English
0
0
1
24
DV | Analytics
DV | Analytics@DVB00N·
This recent nuke has been led by longs getting liquidated, but what is happening in the spot markets? The sell-side risk ratio has come up off of its lows led by short-term holders (STH). We can see that the spot cumulative volume delta (CVD) is currently dominated by sellers. And ETFs have had another billion dollars of outflows so far this week, and we still have 2 days to go. What is all this telling us? While leveraged longs continue to open positions, fueling this decline, it has spooked spot and ETF sellers who are beginning to panic sell into this decline, further fueling the price decline and liquidation cascade. This may not be over yet. #Crypto #Bitcoin #OnChain #RiskManagement bitcoin:native
DV | Analytics tweet mediaDV | Analytics tweet mediaDV | Analytics tweet mediaDV | Analytics tweet media
English
0
0
1
37
DV | Analytics
DV | Analytics@DVB00N·
The higher-timeframe liquidation heatmaps suggest that this move may not yet be over. The 1M heatmaps and above show large clusterings of long positions below price, reaching down towards the $50-$55k range. At the same time, we see very few shorts above and a serious lack of spot and ETF buyers. It seems that lower is the more likely scenario. #Crypto #Bitcoin #OnChain #RiskManagement #Liquidations bitcoin:native
DV | Analytics tweet mediaDV | Analytics tweet mediaDV | Analytics tweet mediaDV | Analytics tweet media
English
0
0
1
21
DV | Analytics
DV | Analytics@DVB00N·
The System Wins Again Our Bitcoin L/S system has helped protect us from Bitcoin's massive drawdown since its all-time high and also from this most recent nuking. Bitcoin is down almost 50% from its all-time high in October. If you were following the long only on the Bitcoin L/S system, you would be down less than 15%. If you were using both trade directions during this time, you would be up 25% during this period. Whether you want lower risk or higher risk, the system is still outperforming Bitcoin during this bear market. Want access to proper risk management tools? Visit: whop.com/dv-analytics #Crypto #Bitcoin #Systems #RiskManagement
DV | Analytics tweet media
English
0
0
1
19
DV | Analytics
DV | Analytics@DVB00N·
Crowding Model Update The crowding model is showing that the majority of cryptocurrencies it tracks are in the Oversold: Puking Lows quadrant. This specific quadrant indicates a market state where both directional momentum and active capital inflows have diminished. While a select handful of assets have managed to buck the trend and push higher, the broader market remains locked in a systematic sell-off. This overwhelming concentration of assets in the lower quadrant highlights that the current correction is a highly correlated, market-wide flushing event rather than an asset-specific decline. Want access to this model? Visit: whop.com/dv-analytics #Crypto #Bitcoin #OnChain #RiskManagement #Crowding
DV | Analytics tweet media
English
0
0
2
68
DV | Analytics
DV | Analytics@DVB00N·
Already price has declined down through those long liquidations down to $61k and has since rebounded to $64k at the time of writing. We can see that longs are again attempting to catch the falling knife on this rebound. The shorts above price don't seem to have changed significantly, yet the longs below price are already stacking up. We could see another flush lower from here. Greed must be punished by God. #Crypto #Bitcoin #OnChain #Liquidations #Greed bitcoin:native
DV | Analytics tweet mediaDV | Analytics tweet media
DV | Analytics@DVB00N

Despite this recent decline, the liquidation maps are still stacked to the downside. On the 1D, a dense cluster of longs sits below price. This could continue the move down towards $64k. On the 1W maps, the longs below price are in closer proximity than the shorts above. Whilst the maps are somewhat evenly stacked, that proximity may mean there is further downside ahead. #Crypto #Bitcoin #Liquidations #OnChain #RiskManagement

English
0
0
1
28
DV | Analytics
DV | Analytics@DVB00N·
Futures traders are fueling this nuke. Futures sentiment is rising, suggesting that people are continuing to open futures positions. Funding rates remain elevated, meaning that longs are paying a premium to keep their positions open. The Bitcoin futures open interest vs. price change is showing that while prices have been declining, leveraged futures traders have continued opening more and more positions. These divergences are what is fueling this nuke. As price declines, leveraged traders continue to try and catch the falling knife, wrecking themselves and anyone else on the way down. #Crypto #Bitcoin #OnChain #Liquidations #RiskManagement #Funding #OI
DV | Analytics tweet mediaDV | Analytics tweet mediaDV | Analytics tweet media
English
0
0
1
27
DV | Analytics
DV | Analytics@DVB00N·
Despite this recent decline, the liquidation maps are still stacked to the downside. On the 1D, a dense cluster of longs sits below price. This could continue the move down towards $64k. On the 1W maps, the longs below price are in closer proximity than the shorts above. Whilst the maps are somewhat evenly stacked, that proximity may mean there is further downside ahead. #Crypto #Bitcoin #Liquidations #OnChain #RiskManagement
DV | Analytics tweet mediaDV | Analytics tweet media
English
0
0
2
63
DV | Analytics
DV | Analytics@DVB00N·
Is this downward move over? Not likely. Despite numerous oversold signals, it seems we may still have more downside ahead of us. While Bitcoin has declined more than 20% from its recent high, the data is suggesting more downside may be ahead of us. The global liquidity rate of change (RoC) shows that while Bitcoin has declined, we could still have more downside ahead, with the inflection point for where we can expect Bitcoin to change course still a month and a half away. See image 1. May through July is also a seasonally weak period for Bitcoin. This lines up with the global liquidity RoC in suggesting that we may still have more than a month left of negative price action See image 2. Futures make up 85%-95% of Bitcoin's trading volume, and while price keeps moving down through the clusters of long liquidations, funding rates are high, suggesting that leverage positions continue to open up despite this decline. See image 3. And finally, the higher timeframe liquidation heatmaps are showing us that longs continue to build below price. These maps are showing us that a move down to $60k-$55k may be a possibility. See image 4. While we're at a point where things are so oversold and statistically extended to the downside, that doesn't mean that this move is over yet. The data seems to be saying that there is more to come. #Crypto #Bitcoin #Liquidations #Seasonality #OnChain #RiskManagement #Funding #Bears #Down
DV | Analytics tweet mediaDV | Analytics tweet mediaDV | Analytics tweet mediaDV | Analytics tweet media
English
0
0
2
60
DV | Analytics
DV | Analytics@DVB00N·
@Sykodelic_ You are 100% right. The AI trade seems to be sucking everything out of the markets.
English
0
0
0
64
Sykodelic 🔪
Sykodelic 🔪@Sykodelic_·
The 4 year Bitcoin cycle doesn't exist. And at the moment, neither does the Business cycle correlation. Everyone who is following the 4 year cycle is saying "this is just 4 year cycle bro you are coping"... But its not. Bitcoin has never been in an isolated bear market like this against everything else. Every single Bitcoin bear 4 year cycle has happened with: - Equities dropping - Global liquidity index dropping - Business cycle contracting But right now we have: - Equities screaming ATHs - Global liquidity index ATHs - Business cycle expanding Which is the environment in which every single bull cycle has happened. But now, everything is the total opposite. This is not the 4 year cycle. This is not the business cycle. This is a totally new paradigm for Bitcoin in which it is not following anything. You have to understand the 4 year cycle has been driven by macro... But now, Bitcoin isn't listening to macro? So what is it? This is not blaming manipulation... This is highlighting an incredibly large shift that is a total first for this market and it has massive implications. If you blindly believe in the 4 year cycle, what makes you think it will just play out when everything else has changed? Something bigger is happening here. At 10/10 Bitcoin broke from everything... And fuck knows what happened... And that is just a fact you can see clearly on this chart.
Sykodelic 🔪 tweet media
English
139
47
474
44.1K
DV | Analytics
DV | Analytics@DVB00N·
It's good to be in cash. Our Bitcoin system shifted to cash almost two weeks ago after locking in a small profit. That has helped us to avoid Bitcoin's recent decline to close to $65k. The systems have helped us preserve our capital while Bitcoin continues to decline. Bitcoin is down 46% from its all-time high. The system is down less than 15%. Keeping our capital protected to take advantage of Bitcoin's next move higher. Want access to proper risk management systems? Visit: whop.com/dv-analytics #Crypto #Bitcoin #Riskmanagement
DV | Analytics tweet mediaDV | Analytics tweet media
English
0
0
3
118
DV | Analytics
DV | Analytics@DVB00N·
The PMI has jumped to 54. The PMI is a measure of the business cycle. This signals a strong expansion in economic activity. 50 serves as the baseline separating contraction from expansion. A reading of 54 demonstrates robust macro momentum and represents a healthy acceleration. Historically, Bitcoin has had its largest runs after the PMI had crossed into expansion and remained there. See image. Bitcoin since 2023 has made all its gains prior to the PMI crossing into expansion. Very different to all the previous times. Will the business cycle bring the parabolic gains that it has for Bitcoin in the past? Bonds had their turn, then gold, and now stocks. It seems money keeps moving further out along the risk curve. Is Bitcoin and cryptocurrency next? #Crypto #Bitcoin #PMI #Businesscycle
DV | Analytics tweet media
English
0
0
2
29
DV | Analytics
DV | Analytics@DVB00N·
This recent drop in Bitcoin purged out a large portion of the leveraged longs. We can see on the 1D that while there is still a dense cluster that could lead us back down to the $66,500 range, the shorts are stacked to the upside with closer proximity and larger density. Most of the lower-timeframe maps look similar. However, the higher-timeframe maps are telling a different story. The 3M map pictured here still shows a larger density of long liquidations that could still take things lower. This is the same picture for all the higher-timeframe maps. It's starting to look like we could see a dip toward the $60k level. #Crypto #Bitcoin #Liquidations
DV | Analytics tweet mediaDV | Analytics tweet media
English
0
0
2
23