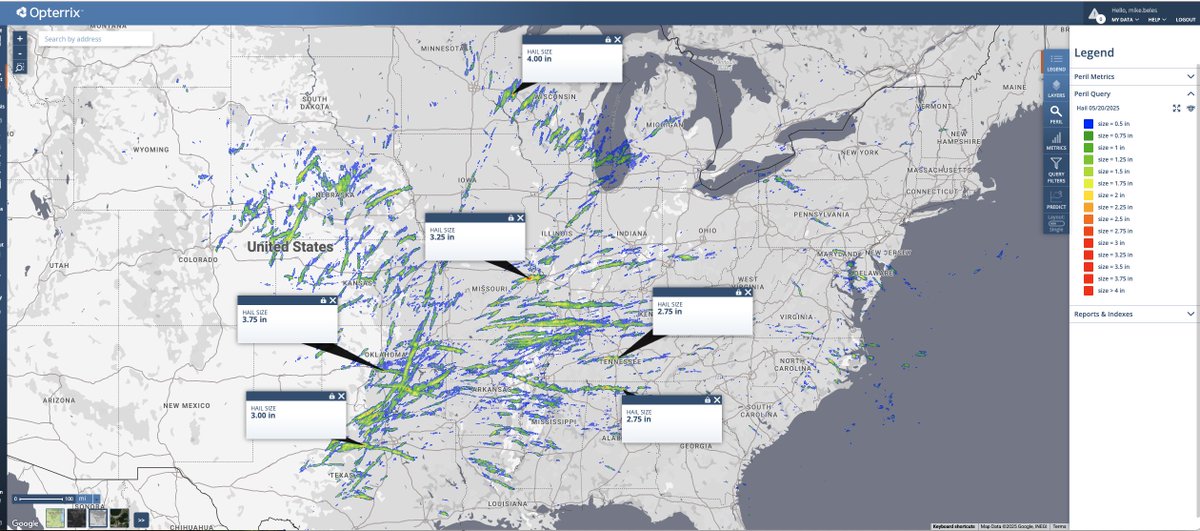
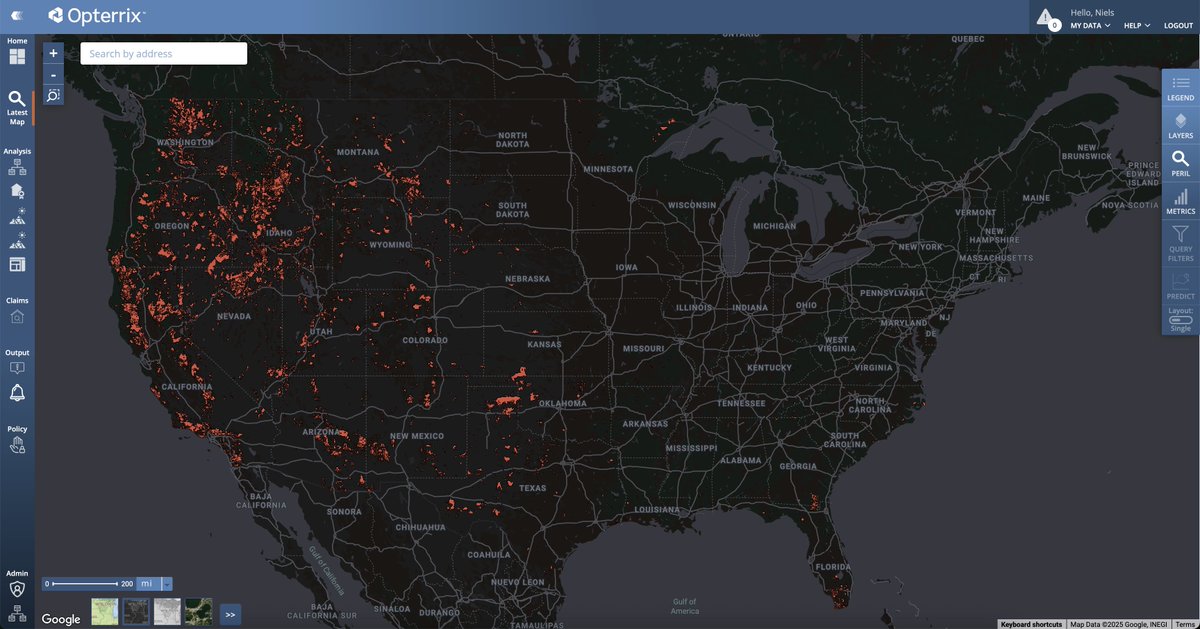
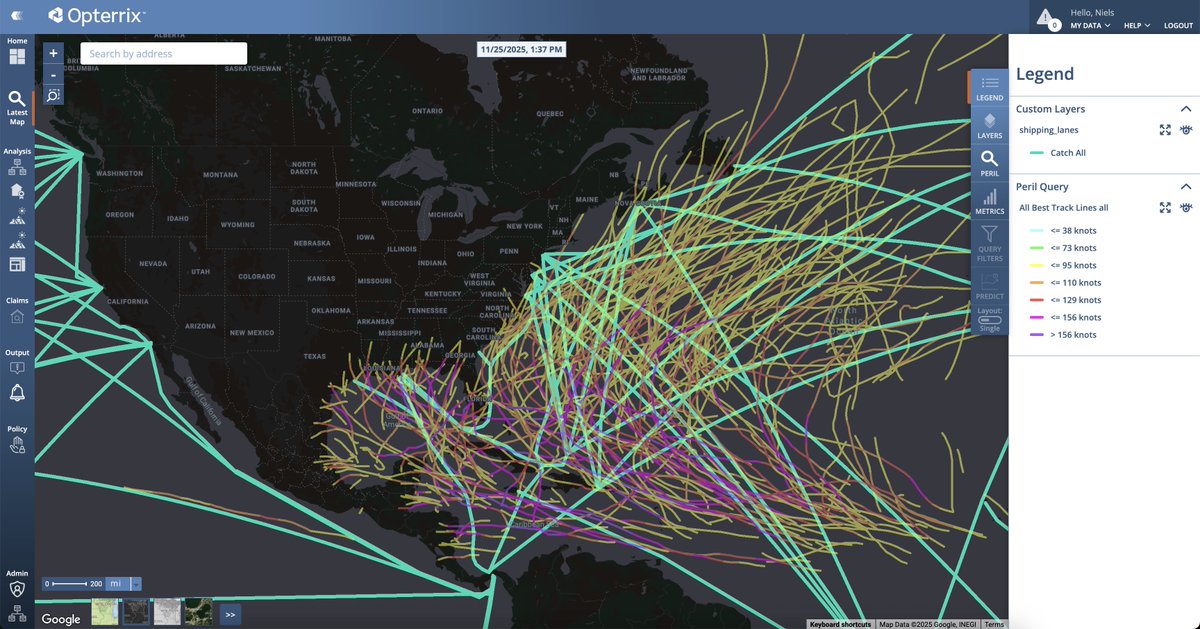
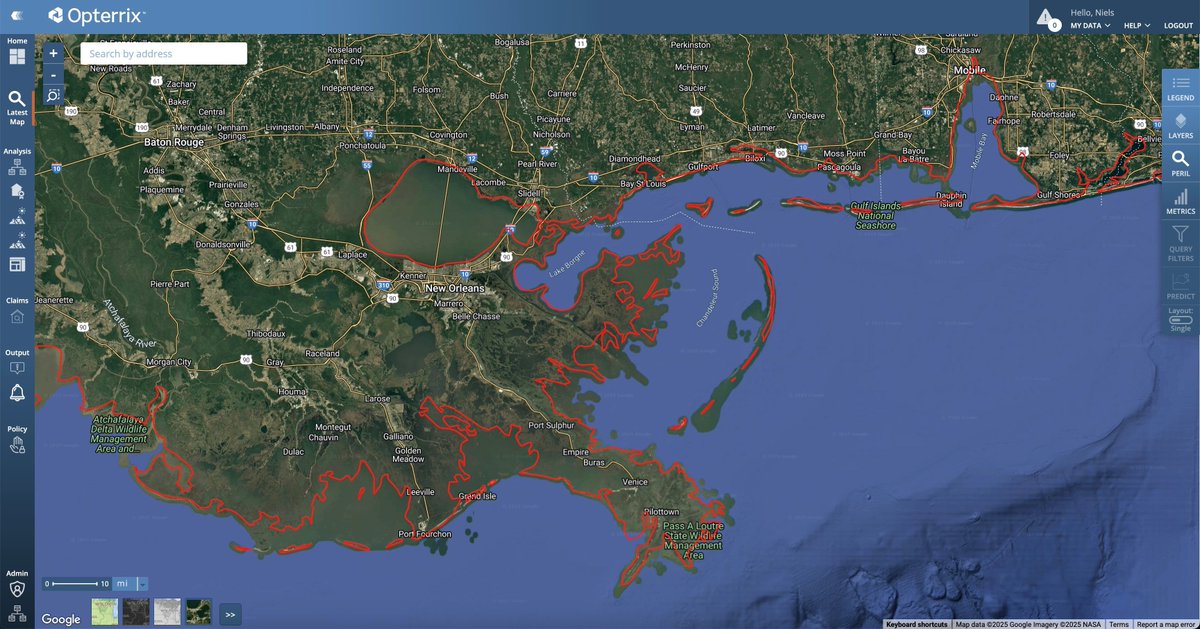
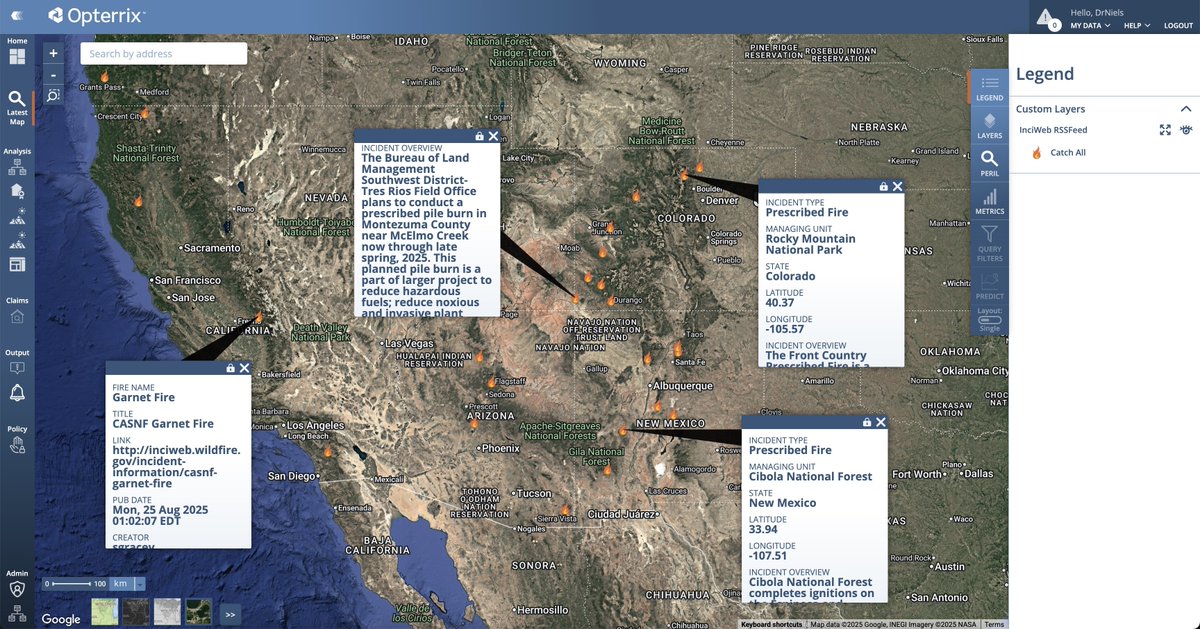
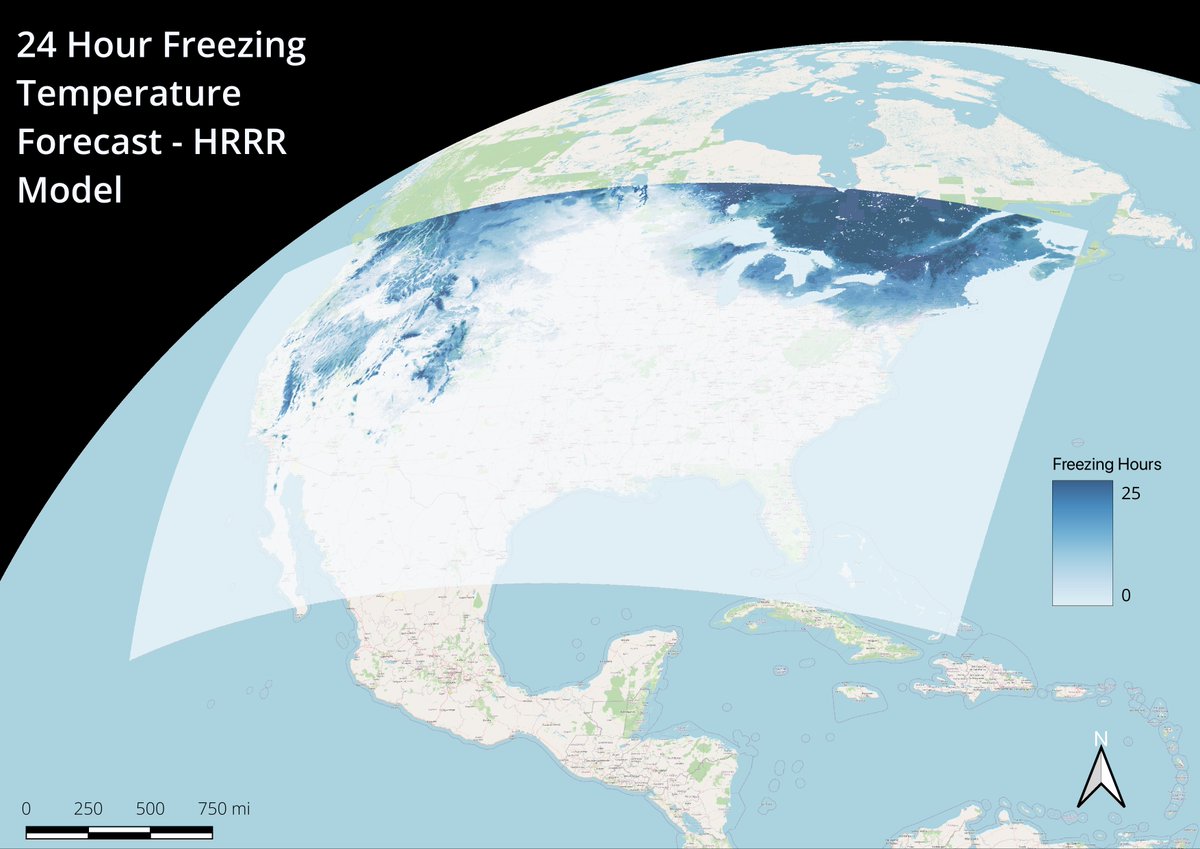
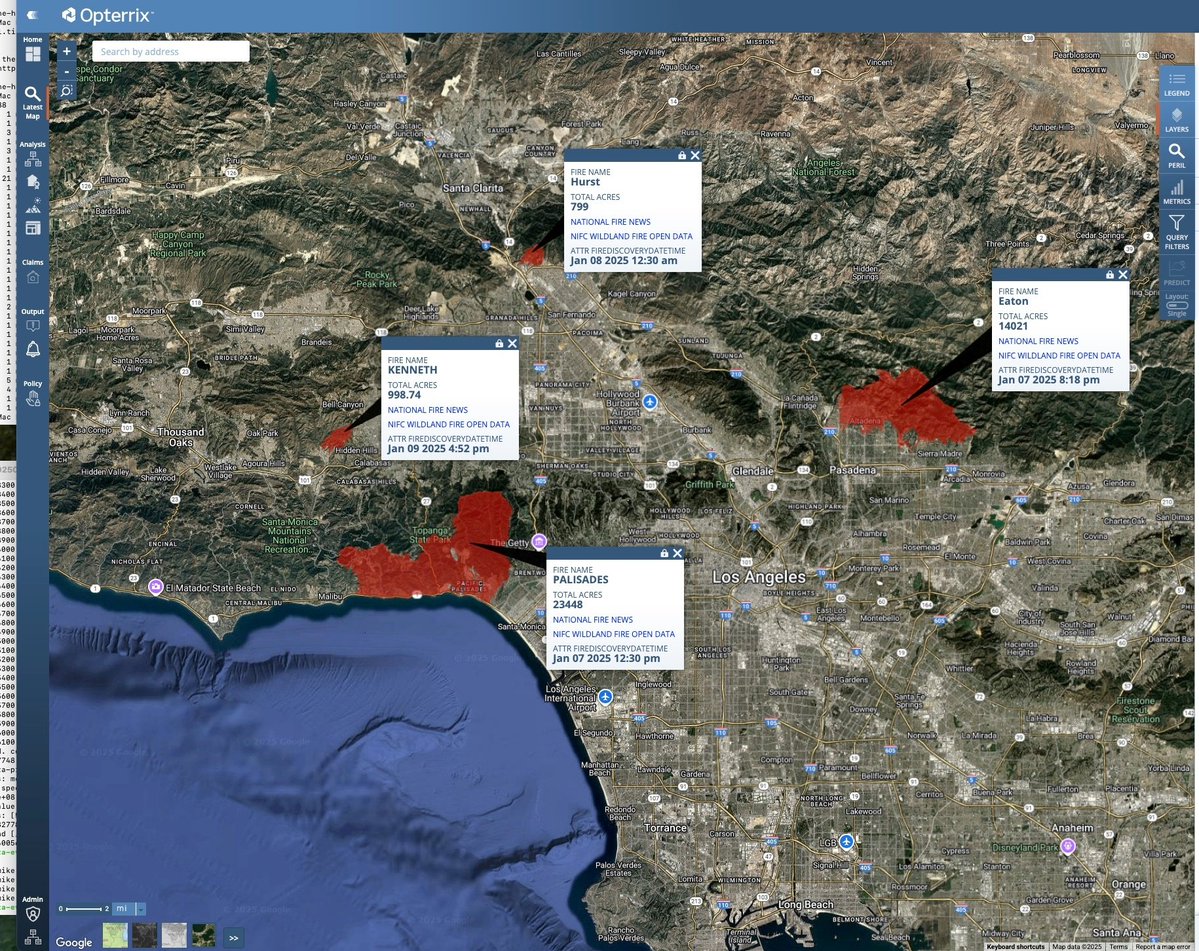
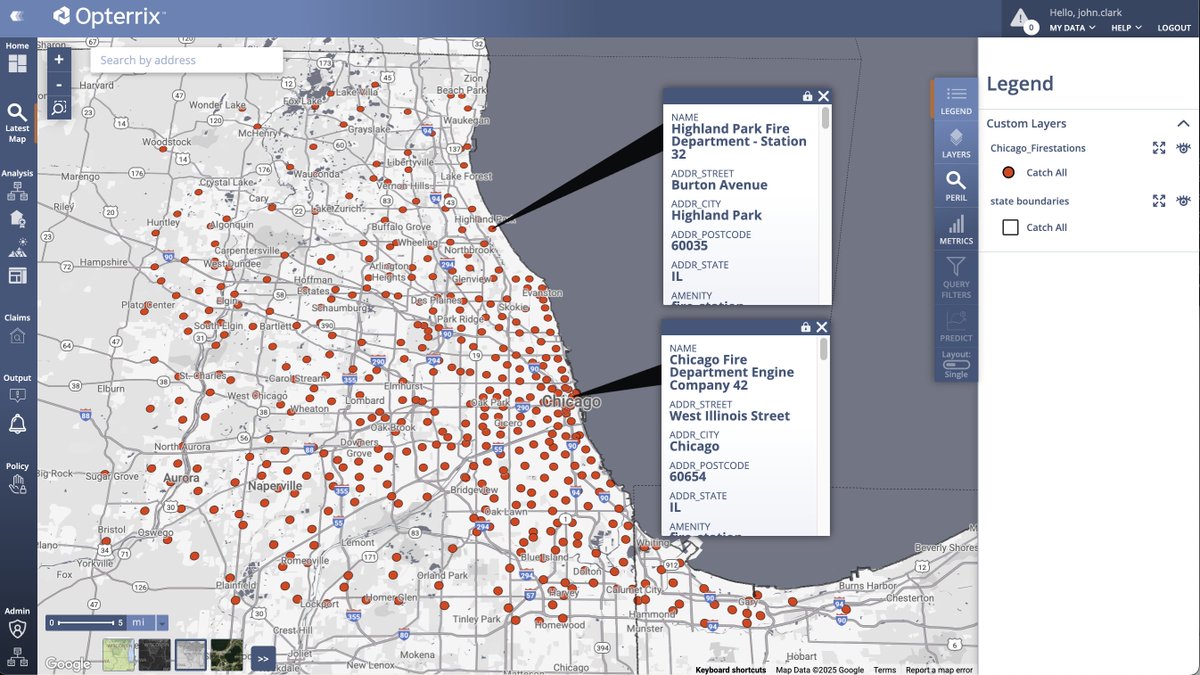
Opterrix

255 posts

Opterrix banner
Opterrix

Opterrix

@opterrix

Powerful visualization and analytics platform for guiding risk-related decision making.

شامل ہوئے Ocak 2020
5 فالونگ37 فالوورز
Opterrix
Opterrix@opterrix·
The devastation caused by the recent atmospheric river in Washington is heartbreaking. If you have policyholders impacted by the flooding in Washington, contact us today. We can help streamline your event response. #Flood #CATResponse #ICEYE #Opterrix #Claims #SAR
Opterrix tweet mediaOpterrix tweet mediaOpterrix tweet media
English
0
0
0
165
Opterrix
Opterrix@opterrix·
It's the #30daymapchallenge MAKE-OVER! We zoom in on the intense May 14-20th severe weather event. Opterrix detected hail up to 4" (Eau Claire, WI)! Insured losses from this outbreak are estimated at $4B–$7B by Gallagher Re. #Geospatial #RiskAnalysis #InsurTech
Opterrix tweet media
English
0
0
0
65
Opterrix
Opterrix@opterrix·
For Day 27 of #30DayMapChallenge (Boundaries), we visualize Total Insured Value in Houston through 3 lenses: Counties, Zip Codes, 3-Mile Hex Grids If you only look at the county level, you miss the concentrated exposure hiding in plain sight. #Opterrix #InsurTech #RiskAnalysis
English
0
0
0
39
Opterrix
Opterrix@opterrix·
Day 24: Places and Names - Apalachicola Flood Zones. For #30DayMapChallenge, we explore toponymy and risk assessment. The name Apalachicola, some say, means "people on the other side." This Florida city faces unique flood risks, visualized via FEMA Flood Zones using Opterrix.
Opterrix tweet media
English
0
0
0
42
Opterrix
Opterrix@opterrix·
Day 23 of the #30DayMapChallenge: Process. Coastal exposure analysis is a critical, yet often complex, process for property insurers. Today, we're showcasing an animation of how our platform executes a 5-mile coastal exposure analysis. #InsurTech #CatastropheModeling #Risk
English
0
0
0
44
Opterrix
Opterrix@opterrix·
For Day 20 of #30DayMapChallenge, we focus on Water. Here, flood depth data (cm) from ICEYE for Hurricane Helene in 2024, for the Greater Asheville area. ICEYE offers hyper-local flood data at ~4 meters resolution. #GIS #ICEYE #Opterrix
Opterrix tweet media
English
0
0
0
83
Opterrix
Opterrix@opterrix·
Happy GIS Day! Day 19 of #30DayMapChallenge, the prompt is "Projections"—This map shows predicted freezing hours over the next 24 hours from the HRRR model. The curved view isn't distortion—it's how a satellite 22,236 miles above the equator "sees" our planet! #GISDay #Opterrix
Opterrix tweet media
English
0
0
0
61
Opterrix
Opterrix@opterrix·
For Today's #30DayMapChallenge - A New Tool, we're previewing Opterrix platform features for insurance clients. We call this "Real Time Giza"—enabling insurers to view risk distribution based on past events or user-input impact areas. #GIS #Underwriting #RiskManagement #GIZA
Opterrix tweet media
English
0
0
0
52
Opterrix
Opterrix@opterrix·
Day 16 of #30DayMapChallenge: Cell. This map illustrates Opterrix's use of 3mi hexgrids, enabling risk managers to identify where business is written, capacity is utilized, and potential focus areas for underwriters. #PortfolioManagement
Opterrix tweet media
English
0
0
0
60
Opterrix
Opterrix@opterrix·
🔥Day 14: Unlocking Community Safety with OpenStreetMap Data 🗺️We're hitting the halfway point of the #30DayMapChallenge, and today Opterrix is focusing on the power of OpenStreetMap (OSM) data! We used OSM data to plot the locations of fire stations in the Chicago area.
Opterrix tweet media
English
0
0
0
63
Opterrix
Opterrix@opterrix·
Day 13 of the #30DayMapChallenge highlights the 10-minute map, focusing on speed. With January 2025 wildfires, heavy rain may cause debris flows and mudslides. We visualize Genasys Inc. Evacuation Zones and 48-hour precipitation from the HRRR model. #GIS #Opterrix #Genasys
Opterrix tweet media
English
0
0
0
59