Interactive Data Lab

517 posts

Interactive Data Lab banner
Interactive Data Lab

Interactive Data Lab

@uwdata

Visualization & data analysis at @uw @uwcse. In a previous life was the Stanford Vis Group.

Seattle, WA شامل ہوئے Eylül 2013
277 فالونگ7.5K فالوورز
Interactive Data Lab
Interactive Data Lab@uwdata·
With DracoGPT, Will Wang shows how to extract and model visualization design preferences from generative AI systems — enabling new ways to quantify, evaluate, and efficiently reuse LLM-based chart recommendations. #ieeevis idl.uw.edu/papers/dracogpt
English
1
3
21
2.6K
Interactive Data Lab
Interactive Data Lab@uwdata·
Congratulations to IDL alum @domoritz for winning a VGTC Significant New Researcher award!! A premier honor for early career researchers in visualization!
English
7
7
59
9.2K
Christian Casazza
Christian Casazza@CasazzaNY·
@edublancas @duckdb I feel like this is more about DuckDB WASM than Mosaic necessarily? Is Mosaic doing something in particular that other data viz with DuckDB WASM frameworks aren’t doing?
English
4
0
3
768
Interactive Data Lab ری ٹویٹ کیا
Eduardo Blancas
Eduardo Blancas@edublancas·
Mosaic is the future of data visualization. 10M cross-filtered rows with client-side processing. Powered by @duckdb
GIF
English
5
10
139
13.8K
Interactive Data Lab
Interactive Data Lab@uwdata·
@trevmanz @ProjectJupyter @duckdb @motherduck These are the types of portable (notebook/web/etc) applications we are hoping to foster with Mosaic! Components like these can then also interoperate via linked selections with other Mosaic-based plots and dashboards.
English
1
0
7
329
trevor manz
trevor manz@trevmanz·
Since quak is based on the @uwdata Mosaic architecture, it supports environments beyond @ProjectJupyter. The demo site let's you profile tables entirely in the browser, backed by @duckdb WASM. It can also be wired up to @motherduck. 👉 manzt.github.io/quak
trevor manz@trevmanz

ICYMI @SciPyConf... quak 🦆 is a scalable, interactive data table built with #anywidget - 🖱️ crossfilter & sort millions of rows in real time - 🔄 view any @ApacheArrow __dataframe__ - ⚡ powered by @uwdata mosaic & @duckdb - 📓 materialize sub-views back in @ProjectJupyter

English
2
11
83
7K
Interactive Data Lab ری ٹویٹ کیا
Madeleine Grunde-McLaughlin
Madeleine Grunde-McLaughlin@MadeleineGrunde·
Chaining LLM calls can improve output quality, but navigating the massive space of task decompositions is challenging. Revisiting the established field of crowdsourcing, we distill strategies for effective LLM chain design and identify opportunities for future research. [1/11]
English
1
11
51
7.5K
Interactive Data Lab ری ٹویٹ کیا
Michelle Lam
Michelle Lam@michelle123lam·
“Can we get a new text analysis tool?” “No—we have Topic Model at home” Topic Model at home: outputs vague keywords; needs constant parameter fiddling🫠 Is there a better way? We introduce LLooM, a concept induction tool to explore text data in terms of interpretable concepts🧵
English
5
38
203
38K
Interactive Data Lab ری ٹویٹ کیا
Vega, Vega-Lite & Altair
Vega, Vega-Lite & Altair@vega_vis·
The Vega Project is happy to announce the release of version 5.3.0 of the Vega-Altair Python visualization library. This release has been 4 months in the making and includes enhancements, fixes, and documentation improvements from 11 contributors. Highlights in 🧵
English
2
16
67
9.4K
Interactive Data Lab ری ٹویٹ کیا
Mike Bostock
Mike Bostock@mbostock·
Observable Framework 1.3 🆕 integrates @uwdata’s Mosaic vgplot, which can concisely expressive performant coordinated views of millions of data points. observablehq.com/framework/lib/…
English
5
35
270
21.1K
Interactive Data Lab ری ٹویٹ کیا
Jeffrey Heer
Jeffrey Heer@jeffrey_heer·
Interact with millions of data points in real-time with Mosaic, now with support for geospatial data. Exploring 1M taxi pickups and dropoffs in NYC:
English
6
39
341
30.3K
Interactive Data Lab ری ٹویٹ کیا
Madeleine Grunde-McLaughlin
Madeleine Grunde-McLaughlin@MadeleineGrunde·
Chaining LLMs together to overcome LLM errors is an emerging, yet challenging, technique. What can we learn from crowdsourcing, which has long dealt with the challenge of decomposing complex work? We delve into this question in our new preprint: arxiv.org/abs/2312.11681 [1/9]
Madeleine Grunde-McLaughlin tweet media
English
3
15
86
13.1K
Interactive Data Lab ری ٹویٹ کیا
IEEE VIS
IEEE VIS@ieeevis·
Join us in congratulating Dr. Leilani Battle for receiving the 2023 VGTC Visualization Significant New Researcher Award at #IEEEVIS. 🏆 👏 @leibatt is honored for her work showing how data exploration systems can slow down, confuse, bias, and even mislead analysts.
IEEE VIS tweet mediaIEEE VIS tweet media
English
1
8
75
5.3K
Interactive Data Lab
Interactive Data Lab@uwdata·
And congrats also to the other Significant New Researcher recipient, UW alum Matt Kay (@mjskay)!
English
0
1
9
1.5K
Interactive Data Lab ری ٹویٹ کیا
Jared Wilber
Jared Wilber@jdwlbr·
Really enjoying playing with @uwdata 's Mosaic, linking @duckdb with @observablehq plot feels so natural and responsive - just a joy
English
3
27
191
15.8K
Interactive Data Lab ری ٹویٹ کیا
Arvind Satyanarayan
Arvind Satyanarayan@arvindsatya1·
VisText has been a *ton* of work, and 2 yrs of solid effort. So it's exciting to (finally!) be able to talk about it, and it's gratifying to see it featured on @MIT's homepage. Lead author, @bennyjtang, has a great thread w/details below 👇 And I wanted to offer a few thoughts
Arvind Satyanarayan tweet media
Ben Tang@bennyjtang

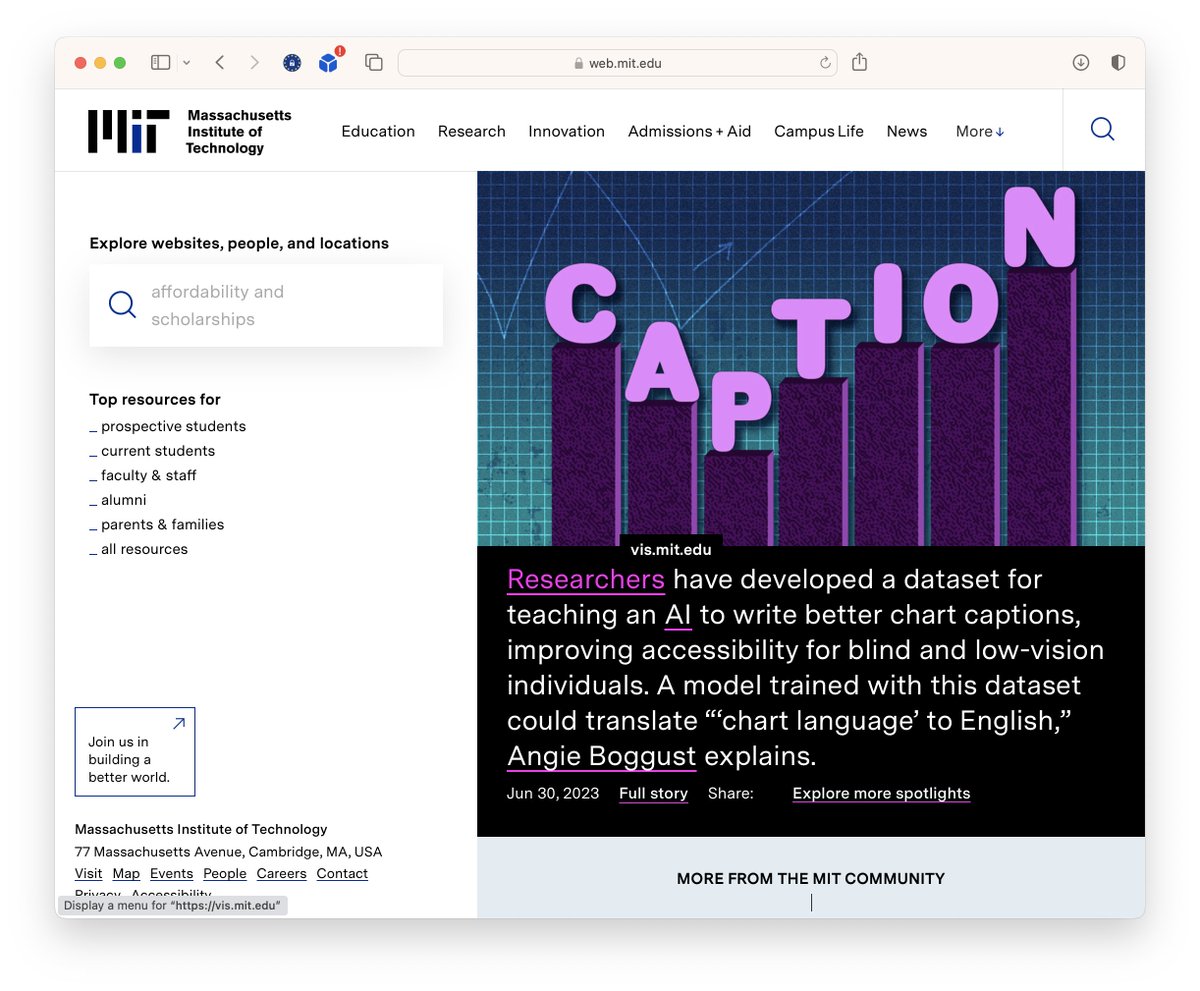
Chart captioning is hard, both for humans & AI. Today, we’re introducing VisText: a benchmark dataset of 12k+ visually-diverse charts w/ rich captions for automatic captioning (w/ @angie_boggust @arvindsatya1) 📄: vis.csail.mit.edu/pubs/vistext.p… 💻: github.com/mitvis/vistext #ACL2023NLP

English
2
27
119
25.5K
Interactive Data Lab ری ٹویٹ کیا
Hamilton Ulmer
Hamilton Ulmer@hamiltonulmer·
Mosaic looks really great! Great to see a viz library thread down to the db level. DuckDB is such a natural choice for something like this. uwdata.github.io/mosaic/
English
2
67
455
58.1K