
BTCpleb
718 posts


Gm Verona community, we’ve made some changes 😉
Follow @verona_dev and turn on post notifications.
Verona Community@verona_comm
We told you June would be a special month for XION. The wait is almost over, our biggest announcement ever is coming soon. ⏳ Follow @burnt_xion and turn on post notifications. Don’t miss this historic moment.
English

watched this video 50 times
watched a beauty of rebrand to Verona
watched their flagship 'Ero' raise $18.8M
watched AI agents prepare to do everything for us
and realized the next big problem is trust
watched it all
Verona@verona_dev
Today, XION becomes Verona, the intelligence layer for AI. This comes alongside our flagship's launch of 'ero' and its $18.5M fundraise. For five years, we've been building an internet people can believe in. Now, we're doing the same for AI.
English
@BurntBanksy Never trust Anthony Anzalone he is @BurntBanksy ,he scammed his $Xion token,same with Promethean Saga community,same with Xion Markets,I lost more then 100k$ because of his scam Xion token,you will seat in jail one day. Remember his name-Anthony Anzalone = scammer ! $Verona scam
English

feels like we’re coming out of stealth like we did back in 2023
market underestimates us, that’s fine
if you’re here you’re early
this is just the beginning
English
BTCpleb đã retweet

Hi Everyone!
We just launched Fortress Journey ( Lite version of Phoenix Macro) - our entry-level Bitcoin accumulation tracker, built for anyone who wants to start their Bitcoin journey the right way.
It costs $4.99/month same as one cup of coffee.
What’s inside:
- Connected weekly signal from Phoenix Macro. Show you where we are in the market generally.
- 6 accumulation stages from EMBER to PHOENIX - track where you are on your Bitcoin journey
- Bitcoin Freedom Number calculator find out exactly how much BTC you need to live off your stack forever.
- Portfolio performance tracking, P&L, cost basis, unrealised gains
- Live Bitcoin news terminal
- Transaction history with full edit
- Fortress AI assistant - ask anything about your strategy anytime
Signal still coming from Phoenix Macro, but no allocator, and without reserve system .
It’s something simpler and more accessible - a structured way to track your stack, understand your progress, and stay consistent.
Every subscription directly supports the continued development of Phoenix Macro. The signals,allocator, research none of it exists without people who believe in what we’re building.
If you’re already on Pro, you can access Fortress Journey inside your dashboard via the SWITCH button.
It’s cool Journey for $BTC accumulation,you will enjoy.
phoenixmacro.com/pricing.html


English
BTCpleb đã retweet
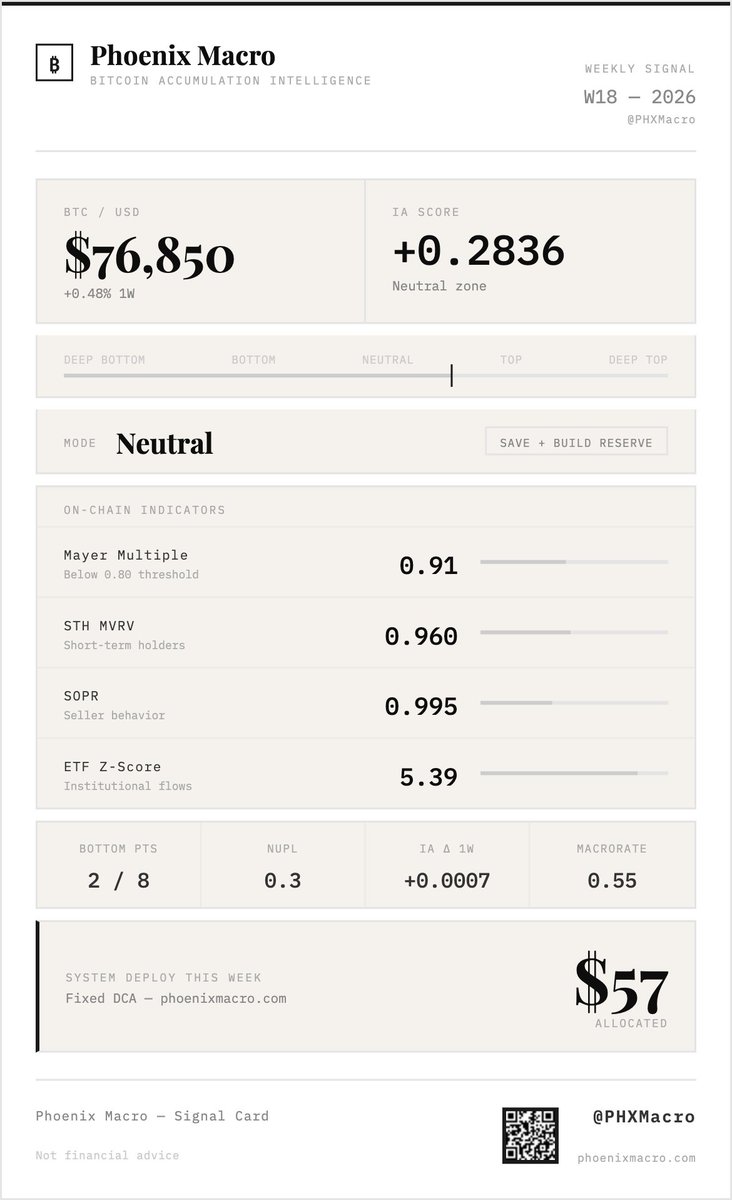
Phoenix Macro - Week 18
Quiet week structurally. BTC at $76,850, up just 0.48% on the week after last week's +4.72% surge.
The recovery from the February low is still intact, but the pace cooled sharply.
The signal card looks almost identical to last week: IA Score 0.28, Neutral mode. But underneath the surface, two small shifts worth noting.
SOPR slipped from 0.999 to 0.995. This is the metric I want to call out. Last week it was knocking on 1.0, suggesting sellers were about to exit capitulation. This week it pulled back. Sellers are still moving coins at a small loss on average. Not panic selling, but not yet "the bottom is in" either. The reset is not finished.
STH MVRV climbed from 0.94 to 0.96. Recent buyers are closer to breakeven. This is the slow grind back to confidence.
Everything else held: ETF flows still extraordinarily heavy (Z-score 5.39, unchanged), Mayer Multiple still below 1, NUPL at 0.30 in the optimism band, bottom points stuck at 2/8.
The story: institutional buyers keep accumulating aggressively into a market that has not finished its on-chain reset. SOPR going slightly the wrong way means we are not yet at the moment when the system signals a tactical bottom. Reserves stay parked. Fixed DCA continues .
The system is doing what it is supposed to do. Wait for asymmetry. Do not chase a recovery that has not yet proven itself.

English
BTCpleb đã retweet
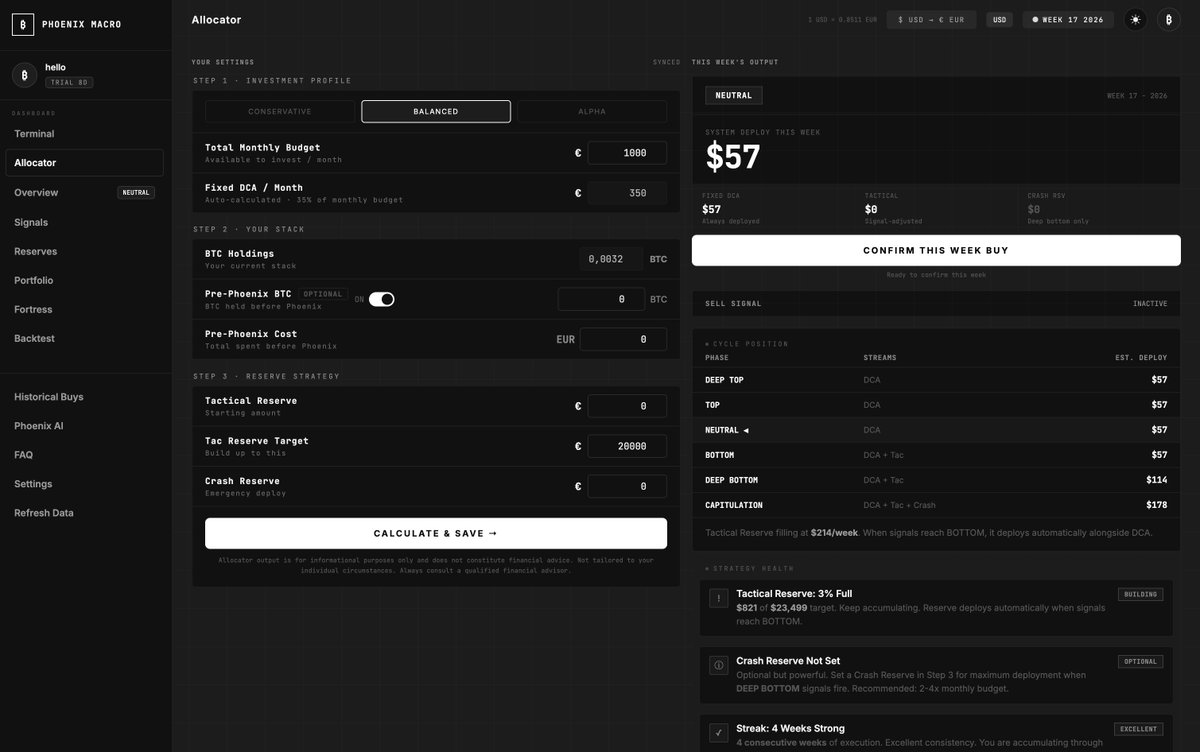
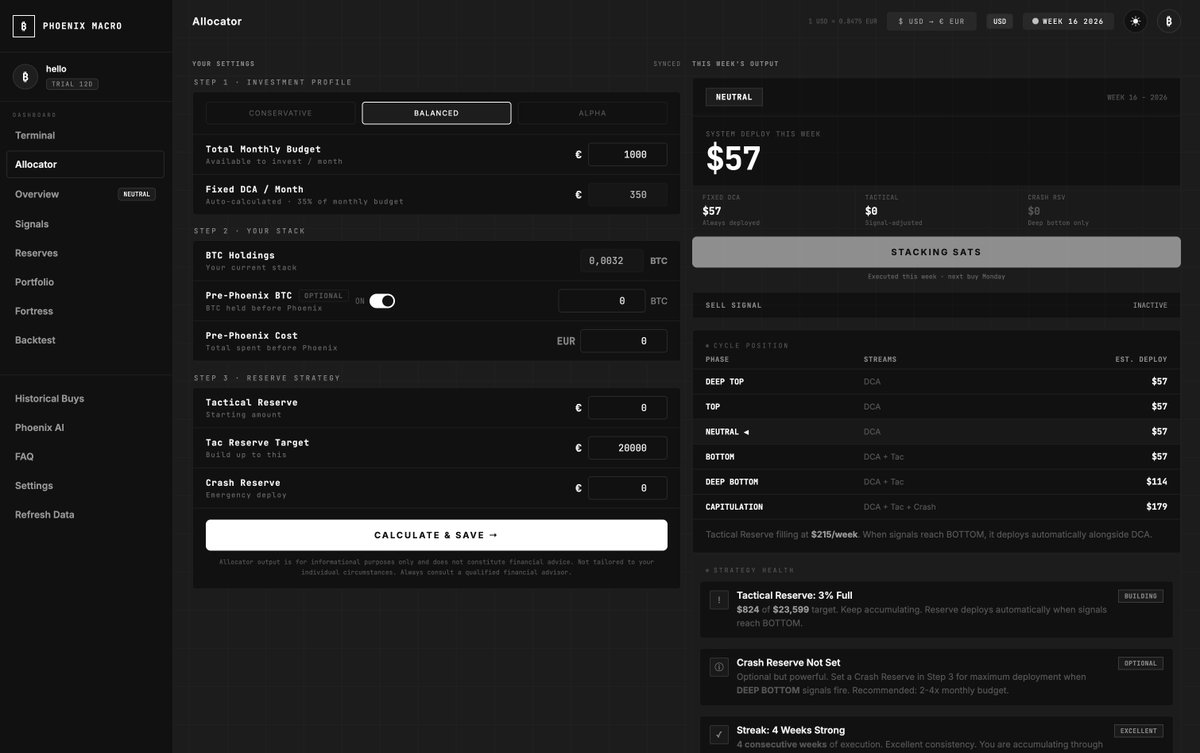
Week 17 signal is live.
Here's what moved from W16 to W17:
Price and market tone
BTC: $73,035 → $76,480 (+4.7%). Price broke out of last week's range, sitting roughly 39% below the October ATH. Second consecutive week of +4.7-4.9% gains - momentum is building, not panicking.
IA Score: +0.1995 → +0.2829
The composite moved further into neutral territory, away from "bottom." Translation: as price rallied, the aggregate on-chain read cooled slightly. Still firmly in the accumulation zone, but less compelling than a week ago. This is how a healthy system behaves - signal softens as price rises.
Mayer Multiple: 0.83 → 0.89
Price relative to the 200-day moving average. Still below 1.0, which historically marks "cheap" territory. The lift from 0.83 to 0.89 reflects the weekly rally. Label still reads "below 0.80 threshold" but the actual value is above it now - tag is stale, value is what matters. Zone: undervalued but drifting toward fair.
STH MVRV: 0.890 → 0.940
Short-term holders' cost basis ratio. Under 1.0 means recent buyers are still underwater on average. A week ago the cohort was 11% in the red; now 6%. This is the group that historically capitulates first - their stress is easing but they're not yet in profit. Below 1.0 = no euphoria, no topping pressure.
SOPR: 1.005 → 0.999
Spent Output Profit Ratio. Anything below 1.0 means, on aggregate, coins are being sold at a slight loss. Last week sellers were just barely in profit; this week they're slightly underwater. Despite the price rally, holders aren't dumping into strength - a subtle but bullish tell.
ETF Z-Score: 5.39 → 5.39 (flat)
Institutional flow intensity, standardized. 5.39 is elevated - strong inflows relative to historical baseline. Matches the tape: spot BTC ETFs pulled roughly $1B last week, the strongest print since January. Institutions are buying the recovery.
NUPL: 0.25 → 0.29
Net Unrealized Profit/Loss across the whole network. 0-0.25 is the "hope/fear" band; 0.25-0.50 is "optimism." The market just crossed that line. Not stretched, but the easy accumulation window is narrowing.
Multiplier: 0.399 → 0.566 (+42%)
Biggest move on the card. The internal sizing coefficient lifted meaningfully - the system is telling itself to size differently. Without leaking weights: the regime composition shifted, even though the surface label stayed "Neutral."
MacroRate: 0.50 → 0.50 (flat)
Macro backdrop unchanged. No regime shift in the broader environment.
Bottom Points: 2/8 → 2/8 (flat)
Two of eight bottom triggers firing. Same as last week. Not enough to unlock the Crash Reserve.
Deployment: $57 → $57 (flat)
The system is disciplined - small IA Score and Mayer changes don't move the deployment. That's the feature, not the bug. You only act when the regime actually changes.
Net read
Price ran +4.7%. Every holder-behavior signal (STH MVRV, SOPR, NUPL) confirmed the move without showing stress or euphoria. ETF flows stayed strong.
The IA Score politely cooled in response to higher prices - the system is working as designed. Still Neutral, Fixed DCA only, Tactical and Crash Reserves building.
Phoenix Macro

English
BTCpleb đã retweet
W17 done. $57 in. Same as last week.
System called it Monday 21:00. I hit buy on the exchange, logged it in the dashboard.
Took maybe 3 min . Could be less .
I didn't open any charts. Didn't check the price twice.
Five years ago I would have stared at candles for an hour before buying.
Now I just execute what the signal says and close the laptop.
phoenixmacro.com
$BTC
English
BTCpleb đã retweet
Want to share about Phoenix Fortress, it's inside Phoenix Macro. I think it'll resonate with how BTC community thinks about the long game.
Most dashboards show you a BTC balance. Fortress shows you where that balance puts you on the actual journey, across 6 stages from Ember (0.01 BTC) all the way to Phoenix (3 BTC). Each stage has a real ETA based on your DCA pace.
You enter your age, your monthly expenses, your target freedom year, and the system calculates your Freedom Number, the stack you need to live off Bitcoin from that year forward. Bear, base, or bull assumptions. Your call.
And here's the key part. Fortress doesn't work alone. It runs in tandem with the Allocator, the tactical engine that reads 8 on-chain signals every Monday 21:00 CET and tells you how much to buy this week. Allocator handles this week. Fortress handles the next 10 years.
When the Allocator tells you "deploy tactical reserve, valuation is cheap," the Fortress translates that into "you just pulled Sovereign 3 weeks closer." Every weekly buy becomes accountable to a long-term coordinate.
Now for the members who want the technical layer, here's what's running under the hood.
The nuance is in the model we chose for projecting BTC price at your target year, and that's where most Bitcoin retirement calculators get it dangerously wrong.
We use Smitty's 5th percentile Power Law.
For anyone unfamiliar: Bitcoin's 16-year price history fits a power law curve with remarkable consistency. The 5th percentile band is the conservative floor of that curve. Historically, BTC price has stayed above this line roughly 95% of the time since the genesis block on January 3, 2009.
I'll be honest about one thing upfront. 16 years is a short sample for making multi-decade projections. No model survives forever, and if Bitcoin's adoption curve, regulatory environment, or protocol fundamentals change dramatically, the Power Law breaks. What we can say is that it's currently the best-fitting statistical model we have, and the 5th percentile band is the most conservative reading of that model. That's why we chose it.
Why this matters: when you're planning how much Bitcoin you need to retire on, you don't plan for the average case. You plan for the pessimistic case. Serious long-duration financial planning works this way. Pension plans model liabilities against worst-case scenarios. Life insurance uses conservative mortality and return assumptions. Retirement sufficiency calculations for sovereign wealth funds use similar principles. We're applying the same mindset to Bitcoin accumulation.
If we used median Power Law, your Freedom Number would look smaller. But if Bitcoin underperforms expectations, you'd be underfunded and forced to sell into weakness. Using the 5th percentile floor means even in the bottom 5% of historical scenarios, you're covered.
Then we combine it with your CAGR assumption (Bear 20%/yr, Base 55%/yr, Bull 110%/yr). This represents how fast your stack compounds after you hit Freedom.
Important caveat here. CAGR assumptions represent a steady-state growth environment. Your actual returns will be path-dependent and almost certainly non-constant. Bitcoin's historical CAGR has been declining over time, which is mathematically inevitable as market cap grows. That's why we recommend reviewing your Freedom plan every 2 to 3 years as the asset matures, and re-running the math with updated assumptions.
Why do we use CAGR at all, then? Because Freedom isn't just "I have enough BTC today." It's sustainable withdrawal without depleting principal. Your stack's annual growth needs to cover your annual expenses. The CAGR is what makes the math a perpetuity instead of a countdown.
So the logic chains together. Power Law gives us the conservative projected BTC price at your target year. CAGR gives us the growth rate your stack compounds at from that year forward. The output is the stack where your yearly growth alone pays your bills.
Then comes the velocity calculation. Once we know your Freedom Number, the system calculates the monthly deploy required to reach it. If you're deploying more than required, you're on track. If less, you see the gap in dollars per week and sats per week. We also show what Bear and Bull scenarios would require, so you can see how sensitive your plan is to growth assumptions.
Why this approach is different from anything else out there: most Bitcoin retirement calculators use current price held constant (ignores growth), linear extrapolation (ignores volatility), or stock-to-flow and rainbow chart theories (too optimistic, no conservative floor). We chose Power Law because it's the best-fitting empirical model with a defined conservative band. And we chose the 5th percentile specifically because your retirement plan should survive the worst 5% of futures, not the best 50%.
The output you see on screen runs this math every time you change an input. Age, expenses, target year, growth assumption. Every parameter re-runs the calculation end to end. That's why the Freedom Number updates instantly when you toggle Bear, Base, or Bull.
This isn't a mockup or a marketing number. It's a calculation using a real statistical model, applied to real assumptions you control.
This system is built for the people who've already decided accumulation is the strategy. We're not trading. We're about discipline, math, and the long view.
Try your $BTC journey on Fortress @ phoenixmacro.com


English
BTCpleb đã retweet
6 years ago I started stacking $BTC the dumb way.
Fixed DCA, same amount every week, no matter what the market was doing.
I knew there had to be more. So I opened TradingView and started building.
First it was one indicator. Then five. Then a full Pine Script engine reading MVRV-Z, SOPR, NUPL, Mayer Multiple, 200W MA, ATH drawdown, ETF flows, RPO.
Weekly signals. Bottom detection. Capitulation alerts.
Allocator that tells you exactly how much to deploy.
Eventually I hit the wall. Pine Script can't be a product. So I rewrote the entire engine in Python. Connected it to a real backend. Built a dashboard on top.
That's how phoenixmacro.com is started .
Building every day , still not out from ideas ...


English
BTCpleb đã retweet
Our "Confirm this week buy" button is live waiting for a signal.
Signal card will be live arround 2100 UTC. Allocator set . Fixed DCA .One button . Weekly lock after.
phoenixmacro.com

English
BTCpleb đã retweet
Most Bitcoin retirement calculators are dangerously wrong.
They use current price (ignores growth), linear extrapolation (ignores volatility), or stock-to-flow (too optimistic, no conservative floor).
Here's what we built differently inside Phoenix Fortress.
open.substack.com/pub/phxmacro/p…
$BTC
phoenixmacro.com
English
BTCpleb đã retweet
Today: $AAVE -19%. $RAVE -95%. Liquidity crises.
Insider probes. Exit liquidity disguised as innovation.
Meanwhile the systematic accumulator bought the same amount of BTC they bought last week. And the week before. And will buy next week.
Boring wins. Quietly. Every cycle.
phoenixmacro.com
$BTC

English
BTCpleb đã retweet
Conviction is a feeling.
Discipline is an action.
Most bitcoiners who leave never lost the feeling.
They lost the action.
Building the stack is not about belief.
It is about behavior that survives four years of volatility without stopping.
$BTC

English
BTCpleb đã retweet
This is the Portfolio Performance tab.
Let me walk you through what you are looking at.
The left side is your stack. How much Bitcoin you hold, what you paid on average, where your break-even is, and what your position is worth right now at live market price. Everything calculated from your actual execution history inside the platform.
Below that is strategy performance. Your DCA streak tracks how many consecutive weeks you executed without missing. Your best and worst buy prices show the range of your entries so far. The average weekly deploy gives you a sense of your pace.
And the HODL comparison at the bottom measures how the Phoenix Macro strategy is performing versus simply buying and holding from day one.
Right now it shows -6.3% vs HODL. Four weeks in, during a neutral market phase, this is where it should be. The strategy is not built to beat HODL in the first month. It is built to beat it over a full cycle by deploying more capital when signals show deep value and holding reserves when the market is overheated. That asymmetry only shows up clearly after 12 to 24 months of execution across different market phases.
The right side tracks capital and risk. Total deployed, net capital at risk, and portfolio equity which combines your current BTC value with your reserve balances. The MW Return is money-weighted, meaning it accounts for the timing and size of each deployment rather than just the raw total return from day one. That is a more honest measure of how the strategy is actually performing for you specifically.
Now the Exposure Gap. This is the one that needs some explanation.
Your target exposure is 75%. That means in a fully deployed state, 75% of your total portfolio value should be sitting in Bitcoin. Right now your current exposure is 62%, which gives you an Exposure Gap of -13%. You are 13 percentage points below your strategic target.
That gap exists because you are early. Your Tactical Reserve and Crash Reserve are still largely unfilled. As you keep executing weekly, two things happen. Your BTC holdings grow and your reserves fill toward their targets. Over time the exposure gap closes naturally as the system deploys capital across the three streams each week.
The gap also serves a purpose. That 13% sitting outside your BTC position is not idle. It is reserve capital waiting for the right signal. When the system reads a bottom or capitulation phase, those reserves deploy in larger amounts. The Exposure Gap is the fuel for the moments that matter most.
At the bottom of the tab is Phase History. Right now you have 1 Bottom week and 3 Neutral weeks. This section becomes more valuable with every passing month. Over a full cycle you want to see the majority of your deployed capital concentrated in Bottom and Capitulation weeks. That concentration is the entire point of the system. It is the difference between an accumulator who bought consistently and one who bought systematically.
One year from now, two years from now, this tab will tell a story. Every week of execution adds a data point. The strategy shows its edge not in a single week ,but in the pattern that builds across an entire cycle.
Four weeks in. We keep executing.
Phoenixmacro.com - That is where the accumulation strategy lives.
$BTC

English
BTCpleb đã retweet
Bitcoin has a line that has held every major bear market since 2015.
The 200-week moving average sits at $59,960 right now. Bitcoin is trading at $75,600. The ratio is 1.26.
At cycle peaks this ratio has reached 4x, 5x, and higher.
At cycle lows it compresses toward 1.0. At 1.26 the market is sitting in mid-cycle territory.
That line is the longest-term signal in the Phoenix Macro composite. Full breakdown:
open.substack.com/pub/phxmacro/p…
$BTC
English
BTCpleb đã retweet
If you are in @cluborange, come find us in the Phoenix Macro group. That is where the accumulation strategy lives.
If you are not in @cluborange yet, join. It is where Bitcoin friends are made.
$BTC app.cluborange.org/2tmu9YEL
English
BTCpleb đã retweet
Reserves tab - what it actually shows and why it matters
Let me walk through.
You have three numbers on the left.
BTC Holdings is just what your stack is worth right now in dollars. Simple.
Tactical Reserve is cash you've set aside but haven't deployed yet. Think of it as your waiting room money. Every week a portion of your budget flows here instead of going straight into BTC. Why? Because not every week is a good week to buy aggressively. The system reads the signals and decides how much to deploy. When conditions are neutral or overheated, less goes into BTC and more sits here waiting. The progress bar shows how full it is relative to your personal target. Once it's full, that money starts deploying during dips instead of just sitting.
Crash Reserve is completely separate. This one doesn't fill from your weekly budget. Whenever a Sell signal appears at the top of your dashboard, instead of just telling you to stop buying, the system sells a portion and redirects capital into the Crash Reserve. That money is then held specifically for future extreme dips. When a 30-40% market drop occurs, a genuine panic. Most people sell in those moments. This reserve exists so you buy instead.
On the right side you have Weekly Inflows - this is where the numbers get interesting.
Fixed DCA / Week - $81. This is 35% of your monthly budget converted to a weekly number. It always goes into BTC. Every single week, no matter what the signals say. But you'll notice the Allocator this week shows $57 to buy, not $81. That's because the system adjusts the actual deployment based on current signal conditions. The difference - $24 - becomes unspent DCA. It doesn't disappear. It shows up the following week added back into your Tactical Inflow. So if you see "+ $23 DCA unspent" on the Tactical Inflow line, that's where it came from - last week's Fixed DCA that wasn't fully deployed, now added back in.
Tactical Inflow / Week - $173. The remaining 65% of your monthly budget is annualized - multiplied by 12 months and divided by 52 weeks - giving you a smooth weekly tactical number. This fills your Tactical Reserve first, then deploys into BTC during good buying moments.
BTC Exposure - 62%. This tells you what percentage of your total portfolio is currently sitting in Bitcoin. How much you hold matters just as much as when you buy. The system actively monitors this number every week - not just as information for you, but as an input into the deployment decision itself. As your BTC exposure grows, the system becomes more conservative with how aggressively it deploys. As it drops - say after a significant price correction reduces your BTC value relative to your total portfolio - the system can justify deploying more. It's a continuous balance between accumulation and overconcentration. Most DCA tools ignore this completely. They buy the same amount every week regardless of what percentage of your wealth is already in Bitcoin. This system doesn't. Your exposure level is one of the factors that shapes what the Allocator recommends each Monday.
One thing worth mentioning - there is no manual input on this page. Everything you see here is calculated automatically by the system. The numbers update in two moments: when you set up your budget and settings in the Allocator and press Calculate and Save, and when you confirm your weekly buy execution. That's it. The rest the system handles on its own.
The charts below show your BTC stack growing week over week and your cost basis versus current market price - so you can see at a glance whether you're in profit and by how much.
The whole architecture behind this - the three reserves, the weekly adjustments, the exposure monitoring - exists for one reason. To keep CAGR and Sharpe ratio as high as possible while keeping maximum drawdown as low as we can. Total return follows from that.
A question I get often - why does the system sell at all? Why not just stack forever? The honest answer is that selling a portion at the top is what funds your crash reserve. That's what lets you buy at the bottom when everyone else is panicking. If you never sell, you never have dry powder when it matters most. You accumulate more BTC in the long run by being strategic about it, not by holding through everything with no plan.
And when I say sell - I want to be specific about what that actually means. The system never sells everything. It never sells half. The maximum the system will ever reduce your holdings is around 30% - and that only happens if multiple top conditions align over time. In most cycles you'll see much less than that. Small, calculated reductions as the market peaks. Nothing dramatic.
There is one more thing people don't talk about enough. When you've already taken some profit at the top, the bear market hits differently. You're not sitting there watching your portfolio bleed with nothing in hand. You already locked something in. That changes how you feel about the drawdown completely. You're calmer, you think clearer, and you actually buy more at the bottom instead of freezing. Selling on top is not just a financial decision - it removes the emotion from what comes next.
phoenixmacro.com
$BTC

English
BTCpleb đã retweet
BTC drawdown in 2022 bear market: -75%
Phoenix Macro system during the same period: -19.9%
Signal-driven accumulation with tactical sells reduced portfolio drawdown by 4x during the worst bear market in Bitcoin history.
phoenixmacro.com $BTC

English
BTCpleb đã retweet
The market didn’t take your money.
Your plan did. Or the lack of one.
Buying all in at $90K felt right because everyone around you was doing the same thing.
That’s not analysis. That’s social proof dressed up as conviction.
English
BTCpleb đã retweet
You had $10,000 ready to invest.
You put it all in at once because waiting felt like missing out.
Now you have $5,800 in Bitcoin and $0 in reserve.
The bottom isn’t in yet.
Discipline deployed in thirds would have left you with dry powder right now.
phoenixmacro.com
$BTC
English