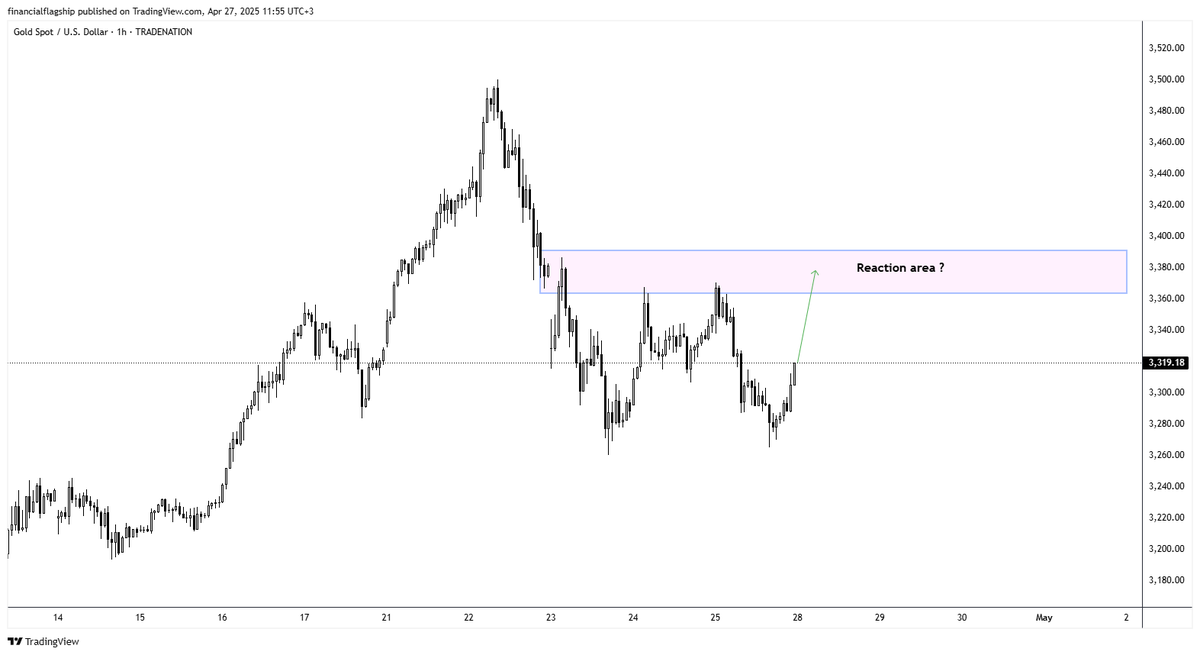
The Gold Spot price chart shows a clear potential for price movement toward the highlighted reaction area between approximately $3,360 and $3,380. After reaching highs around $3,500 on April 22, gold has experienced a significant correction, forming a series of lower highs and lows. The current price action suggests that gold may be preparing for a rebound toward this critical reaction zone, as indicated by the upward green arrow. Once gold reaches this reaction area, traders will need to closely monitor price behavior for confirmation of whether this represents a temporary bounce in a larger downtrend or the beginning of a new push toward previous highs. Key technical indicators at this level will determine if gold has enough momentum to break through resistance and potentially retest recent highs, or if sellers will emerge again, forcing another leg down toward recent support levels around $3,270-$3,280.
$XAUUSD
The GBP/JPY chart shows an intriguing setup as price has recently rebounded from its early April lows near 184.00 to approach the 191.50 level, which now represents a significant local high. If we see another break of this level followed by rejection, the pair could be forming a classic double top pattern at the highlighted resistance zone between 191.50-192.00. This technical formation would be particularly noteworthy given that this resistance area previously served as support in late March before the sharp April selloff. The red zigzag line on the chart suggests a potential path where price might make one more push up before reversing lower. Traders should watch for bearish price action confirmation at this resistance zone—such as rejection candles, bearish engulfing patterns, or momentum divergence—which would strengthen the case for a short position with a reasonable stop above the double top formation and targets potentially toward the lower support zone around 187.00.
$GBPJPY
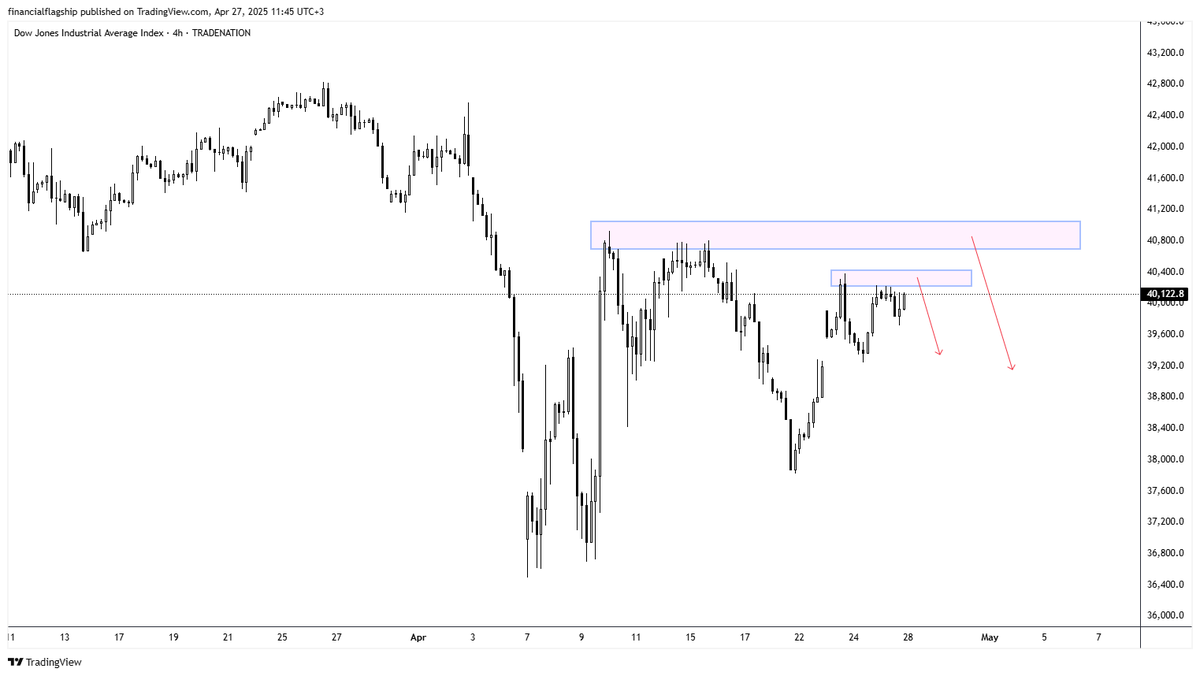
Based on the chart of the Dow Jones Industrial Average, there appears to be a significant probability of a deeper correction from the current resistance levels. The index has formed what looks like a double top pattern near the 40,400 level, with notable resistance zones highlighted in blue on the chart. After recovering from the early April selloff that took the index down to around 36,600, the Dow has been unable to reclaim previous highs, instead facing rejection at these resistance levels. This price behavior, combined with the technical setup shown on the chart, indicates that we could see a more substantial pullback in the coming sessions if these resistance levels continue to hold.
$DJIA
The market can only hurt you if you let it hurt you. The market will rally. The market will fall. Whether you are on board or not, making money or not, is inconsequential to the market. It knows nothing about you
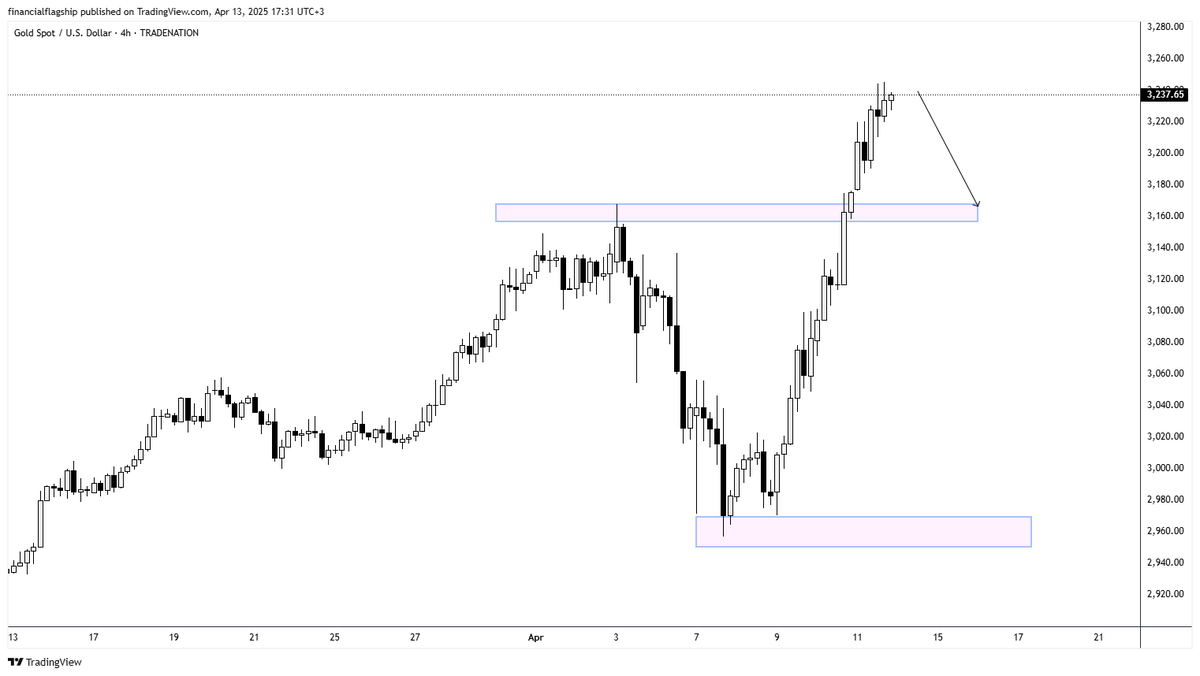
Gold has exhibited remarkable strength in recent days, surging from around $2,960 to establish new all-time highs above $3,230. After this vertical move and having reached overbought conditions, the 4-hour chart indicates a likely correction phase is imminent, with price projected to retrace toward the highlighted support zone around $3,160-3,170, which previously acted as resistance. This pullback represents a natural technical rebalancing after such an explosive upward movement and would provide an opportunity to test the market's conviction about the current bull trend. The highlighted lower support zone near $2,960 should contain any deeper corrections, though the immediate focus is on the upper support level as a probable target for this corrective wave before potentially resuming the larger uptrend. Traders should monitor price action around these key levels for signs of stabilization and renewed buying interest.
$XAUUSD
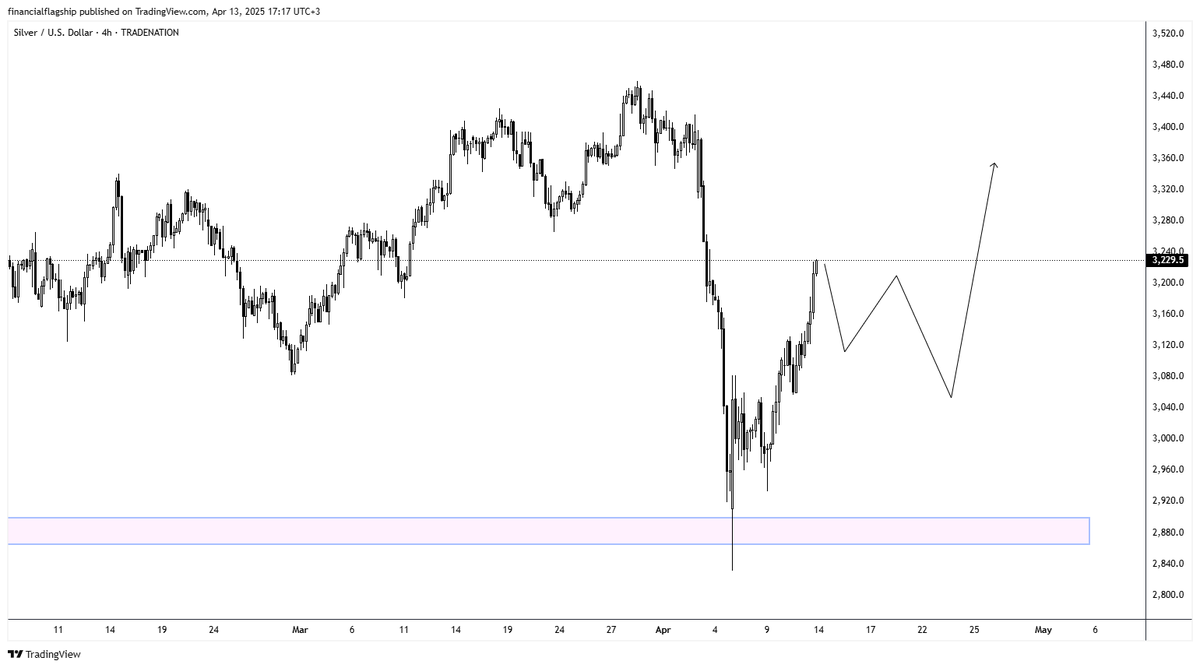
Silver ( $XAGUSD ) appears to be in a recovery phase after experiencing a sharp selloff in early April that found a bottom near $2,840. The 4-hour chart shows the price has rebounded significantly from those lows and we are expecting for it to form a correction pattern. Based on the projected price path, we can expect a period of consolidation with some downside movement to establish a higher low, potentially targeting the $3,060-3,080 support zone, before resuming the larger uptrend toward $3,350 and beyond. This anticipated correction provides an excellent opportunity for traders to prepare long setups at discounted prices, with the highlighted support area around $2,880 serving as a major floor that should contain any deeper pullbacks. The overall technical structure suggests this retracement will be temporary before bulls regain control of the market.
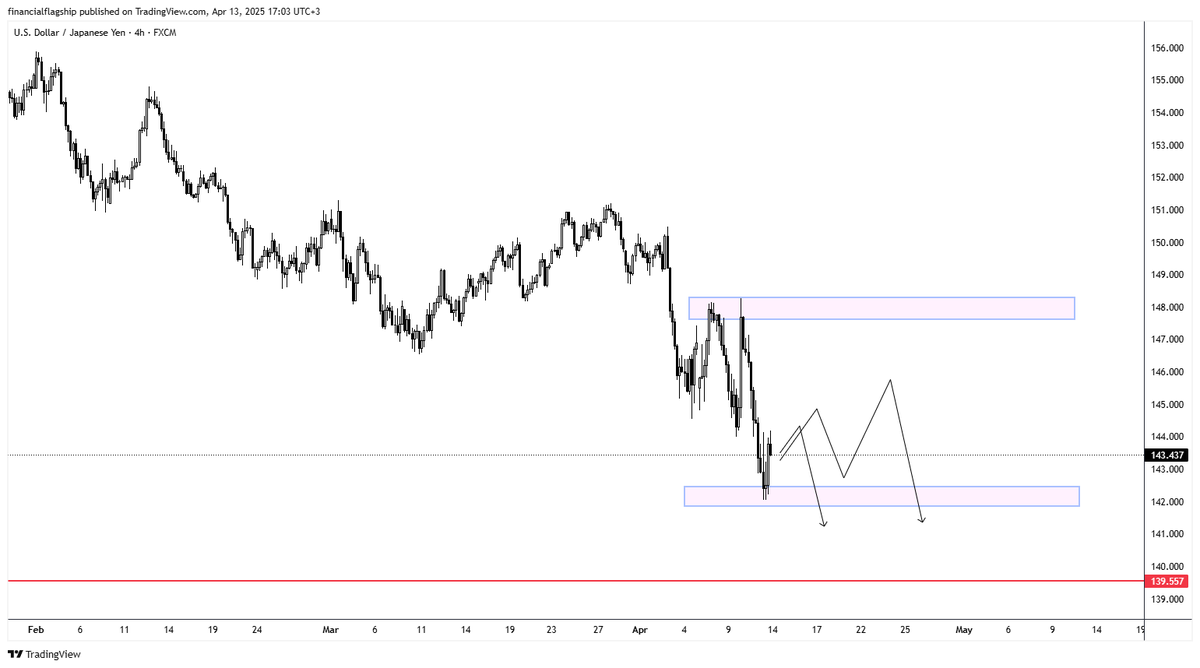
Based on the $USDJPY 4-hour chart, the higher probability move appears to be to the downside. The pair has established a clear downtrend since early February, with lower highs and lower lows, and recently broke below the significant support level around 144.00. The recent steep decline from late March to early April shows strong bearish momentum, with price now hovering near 143.50 after a modest retracement. The charted projection suggests further downside movement with potential targets around 142.00-141.00 in the short term, while the highlighted support zone around 142.00 and major support at 139.64 could attract price action. With resistance firmly established in the 147.00-148.00 region and the overall bearish structure intact, sellers appear to have control of this market for the foreseeable future.