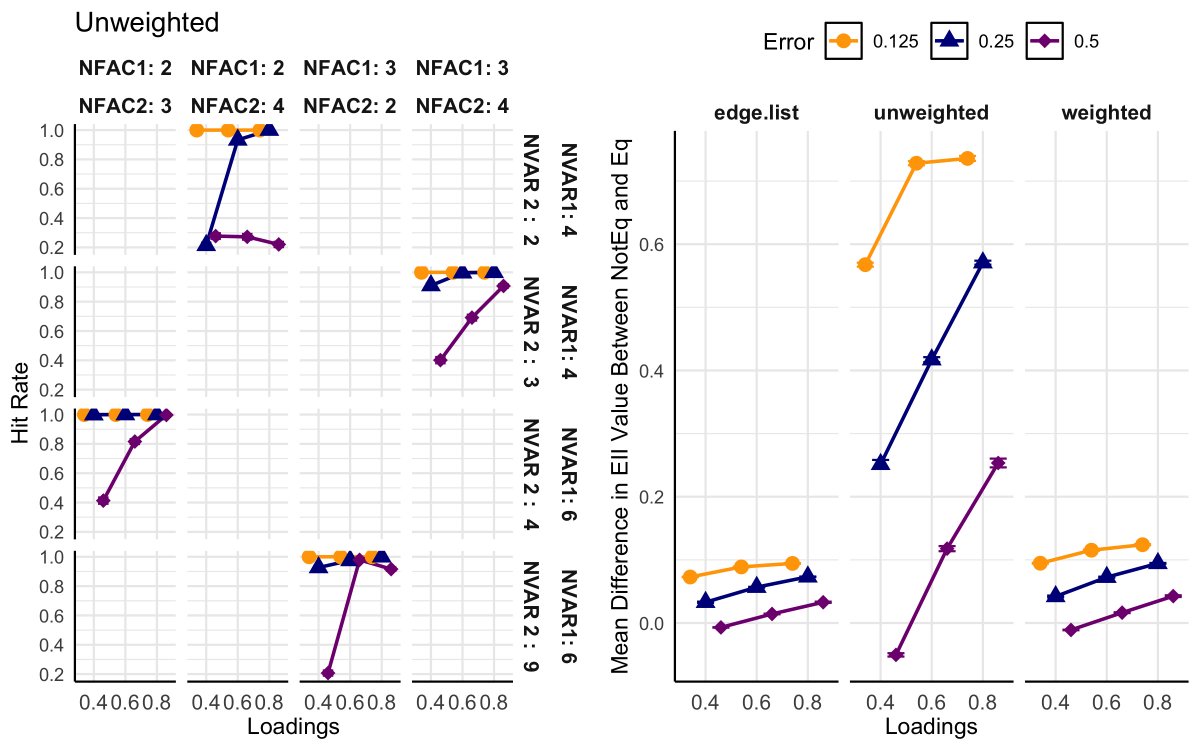
Miguel Silan 🌸

5.2K posts

Miguel Silan 🌸 banner
Miguel Silan 🌸

Miguel Silan 🌸

@MetaMethodsPH

Meta-methods, cross-cultural measurement & vulnerable populations / 3 memes in an academic coat / Filipino🇵🇭

Metro Manila / Grenoble Tham gia Ekim 2014
885 Đang theo dõi625 Người theo dõi
Miguel Silan 🌸 đã retweet
charlie
charlie@chunkbardey·
i kinda love being hungover like waking up and talking to myself like a governor in a disaster zone. We Will Rebuild
English
40
5.2K
74.1K
1.9M
Miguel Silan 🌸 đã retweet
Rafe Meager (they/them)
Rafe Meager (they/them)@economeager·
Intimate Partner Violence (IPV) against women worldwide is a major public health and inequality concern. It's not clear what causes IPV, or how to reduce it. Gaby Deschamps' JMP notes that IPV is positively correlated with motherhood, and asks if we can understand why.
Rafe Meager (they/them) tweet media
English
4
64
212
64.3K
Miguel Silan 🌸 đã retweet
Daniël Lakens
Daniël Lakens@lakens·
PhD students in metascience can sign up to present their work at the first Paul Meehl Graduate School PhD day on September 20th in Eindhoven - a one day conference to present your work and get feedback from peers. Sign up before August 15: paulmeehlschool.github.io/news/phdday_an…
English
2
20
42
6.6K
Miguel Silan 🌸 đã retweet
Sketchplanations
Sketchplanations@sketchplanator·
You get what you measure
Sketchplanations tweet media
English
2
82
377
25.4K
Miguel Silan 🌸 đã retweet
Cleve V. Arguelles
Cleve V. Arguelles@CleveArguelles·
We at @WR_Numero are calling all development organizations and non-profits to field survey questions for our nationwide March 2024 survey AT NO COST. We will draw from the pool of submitted questions and field it as part of our national quarterly surveys. Surveys for Good is our latest initiative to empower mission-driven organizations with survey data. ⬇️⬇️⬇️
WR Numero@WR_Numero

HARNESS THE FULL POTENTIAL OF DATA FOR DEVELOPMENT 🌿 We invite non-profit organizations to field survey questions to Surveys For Good, our newest initiative that aims to assist the development sector with their data needs. Visit bit.ly/WRN-S4G-Q12024 to submit questions.

Mandaluyong City, National Capital Region 🇵🇭 English
2
20
42
6.2K
Miguel Silan 🌸 đã retweet
Daan Hulsmans
Daan Hulsmans@d_hulsmans·
Very excited to share our new paper on idiographic personality networks! doi.org/10.1016/j.jrp.… Below a thread… (1/7)
English
1
10
23
3.2K
Miguel Silan 🌸 đã retweet
Pia Andresen
Pia Andresen@pk_andresen·
Yesterday we (w. Noémi Schuurman & Ellen Hamaker) submitted my first PhD paper. A short thread 1/n doi.org/10.31234/osf.i…
English
2
11
45
6.8K
Miguel Silan 🌸 đã retweet
Aidan Wright
Aidan Wright@aidangcw·
WOW! The same research question analyzed over 6 timescales in the same paper! I can' overstate how important this approach is. One of the most common limitations I see as an editor is not justifying or even speaking to timescale of the work. Would love to see more of this stuff.
PsyArXiv bot v2@PsyArXiv_bot_v2

A Matter of Timing? Effects of Parent-Adolescent Conflict on Adolescent Ill-being on Six Timescales osf.io/k2d5s/

English
3
18
151
28.6K
Miguel Silan 🌸 đã retweet
Hudson Golino
Hudson Golino@GolinoHudson·
Our new, updated paper is now finished: Towards a psychology of individuals: The ergodicity information index and a bottom-up approach for finding generalizations. Please keep reading to see how we're changing Psychology and Neuroscience using Network Information Science and Network Psychometrics... The renewed interest in intraindividual variation is partly due to advancements in technology, like smartphones, and new data collection methods, such as intensive longitudinal approaches, ecological momentary assessment, experience sampling, and so on, allowing a more detailed study of individual variations. Given the need to understand ergodic processes specific to psychological research (Fisher et al., 2018; Molenaar, 2004), the present research offers an information theoretic approach to evaluate the extent to which a system possesses ergodicity. From an information theoretical perspective, ergodicity can be framed in terms of the amount of information lost representing a set of measures as a single between-person structure (nomothetic structure) instead of as multiple within-person structures (idiographic structures). Using networks, we introduce a new metric – termed ergodicity information index (EII) – that can inform whether a set of variables should be represented as multiple individual networks (multiplex networks) or as a single, population network (aggregate network). The EII characterizes the relative algorithm complexity of the population structure with regard to multiple individual networks taking into consideration the number of underlying dimensions (e.g., communities, latent factors). The algorithm complexity of multiplex networks can be used to determine the optimal number of layers needed to represent a multiplex network and to detect structural and dynamical similarities among their layers (Santoro & Nicosia, 2020). The representation of intraindividual structures as a multiplex network and the quantification of their information relative to a single, population network structure are two central ideas in the development of our EII. How can we estimate a network structure for each individual and a population network structure for all individuals combined? The answer: using Dynamic Exploratory Graph Analysis (DynEGA). In short, DynEGA computes the n-order derivative of the each time-series using generalized local linear approximation, and then exploratory graph analysis can be used to estimate the network structure of the variables. Communities represent variables that are changing together as a function of time (when using the first-order derivative). The matrix of derivatives per individual can be stacked to generate an augmented matrix, and the resulting EGA structure is the population structure. More information about the DynEGA technique can be found in our paper (or in the original DynEGA paper). See: Figure 1 (below) Network structures estimated using Dynamic Exploratory Graph Analysis. Algorithm (or Kolmogorov) Complexity of Networks: The individual networks and population network in Figure 1 can be compared in terms of their algorithm complexity. Algorithm complexity can be used to analyze complex objects in an unbiased manner using mathematical principles (Zenil et al., 2018), and is based on the work of Kolmogorov, Martin-Löf, Solomonoff, and others. Figure 2 helps to illustrate the idea of Kolmogorov (or algorithm) complexity. The two networks with six nodes have different Kolmogorov complexity because the program needed to describe them differs in length. The “program” defining network one has the following code: - red is connected to blue, green, and purple - blue is connected to red and green - green is connected to red and blue - purple is connected to red, orange, and yellow - orange is connected to purple and yellow - yellow is connected to orange and purple While the “program” defining network two has the following code: - All pairs of nodes are connected. (See: Figure 2. Two networks with six nodes and different algorithm complexity) Network one has a higher Kolmogorov complexity because the program needed to define it is long, while network two has a lower Kolmogorov complexity because the program needed to define it is short. In sum, in information theory complexity is similar to description length. The longer the description length, the higher the complexity. This concept is also related to randomness and structure, chaos and regularity (Downey & Hirschfeldt, 2010; Shen, Uspensky, & Vereshchagin, 2022; Velupillai, 2011). Kolmogorov complexity, while challenging to directly estimate, can be approximated in networks using compression algorithms to analyze the compressed weighted edge list, providing a practical approach to measure the complexity of network structures (Morzy et al., 2017; Santoro & Nicosia, 2020). Shuffling the weighted edge list of network one and network two (Figure 2) 1,000 times, and compressing the shuffled weighted edge list for each network generates a distribution seen on Figure 3. The mean length of the compressed weighted edge list of the networks is their estimated Kolmogorov complexity. Kolmogorov Complexity of Multiplex Networks: For multiplex networks, the Kolmogorov complexity requires a strategy to encode all individual graphs into a single network. Santoro and Nicosia (2020) proposed the use of a prime-weight encoding matrix Ω that assigns a distinct prime number (p^[α]) to each individual network (i.e., each of the A layers of the multiplex networks) and sets each element Ωij equal to the product of the primes associated with the layers where an edge between node i and j exists. Figures 1 (top left), 2 (bottom left), 3 (top right), and 4 (bottom right). The prime-weight encoding matrix preserves full information about the placement of all edges of the multiplex network (Santoro & Nicosia, 2020). The prime-weight encoding of a multiplex network enables the estimation of the Kolmogorov complexity for all layers (networks) simultaneously. The prime-weight encoding uses prime numbers to uniquely “tag” each network. By using the prime numbers as “tags” for each network in increasing order (canonical prime encoding) in which each prime number is associated with the layers with the lower number of edges, the prime numbers act as unique IDs to encode which edges came from which individual networks. This enables a joint representation of all networks in the multiplex network. It also opens up the possibility of comparing these individual networks of the multiplex network with population structures, as estimated in the dynamic exploratory graph analysis technique. Santoro and Nicosia (2020) proposed a new metric for quantifying the algorithm complexity of multiplex networks that can be computed as the ratio of the (approximate) Kolmogorov complexity of the prime-weight matrix Ω of a multiplex network with A layers and the Kolmogorov complexity of an aggregated network combining all layers. The Ergodicity Information Index: In the current paper, we propose a similar strategy to quantify the algorithm complexity of the networks estimated using DynEGA. The multiplex networks are all individual networks estimated using the derivatives computed via GLLA in the DynEGA technique. Instead of comparing the algorithm complexity of Ω with a weight aggregation of the multiplex networks, it is more informative to compare it with the population network (i.e., the network estimated stacking the derivatives estimated using GLLA for all individuals). Additionally, in psychology, it is also important to consider the number of latent factors underlying the intensive-longitudinal data. Therefore, our ergodicity information index can be computed as: ξ = sqrt(FP + 1)^{[KΩ/KP∗]/log(Lχ)} Where sqrt(FP + 1) is the square-root of the number of factors estimated in the population structure using DynEGA, KΩ is the algorithm complexity of the prime-weight encoding matrix of the individual networks (that composes the multiplex network χ), KP∗ is the algorithm complexity of the prime-weight transformation of the population network (i.e., each element in the population network, P_{ij}, is transformed such that P_{ij}* = 2^{P_{ij}}), and Lχ is the number of distinct edges across the networks that make up the multiplex network (i.e., non-zero edges). One is added to the number of factors estimated in the population network to deal with unidimensional population structures. The EII (ξ) computes the amount of information lost representing a set of measures as a single interindividual structure (nomothetic structure) instead of representing the measures as multiple individual structures (within-person or intraindividual structures). Larger values of the EII indicate that the intraindividual networks encode a relatively larger amount of information with respect to the population network. The use of the EII implies a different type of ergodicity that we call *super-weak ergodicity*. In a strict definition of ergodicity, there are two central requirements: homogeneity of all participants and stationarity for all time points. A softer type of ergodicity termed *weak ergodicity*, requires only that the marginal distributions for all participants and for all time points be identical. The *super-weak ergodicity*, on the other side, doesn't require stationary for all participants (i.e., the same covariance matrix for all subjects), homogeneity for all time points (i.e., the same covariance matrix across time), or equal marginal distributions for all participants and time points. It requires a much weaker condition: the algorithm complexity of the population (or between-person) network be similar (but not equal) to the algorithm complexity of the prime-weight encoded network of all individuals. Suppose we have four people who are assessed using an eight-item questionnaire for 100 days. Persons one and two are more similar than persons three and four, although none of them are exactly equal to one another. DynEGA is used to compute the first-order derivatives for each variable and to generate a network for each individual, and two between-person or population networks: one for persons one and two, and one for persons three and four. If we calculate the correlation of the derivatives for each variable, none of them are exactly equal to the others. Figure 6 shows the heatmap of the correlation matrices (calculated using the first-order derivatives of each variable) and the resulting network structure for each person and each population with node colors representing the estimated latent factors. Figures 5 and 6. Two factors were identified in individuals one, two, and three, and four factors were identified in individual four. The population network for persons one and two indeed shows two factors, while the population network for persons three and four shows four factors. Calculating the EII (ξ), we obtain ξ = 1.24 for individuals one and two and ξ = 1.35 for individuals three and four. The ergodicity information index was computed using the Kolmogorov complexity of the weighted prime-weight encoding of the networks as discussed above. What EII (ξ) shows is that more information is lost by representing the eight measures as a single structure for individuals three and four (bottom of Figure 6, population 2) than for individuals one and two (top of Figure 6, population 1). Another way to interpret the results above is that the intraindividual networks for individuals three and four encode a relatively larger amount of information with respect to the population network, compared to individuals one and two and their population structure. Simulation: To verify the suitability of the EII to identify if intensive longitudinal measures should be represented as a set of within-person structures (multiple individual networks) or as a single, between-person or population structure (only one network), a Monte Carlo simulation is implemented. Four data conditions were systematically manipulated: sample size (50 and 100), number of variables per factor (4 and 6), number of factors (2, 3), error (0.125, 0.25, and 0.50 -- each one squared in the measurement error covariance matrix), and dynamic factor loadings (0.4, 0.6, and 0.8). Two separate set of conditions were used in the simulation. In the first, all individuals had the same number of factors (*Eq* condition). Therefore, representing these individuals using a single population structure is reasonable. In the second set of conditions, half of the subjects had the same number of factors (and variables per factor) as in the "Eq" condition, but the other half had a different configuration, with more or less factors** (*NotEq* condition). In the *NotEq* condition, when the primary group consisted of two factors, each comprising four items, the secondary (distinct) group featured four factors, each with two items. In the scenario where the main group comprised two factors, each with six items, the second group was characterized by three factors, each containing four items. When the primary group involved three factors, each consisting of four items, the secondary group exhibited four factors, each encompassing three items. In the case of the main group having three factors, each with six items, the secondary group displayed two factors, with nine items within each factor. The data was generated using the Direct Autoregressive Factor Score Model (more details on the model can be found here: Nesselroade, McArdle, Aggen, & Meyers, 2002; Zhang et al., 2008). Main Results: The accuracy of the ergodicity information index methods displayed noteworthy trends across different error levels. For a relatively low error of 0.125, the accuracy was high (unweighted = 100%, weighted = 99.98%, edge.list = 99.98%). At an error of 0.25, the accuracy decreases, but the ergodicity information index methods continued to perform well (unweighted = 91.29%, weighted = 89.16%, edge.list = 90.40%), but when subjected to a more substantial error of 0.50, the accuracy experienced a significant decline (unweighted = 59.13%, weighted = 55.05%, edge.list = 58.20%). Figure 8 shows the mean accuracy of the ergodicity information index (unweighted) per condition (left) and the mean EII difference between the "NotEq" and the "Eq" data conditions (right). In the left side of Figure 8, in conditions featuring two factors and four items per factor in the reference group, as well as four factors and two items in the secondary group, the accuracy or hit rate is nearly perfect for conditions with small error, increases from small loadings to high loadings in conditions with moderate error, but is very low for conditions with high error. In the other conditions used in the simulation, the accuracy of EII is nearly perfect (100%) for small and moderate errors, and increases with the increase in the factor loadings for conditions with a higher error. An intriguing observation is that the *unweighted* EII exhibits the highest overall mean difference. This suggests that not only does this method slightly outperform the *weighted* and *edge list* methods in terms of accuracy, but it also demonstrates the greatest differentiation between conditions. Consequently, it should be the preferred method for applied research. Figure 8. Mean accuracy of the ergodicity information index (unweighted) per condition (left) and the mean EII difference between the NotEq and the Eq data conditions (right). A Test for Ergodicity: The EII provides a relative metric for the information lost when representing the sample as a between-person, population structure relative to within-person, individual structures. Determining whether the amount of information lost is substantial requires understanding the information loss relative to when within-person structures are similar to the between-person structure. Starting with an ergodic process, the expectation is that all individuals will have a systematic relationship with the population. Destroying this relationship should result in significant loss of information between the population and individual structures. With this premise, the shared edges between the population network and each individual's network should be meaningfully, and not randomly, related. In information theory terms, the information contained in the population network should be related to an individual's network beyond what can be expected from a random process. Our EII test is based on this conjecture. The test shuffles a random subset of edges that exist in the population that is equal to the number of shared edges it has with an individual. This shuffling allows for an equivalent amount of information that is scrambled yet still shared between the population and replicate individual's network. The edges that are unique to the individual's network (i.e., present in the individual's network but not the population network) are then added to the replicate individual network. This addition of the individual's unique edges ensures that the unique information of the individual remains constant. The result is a replicate individual that contains the same total number of edges as the actual individual but its shared information with the population has been scrambled. This procedure is repeated for each individual in the sample and EII is computed. To create a sampling distribution, this process is repeated for X number of times (e.g., 1000). This sampling distribution represents the expected information between the population and individuals when a random process underlies their shared relationships. The empirical EII value is then compared against this distribution. If the underlying process is ergodic, then this procedure is expected to destroy the relationship between the population and individuals, resulting in a sampling distribution that represents information loss due to representing the system as a random process. Said differently, the shared information between the population and the actual individual networks are sufficiently meaningful and this meaningfulness gets destroyed when the information is scrambled. In contrast, an empirical EII that is non-significant or significantly greater suggests that the information shared between the population and individuals is no different than random---that is, the pattern of relationships in the individuals are no different than can be expected when the shared information between the population and each individual is random. In other words, the individuals cannot be adequately represented with the same dynamics as the population. A Bottom-up Approach to Find Generalizations If the system is nonergodic, what then? It’s plausible that ergodicity may exist at some level of the system such as sub-groups. Identifying sub-groups could reveal ergodic systems that exist in the overall system. Heterogeneity in sample composition limits our ability to establish generalizability (Gates & Molenaar, 2012; Richters, 2021). Psychological processes may manifest themselves differently from individual-to-individual, which in turn affects the extent to which a single, population-level model can generalize to all individuals (Molenaar & Nesselroade, 2012). If you’re trying to determine the average number of bedrooms in single family dwellings in the U.S., then a truly representative sampling of single family dwellings is highly desirable. But if you’re trying to determine the nature of the onset and progression of depression, a representative sample that includes a variety of paths of onset and progression is not helpful and may aggregate over paths to a point where the average representation does not generalize any single person in the sample. In our paper we introduce a novel approach for identifying sub-groups and generalizable characteristics in psychological networks by quantifying the pairwise similarity of individual network structures using an information theoretic metric. The methodology leverages Von Neumann entropy to analyze the topological features and community structures of networks. It employs a multiplex network reduction strategy based on computing Von Neumann entropy and the Jensen-Shannon Distance (JSD) to group individual networks. This process involves calculating the entropy of network laplacians and subsequently the JSD between networks. The research then uses Ward's agglomerative hierarchical clustering on these JSD values to identify potential clusters within the multiplex network. The final step involves assessing the modularity of these clusters to determine the optimal cluster solution, focusing on maximizing within-cluster similarity and minimizing between-cluster similarity. This approach marks a significant advancement in understanding and generalizing psychological processes by emphasizing a bottom-up, individual-focused analysis. Simulated and Empirical Examples: To demonstrate the statistical test for EII and the information theory clustering, we applied them to a simulated example and two empirical examples. In the simulated example, three groups were generated using the DAFS method above. The first group had 2 factors with 12 variables per factor; the second group had 3 factors with 8 variables per factor; the third group had 4 factors with 6 variables per factor. All groups had 25 individuals with 50 time points each, loadings were randomly drawn from a uniform distribution between 0.50 and 0.70, autoregressive parameter set to 0.80, cross-regressive parameter set to 0.00, variance shock set to 0.36, covariance shock set to 0.18, and error set to 0.375. These groups were first combined and the bootstrap EII test was applied. This test determined that the data were nonergodic, EII = 2.824, p = 0.020, MEII = 2.815 (SD = 0.004) (Figure 9). After determining the full sample was nonergodic, the dynamic EGA results were passed to the information theory clustering approach. This approach correctly identified the three groups that made up the sample (Figure 9). Once separated into three groups identified by the clustering approach, the EII test was applied again. For all groups, the empirical EII was significantly less than their respective sampling distributions (Group 1: EII = 1.729, p = 0.002, MEII = 1.760 (SD = 0.003); Group 2: EII = 2.01, p = 0.002, MEII = 2.125 (SD = 0.005); Group 3: EII = 2.322, p = 0.002, MEII = 2.524 (SD = 0.007)), suggesting that they were ergodic. See figure on the left of the image below. Figure 9. Simulated and empirical examples. The study investigated two empirical examples, personality and brain networks, to determine if they exhibited ergodic properties or contained identifiable clusters. The personality aspect focused on an intensive longitudinal experience sampling study of the Big Five personality traits, utilizing the Big Five Inventory-2. The personality data was found to be nonergodic (EII = 3.688, p = 0.006, MEII = 3.681, SD = 0.002), see the bottom left plot in Figure 9 above. Information theory clustering identified two clusters. Cluster 1 (44 participants) was ergodic (EII = 3.994, p = 0.002, MEII = 4.033, SD = 0.002), while Cluster 2 (75 participants) was nonergodic (EII = 3.616, p = 0.002, MEII = 3.605, SD = 0.002). Further clustering within Cluster 2 revealed six subgroups, indicating the presence of smaller groups or outliers. The procedure suggests continued analysis until ergodic subgroups are identified. The study also illustrates the population structure with examples of individuals representing the lowest, median, and highest Jensen-Shannon Divergence (JSD) relative to the population. For the brain data example, open-source resting-state data from a sample of younger (34 participants) and older (28 participants) adults, totaling 62 individuals, was obtained. This data, retrieved from a public repository, was initially used in a study that explored episodic memory differences, specifically focusing on how these differences relate to hippocampal connectivity to the default mode network (Wahlheim, Christensen, Reagh, & Cassidy, 2022). The analysis of the brain data revealed it to be nonergodic overall. However, when dividing the sample into younger and older adult groups, both groups displayed ergodic properties in their brain connectivity, suggesting their population structures adequately represent the processes within each group. Subsequent information theory clustering identified two clusters, with proportions similar to the younger and older adult groups (top right plot in Figure 9 above).
Hudson Golino tweet mediaHudson Golino tweet mediaHudson Golino tweet mediaHudson Golino tweet media
English
5
25
101
23K
Miguel Silan 🌸
Miguel Silan 🌸@MetaMethodsPH·
@galangaj I have a paper draft in my archives called “Empirical wacking is not the way to go about construct definitions” when someone in the dept said to just collect more data and it will be clearer 😊
English
0
0
1
21
Charlotte Pennington
Charlotte Pennington@drcpennington·
I'm giving a talk later this year to PhD students about 'making your PhD your own' I thought it'd be nice to gather other people's thoughts on how you made your PhD your own, & what advice you'd give to your former PhD student self! I'll share these with the students. GO! 🌻☺️
English
6
3
10
4.3K
Dr. Allison Master, @allisonmaster.bsky.social
I don't usually jump into Twitter debates, but I'm ready to offer my 2 cents on the growth mindset meta-analyses. I've already seen comments that I agree with pointing out that growth mindsets aren't intended to be considered as an overall main effect; (1/n)
GIF
English
6
32
130
77.8K
🧪🌡️❤️🛏️John Sakaluk🛏️❤️🌡️🧪
Methods Twitter folk: I’m struggling to remember a citation, where the author’s perspective is basically: “don’t use complex analyses (e.g., SEM) over simple ones (e.g., t-tests)”. Ring a bell for anyone?
English
9
3
26
18.3K
Miguel Silan 🌸 đã retweet
Pr. Maja Becker
Pr. Maja Becker@maja__becker·
The @PsySciAcc ethics committee is looking for interns! Junior researchers with a keen interest in the ethical aspects of cross-cultural collaboration welcome. Please share or apply yourself if it fits you 🤩. Call and application form: docs.google.com/forms/d/e/1FAI…
English
3
25
36
9.6K
Miguel Silan 🌸 đã retweet
Patrick S. Forscher | @psforscher.bsky.social
are any researchers still on here? i'm looking for an example of a paper where CFA is used to estimate a latent construct, and where in the second stage, the researcher tests whether a manipulation changes that estimated construct. got any leads?
English
4
5
12
5.7K
Miguel Silan 🌸 đã retweet
Jake Elder
Jake Elder@Jake_Elder52·
This is very cool! Plotting raw data for SEM
Jake Elder tweet mediaJake Elder tweet mediaJake Elder tweet mediaJake Elder tweet media
English
2
22
102
19.4K
Luisa Fassi
Luisa Fassi@FassiLuisa·
@MetaMethodsPH You did absolutely great, what a great and interesting presentation🤩
English
1
0
2
148
Miguel Silan 🌸
Miguel Silan 🌸@MetaMethodsPH·
Just experienced every presenter's nightmare. Lost my original presentation and had to recreate hours before. SIPS2023 x Project Runway. Who needs spritz if you have a stress cocktail. See ya'll in a bit!
Miguel Silan 🌸@MetaMethodsPH

#SIPS2023 Many of our psychological constructs are ultimately social constructions (loneliness, relationship quality etc). What does this mean for psychometric models? Is it even measurable, &if not, then what are we doing & what are we supposed to do? June 24, Saturday 9:30 am!

English
3
1
18
1.8K