Somos la primera plataforma de inteligencia de negocios creada para mejorar y hacer más eficiente la gestión financiera de las empresas.
#inteligenciafinanciera
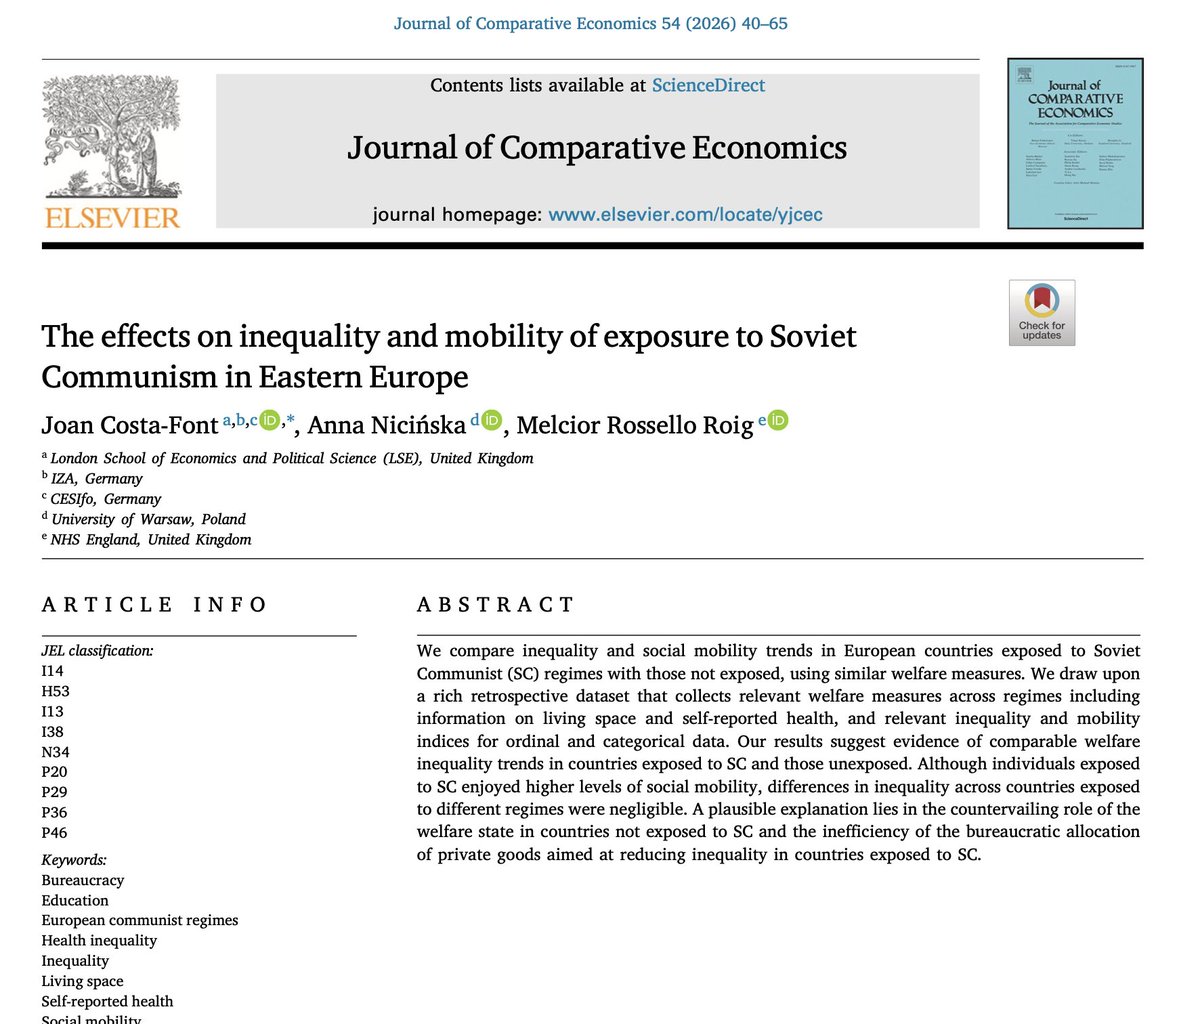
¿Logró el comunismo soviético reducir la desigualdad?
Un estudio publicado en el Journal of Comparative Economics compara países europeos expuestos y no expuestos al comunismo soviético usando medidas de bienestar comparables entre regímenes: salud autopercibida y espacio habitacional (hacinamiento). Datos retrospectivos y actuales para individuos nacidos entre 1923 y 1970.
Los resultados son llamativos. Las tendencias de desigualdad en bienestar fueron comparables entre ambos grupos de países. Los regímenes comunistas no lograron menor desigualdad en salud ni en condiciones de vivienda respecto a las economías de mercado europeas. Sí se observa mayor movilidad social intergeneracional en países comunistas (menor elasticidad entre condiciones de vida en la infancia y en la edad adulta), pero a costa de niveles de bienestar sistemáticamente más bajos.
¿La explicación? La asignación burocrática de bienes privados bajo el comunismo (vivienda, sanidad) fue ineficiente y generó sus propias jerarquías informales: acceso privilegiado para miembros del Partido, élites urbanas y personas con conexiones, frente a población rural y sin capital político.
El igualitarismo formal del comunismo soviético no se tradujo en menor desigualdad real cuando se mide con indicadores de bienestar comparables entre regímenes.
Por qué el "Chao Préstamo" es una mala propuesta👇:
La fórmula de republicanos significa que todos los años se debe pedir autorización en la ley de presupuestos para aumentar el endeudamiento. Esto abrirá todos los años la discusión del beneficio a los pensionados.
El riesgo es que, llegado el minuto, si hay presión por subir los beneficios y eso no materializa, el parlamento podría rechazar la autorización de endeudamiento y quedar sin financiamiento el beneficio. Y esto ha ocurrido en el pasado.
La fórmula acordada en la reforma protegió a los pensionados de este riesgo. Es más, el FMI hace una excepción de crear este vehículo especial para financiar los beneficios de pensiones, entre otras cosas, para evitar este riesgo.
En resumen, la fórmula de republicanos no entrega ningún beneficio a los afiliados, más bien le incorpora incertidumbre a los beneficios de los pensionados reabriendo todos los años la discusión sobre los beneficios.
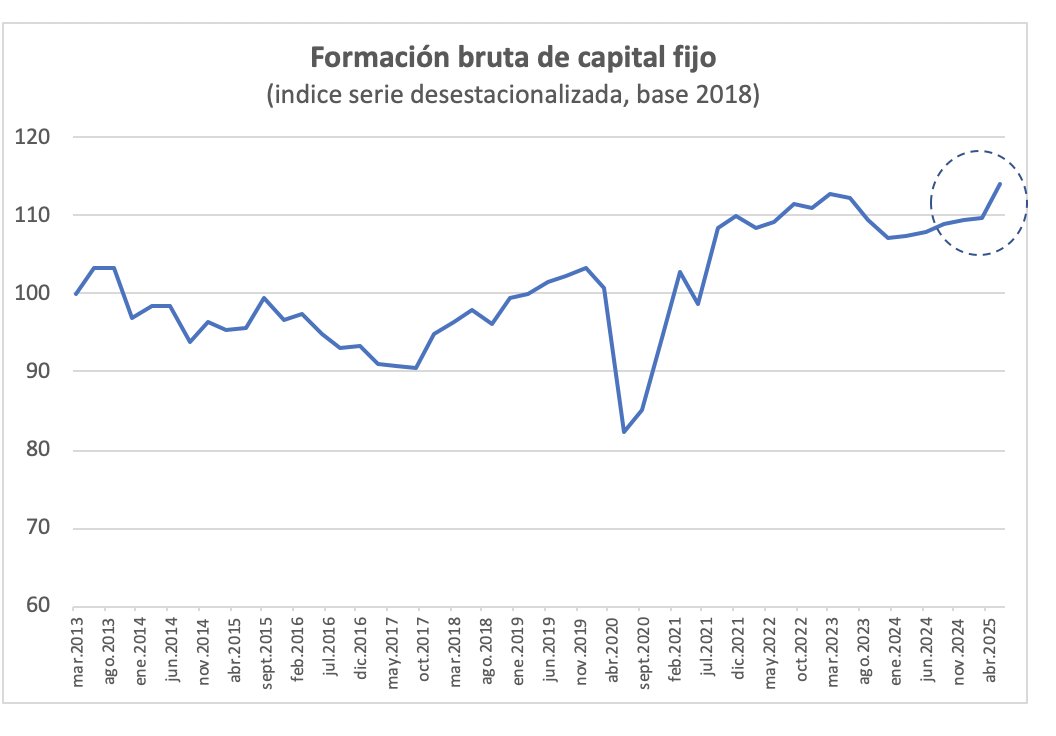
Nivel de Inversión Total alcanza su mayor nivel histórico conducida por sostenido y significativo aumento en Maquinaría y Equipo (gran parte hacia Minería). Construcción se recupera pero no supera su máximo de 2T22
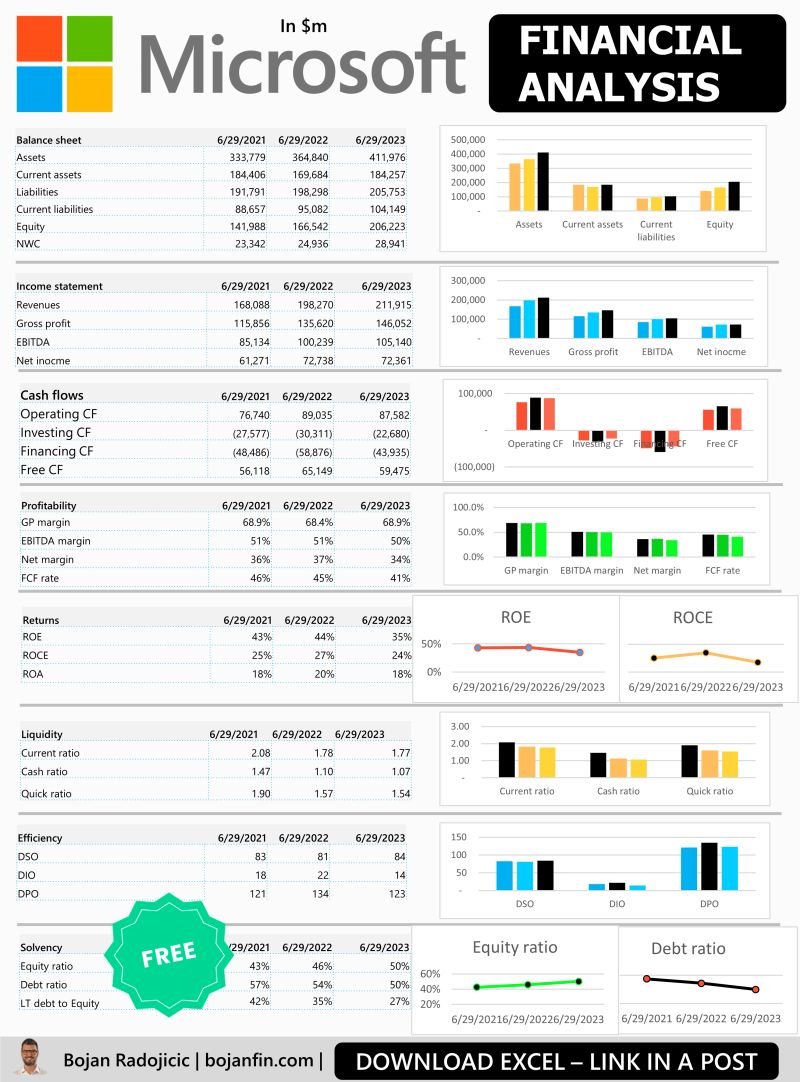
Let's practice 𝗙𝗶𝗻𝗮𝗻𝗰𝗶𝗮𝗹 𝗮𝗻𝗮𝗹𝘆𝘀𝗶𝘀 through a Microsoft example.
𝗪𝗵𝗮𝘁 𝗶𝘀 𝗶𝗻𝗰𝗹𝘂𝗱𝗲𝗱
• Balance Sheet - short and longer form
• Income Statement - short and longer form
• Visual analysis in Excel with graphics
• Cash flows
• Profitability analysis
• Liquidity analysis
• Returns
• Efficiency
• Solvency
Want this Excel model? Drop a comment and I will send you a file (important note: follow me so I can DM you)
@fintelligence2 Al contrario, proteger el dinero de clientes con montos menores al límite del FDIC ha demostrado ser especialmente valioso para muchas personas, especialmente inversionistas retail.
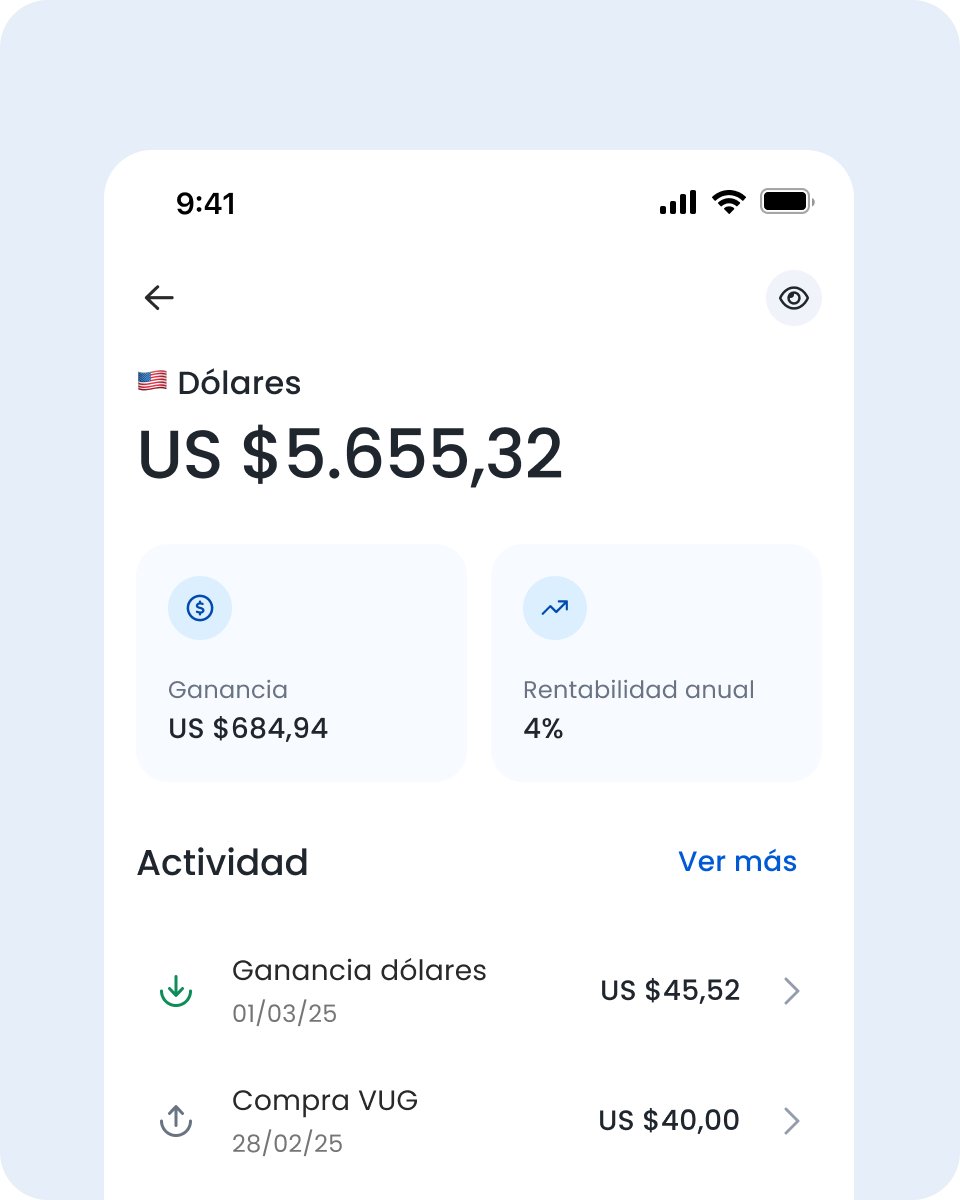
🇨🇱 En marzo les contamos de las High-Yield Cash Accounts y regalamos códigos para que algunos clientes las probaran: 4% de rentabilidad en los dólares sin invertir.
Hoy ya está disponible para todas las personas.
¿Quieres probar? entra a la App y busca la sección de Dólares.
@fintelligence2 Una diferencia de Fintual es que los dólares se mantienen en una cuenta a tu nombre en EE.UU. Ese saldo está protegido con seguros FDIC por hasta US$1.000.000 (un millón de dólares) por cliente.
Puedes revisar más acá: fintual.cl/invertir-en-do…
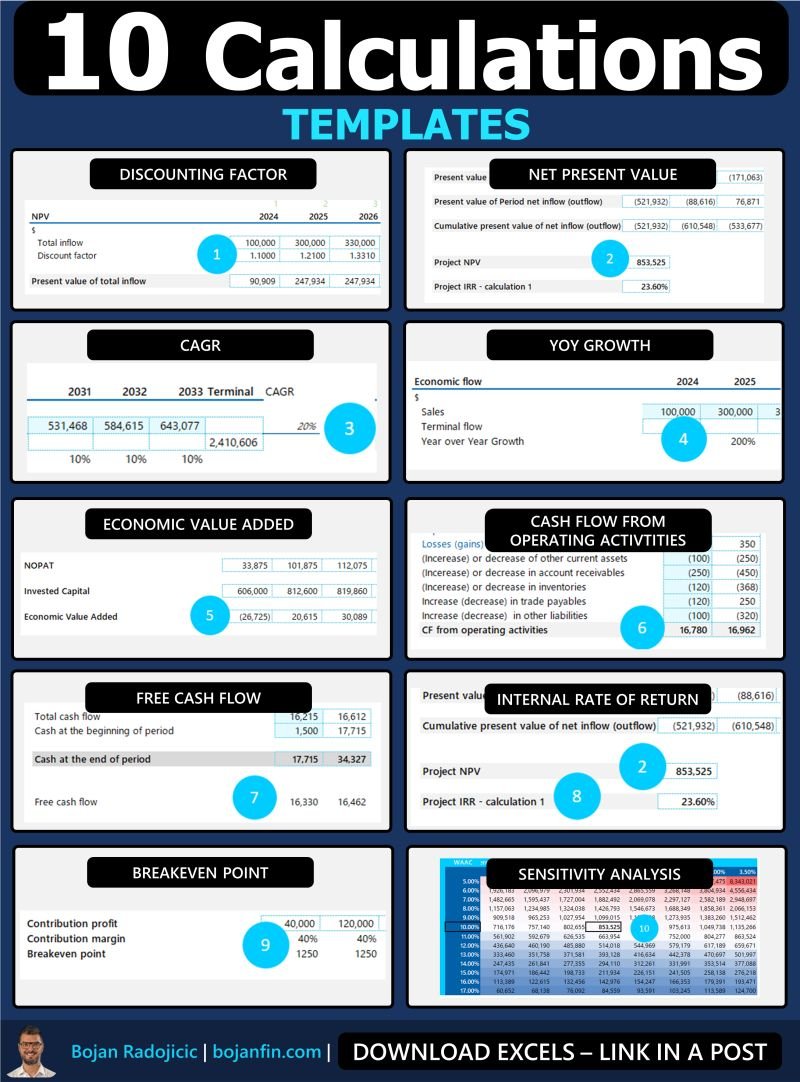
10 Finance Calculations in 1 Excel
Essential formulas. One sheet. Zero confusion.
From corporate finance to investment analysis — these are the building blocks.
💡 What’s included:
🔹 CAGR
🔹 Breakeven Point
🔹 YoY Growth
🔹 Discounting
🔹 Net Present Value
🔹 Cash Flow from Operations
🔹 Free Cash Flow
🔹 Economic Value Added (EVA)
🔹 Discounting Factor
🔹 Internal Rate of Return (IRR)
📄 Want a Free Excel file?
Drop a comment and I’ll send you the file 👇
(Important note: follow me so I can DM you)
P.S. Easter Special – 30% OFF all our materials and courses! Link in profile.
This is what happens when you push Excel beyond its limits...
A PivotTable system that makes financial analysis actually enjoyable
They said it couldn't be done...
I combined AI, Power Query & DAX to create something that shouldn't be possible:
A PivotTable system that handles your ENTIRE financial analysis in ONE CLICK.
You can analyze your entire profit and loss and drill down to multiple levels all the way to your transactions. Compare values against prior period, prior year, and even your budget - all updating with just ONE click.
This is easily worth hundreds (but you won't find it anywhere else, I've looked)
But for the next 48 hours only, I'm giving it away FREE 🎯"
Here's what makes it INSANE:
✨ ONE-CLICK updates for ANY time period
✨ Complete drill-down to transaction level
✨ Instant Prior Period & YoY comparisons
✨ Auto-calculating variances
✨ Budget vs Actual analysis
✨ Smart department filtering
The magic? I combined Power Query, Power Pivot, and AI assistance to build a system that:
- Updates your ENTIRE P&L instantly
- Drills down from summary to detail in seconds
- Compares against ANY period automatically
- Makes budget variance analysis a breeze
No more:
❌ Manual period adjustments
❌ Complex formula building
❌ Multiple spreadsheet versions
❌ Messy budget comparisons
Built with:
📊 Advanced DAX measures
📊 Smart data relationships
📊 AI-optimized formulas
📊 Automated refresh logic
Want the step by step tutorial + the template?
1. Like this post
2. Comment "send" below
3. Get immediate access
(Must follow, otherwise I can't DM)
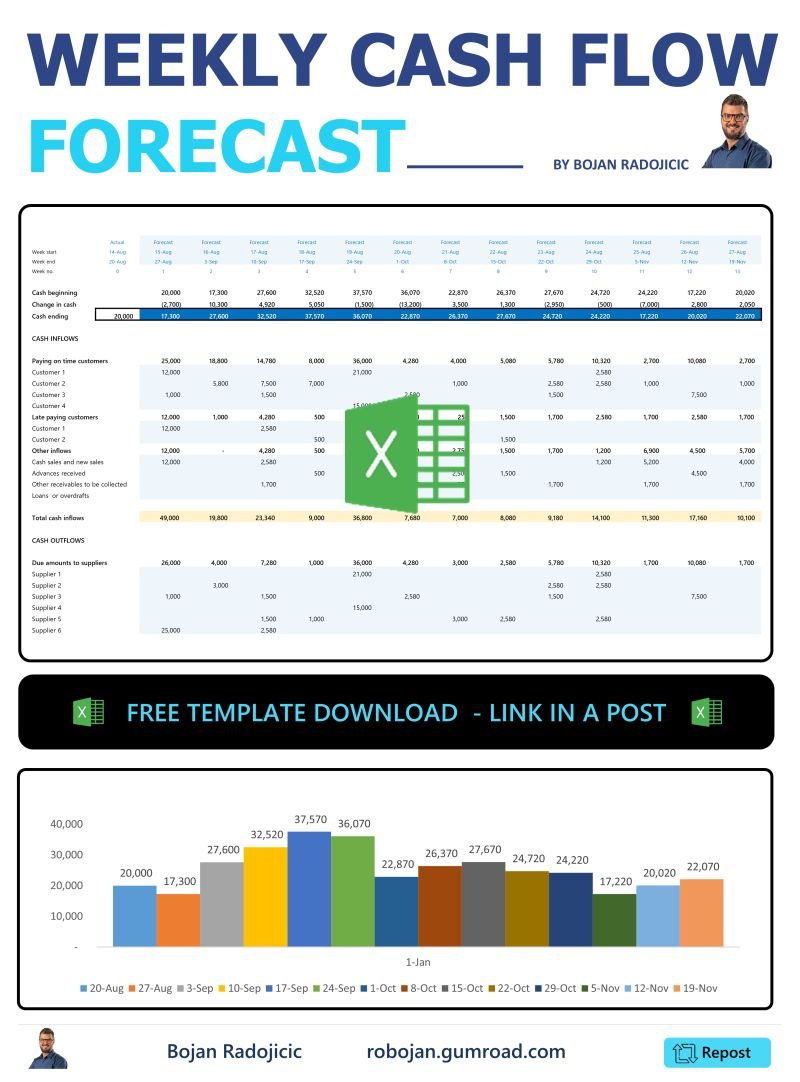
Looking for stable short-term cash flow?
I built my first weekly CF forecast 12 years ago—under pressure from a CEO and with $500K overdue.
That model saved us.
So I turned it into a simple, practical Excel tool.
📊 Here’s how I survived 👇
𝗪𝗘𝗘𝗞𝗟𝗬 𝗖𝗔𝗦𝗛 𝗜𝗡𝗙𝗟𝗢𝗪𝗦
→ Map receivables by due date
→ Flag reliable vs late payers
→ Estimate realistic collections
→ Forecast from new sales & advances
→ Include loans/overdrafts
𝗪𝗘𝗘𝗞𝗟𝗬 𝗢𝗨𝗧𝗙𝗟𝗢𝗪𝗦
→ Schedule payables by due date
→ Shift flexible supplier terms
→ Track off-book planned payments
→ Add expected advances & loan outflows
📂 Want the free Excel?
Drop a comment and I’ll send you the file 👇
(Important note: follow me so I can DM you)
3 Methods to Project Inventory in Financial Models
Here’s how I forecast inventory across different industries 👇
🔹 1. Scenario-Based
→ Uses DIO (Days Inventory Outstanding)
→ Simulates ±5–10% changes
✅ Best for: liquidity impact & sensitivity analysis
🔹 2. Component-Based
→ Breaks into Raw Materials, WIP, Finished Goods
→ Applies Days on Hand by type
✅ Best for: manufacturing & complex supply chains
🔹 3. Roll-Forward Method
→ Start balance + Purchases − COGS − Write-offs
→ Great for short-term precision & recon
✅ Best for: retail & high-volume businesses
📊 Want the Excel template?
Drop a comment and I’ll send you the file 👇
(Important note: follow me so I can DM you)
Which method do you prefer in your modeling?
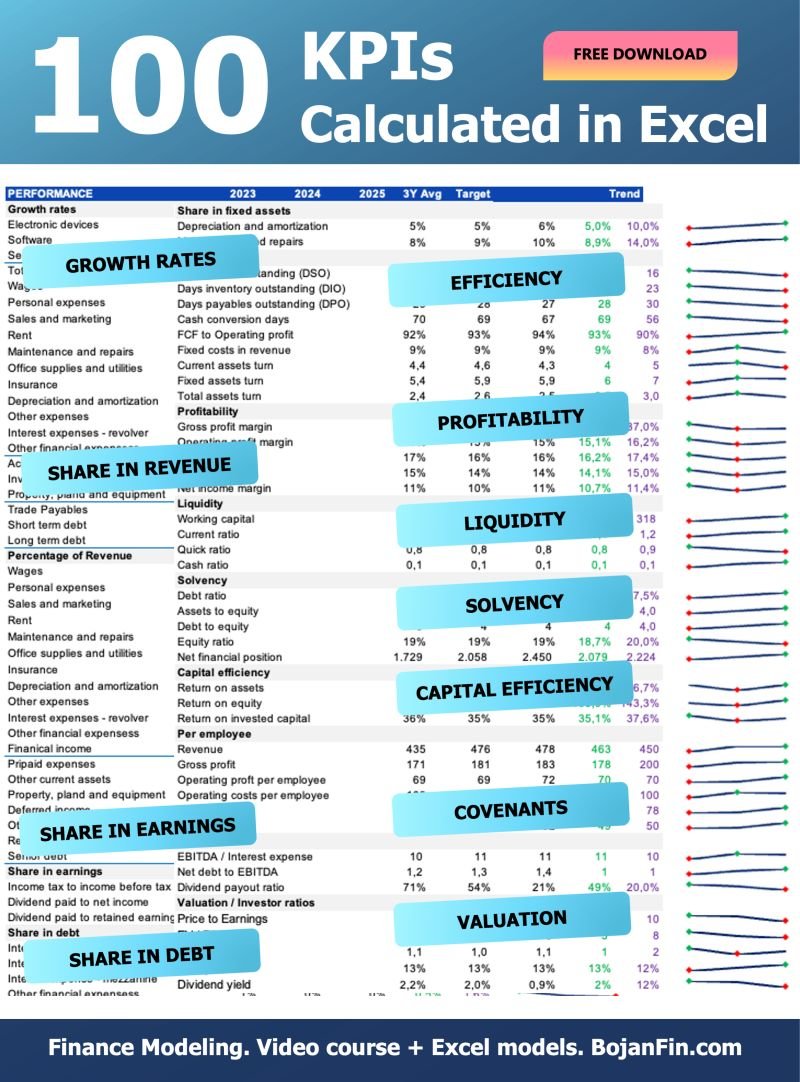
Just dropped: my FREE Excel Calculator with 100 Essential Financial KPIs 🚨
It’s built to simplify your financial analysis & power your decisions. One spreadsheet. Everything you need.
Includes:
📊 Performance & Growth – Revenue trends & growth rates
💸 Expense Analysis – Wages, S&M, rent, ops
📈 Profitability – Gross margin, EBITDA, net margin
💧 Liquidity & Solvency – Ratios & working capital
💰 Efficiency & Valuation – ROA, ROE, P/E, EV/EBITDA & more
Perfect for analysts, CFOs, business owners.
Drop a comment 👇 (Important: follow me so I can DM you the Excel)
Break Even Analysis (Template)
Every finance pro and entrepreneur needs this.
It shows you exactly how much to sell to stop losing money.
Here’s what’s inside 👇
✅ Visual Break-Even Charts
No more staring at numbers—see exactly where your break-even point hits with clean, auto-generated visuals.
✅ Cost Breakdown Dashboard
Track every fixed & variable cost. No more wondering where your money’s going—it’s all mapped out.
✅ What-if Scenario Engine
Thinking of raising your prices or cutting costs? Plug in your ideas and instantly see the impact. Live sensitivity analysis.
✅ Contribution Margin & Profit Calc
Understand what each unit sold actually brings in after costs—so you can price smarter.
✅ Zero Excel Skills Needed
Just enter your numbers. The dashboard updates everything for you. Clean, simple, fast.
Want the template?
👉 Share and comment "Template," & I’ll send it to you.
How do you know if a project is really profitable? 🤔
Making the wrong investment decision can cost millions—don’t rely on gut feeling. Use the right metrics to evaluate!
📉 Without proper project evaluation:
❌ You might overestimate profitability
❌ You ignore time value of money
❌ You risk investing in the wrong project
❌ You may destroy value instead of creating it
✅ Key Metrics You Should Use:
📌 Net Present Value (NPV) – Measures value creation
✔️ NPV > 0 → project adds value
📌 Internal Rate of Return (IRR) – Break-even discount rate
✔️ IRR > WACC → project is profitable
📌 Profitability Index (PI) – Value per $1 invested
✔️ PI > 1 → good investment
📌 Economic Value Added (EVA) – True economic performance
✔️ EVA = Operating Profit – Cost of Capital
📊 Bonus: Sensitivity Analysis
🔄 What if revenue drops 10%?
📉 What if costs increase?
⚠️ What if interest rates rise?
💡 Want a FREE Excel tool that calculates all of this?
📌 Drop a comment, and I’ll DM you the Excel file! (Important note: follow me so I can DM you)! 👇
Which metric do you rely on the most for project evaluation?
My clients pay me thousands to design cash flow dashboards for them
I just created the most POWERFUL cash flow dashboard I've ever built... and because today is Christmas, for the next 48 hours, you can grab it FREE (instead of $97).
Here's why this is so powerful:
🎯 Instantly see your cash position with stunning visualizations
🎯 Track every dollar movement with automated waterfall charts
🎯 Spot trends before they become problems
🎯 Make cash forecasting actually enjoyable (yes, really!)
The magic happens in two key views:
Rolling cash balance tracker
Dynamic cash movement breakdown
No more:
❌ Digging through statements
❌ Manual cash tracking
❌ Confusing stakeholder updates
❌ Surprise cash crunches
Just beautiful, instant insights that update automatically.
Want to transform your cash flow reporting?
1. Like this post
2. Comment with "send" below
3. Get immediate access
(Must follow, otherwise I can't DM)
The 5-second financial health check that could save your company 🏥
Never miss a financial warning sign again with all critical metrics in ONE dashboard.
⚠️ And you can get it for free in the next 48 hours!
This Financial Health Dashboard tracks everything you need: 📊
➡️Overall Status: Good/Critical indicator 🟢🔴
➡️ARR: Track recurring revenue growth 📈
➡️Gross Margin: See profitability at a glance 💰
➡️Working Capital: Monitor operational runway 🏦
➡️EBITDA: Measure true operational performance 📋
➡️Net Margin: Gauge profit efficiency 💸
➡️CAC: Control acquisition costs 💲
➡️Cash Out Date: Know exactly when you'd run out of money ⏱️
Why CEOs love this dashboard:
→ Color-coding shows problems instantly
→ Comparison to last quarter built-in
→ All metrics update automatically
→ One-page view for quick decisions
Grab it FREE for the next 48 hours:
1. Like this post 👍
2. Comment "send" below 💬
3. Repost this tweet
4. Get immediate access 🚀
(Must follow, otherwise I can't DM)