SamZa
65 posts


SamZa
@toolmal
Taxonomist/Botanist/Orchidaceae/Medicinal plants/Plant conservation
The Royal Botanic Garden Kew Tham gia Şubat 2022
343 Đang theo dõi237 Người theo dõi

SamZa đã retweet

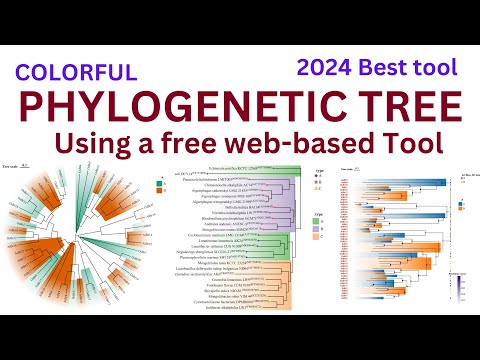
Would you love creating colorful Phylogenetic Trees using a Free 🆓 web-based tool.
Here is full tutorial
youtu.be/djfpSq26akI
#bioinformatics #phd #DataScience
YouTube

English


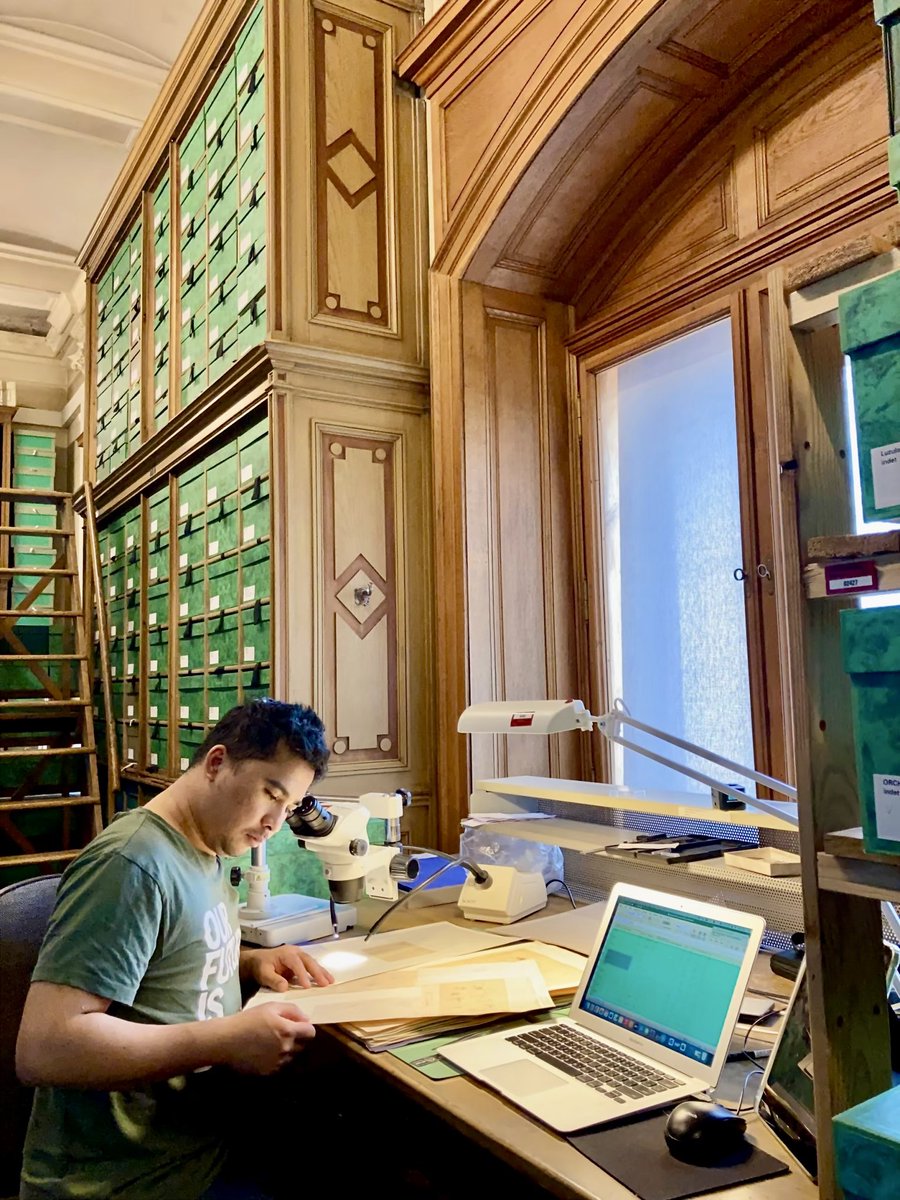
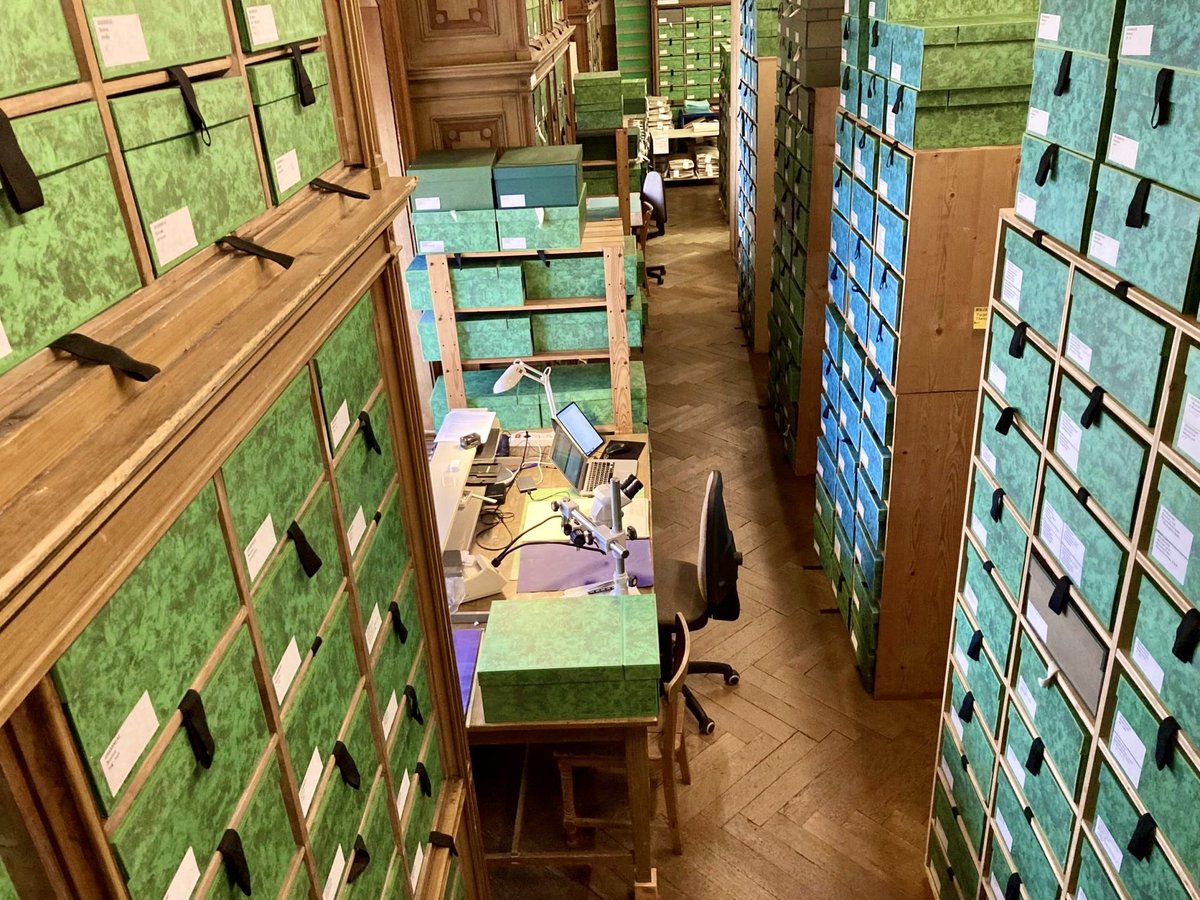
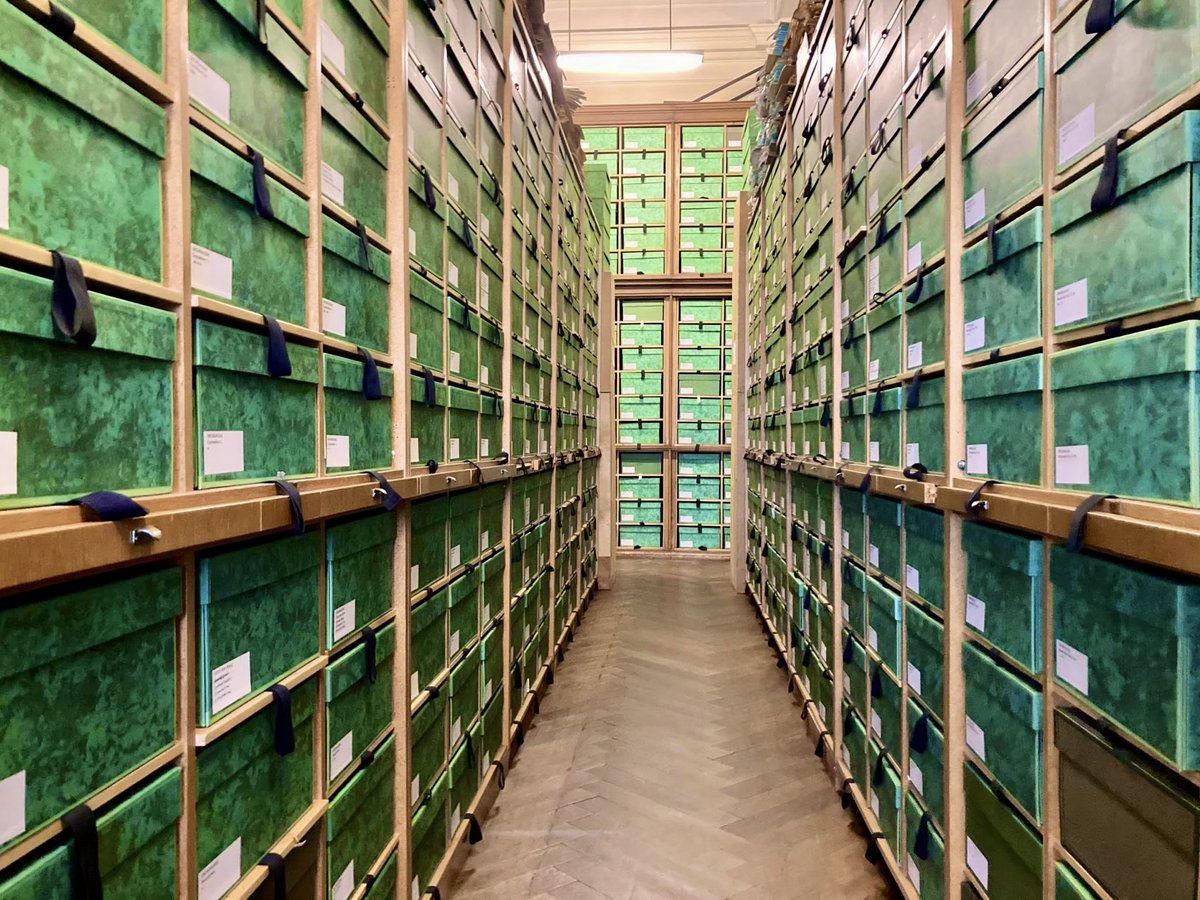
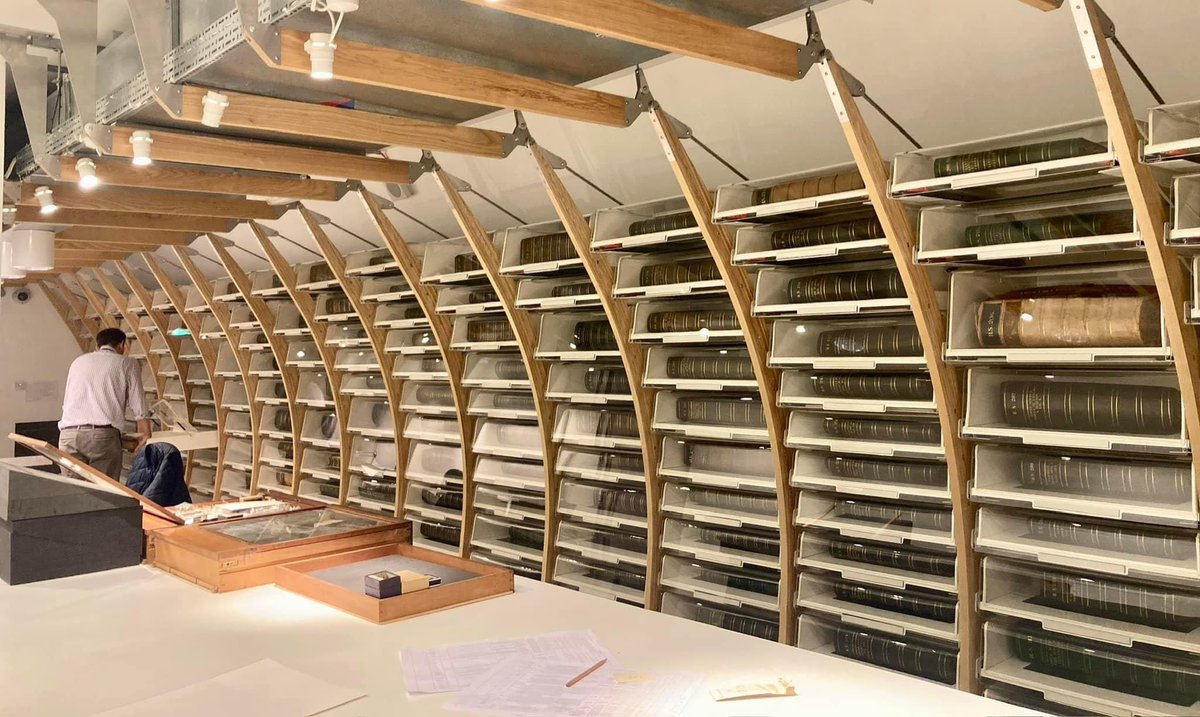
Kew's library is one of the largest collections of published botanical information in the world. The taxonomy and systematics of wild plants are main subject area here. #kew #kewlibrary #kewgardens


English
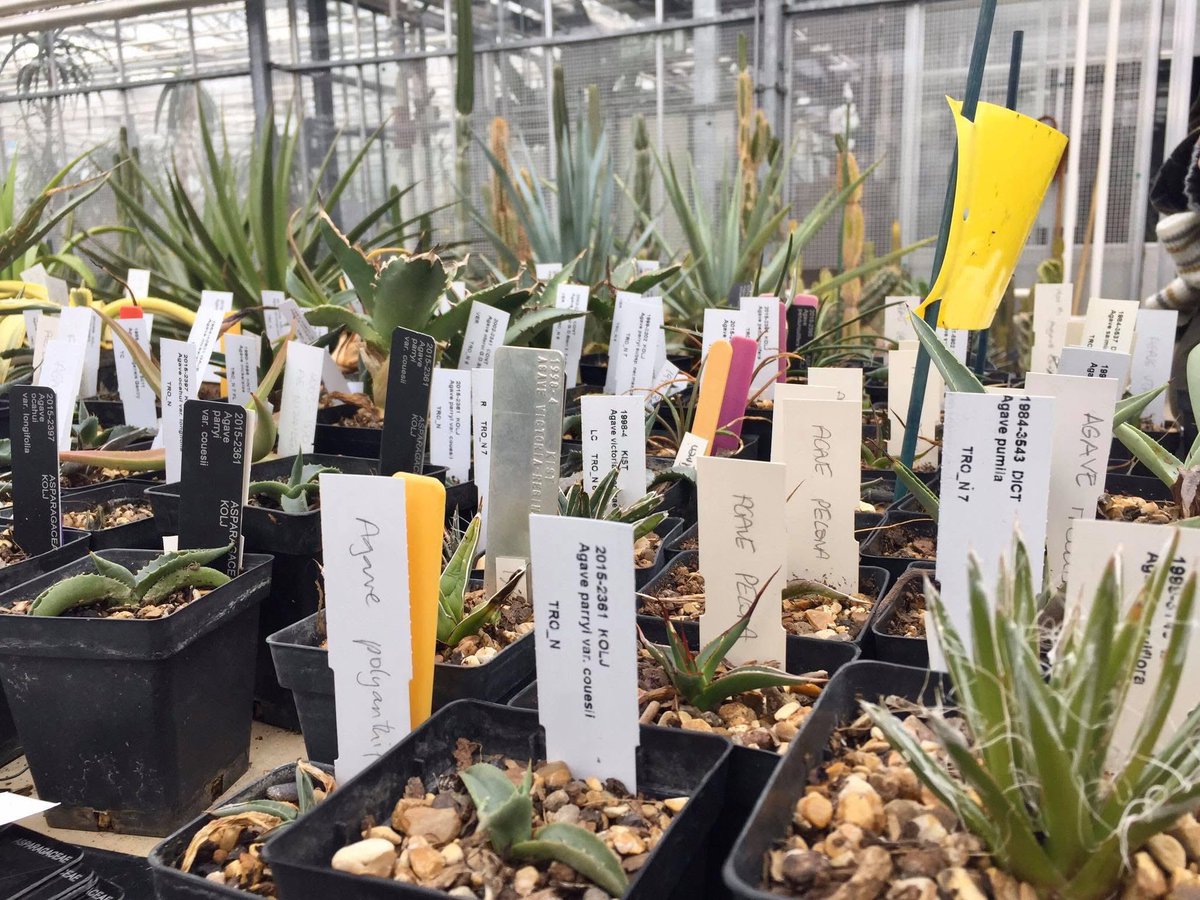
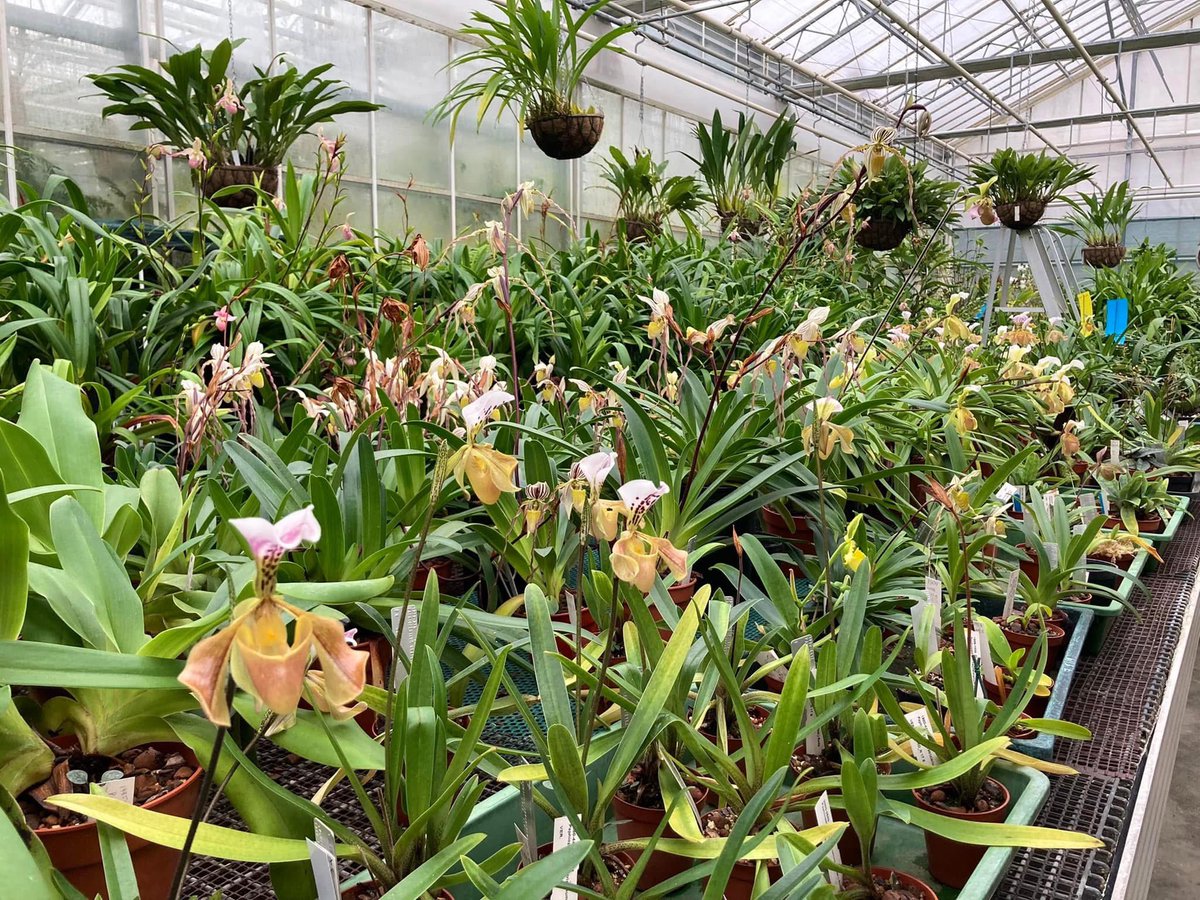
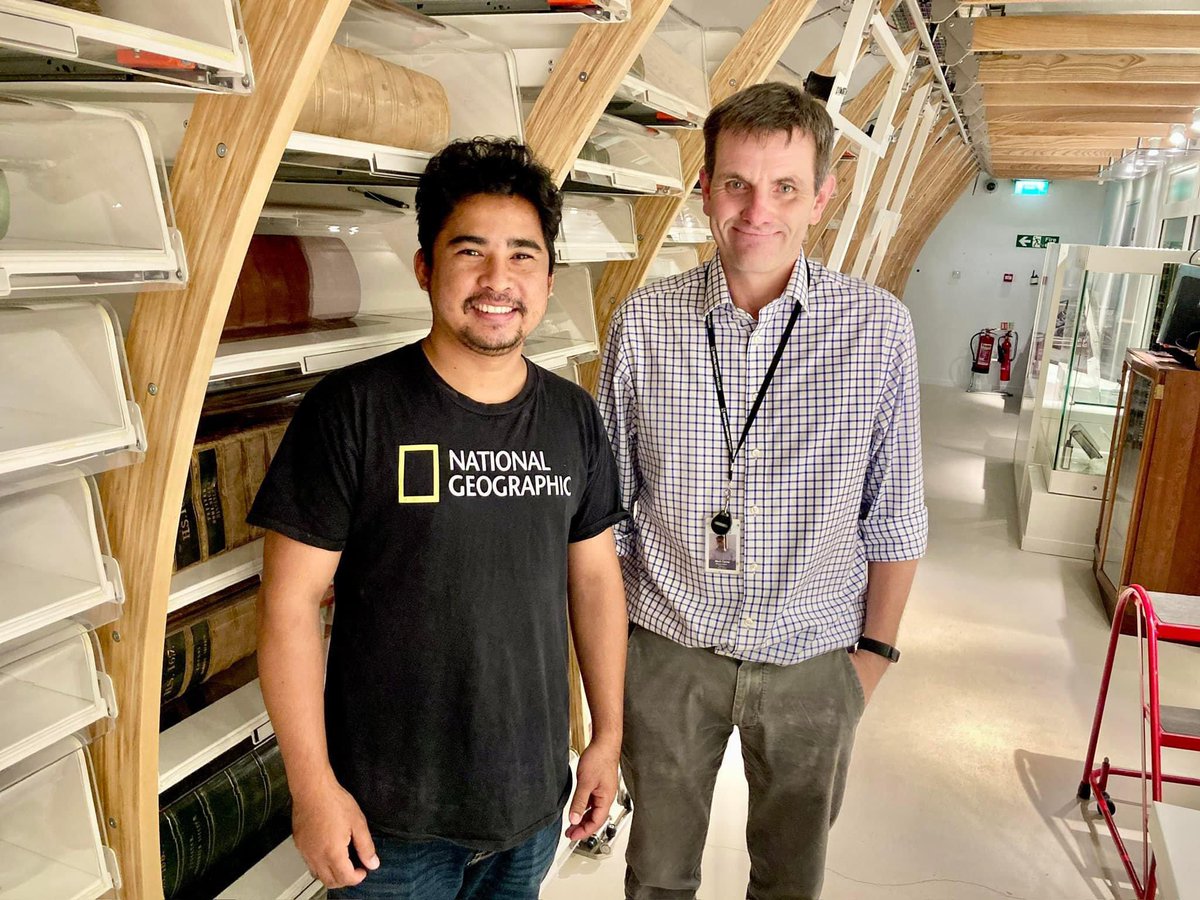
Tropical Nursery with c. 10,000 species from 21 climatic zones for research, conservation and our botanic gardens. #kew #kewgardens


English
Sir William Jackson Hooker, Charles Darwin, and Sir Joseph Dalton Hooker at Kew Herbarium #kewherbarium #kew #kewgardens

CY


SamZa đã retweet

New!
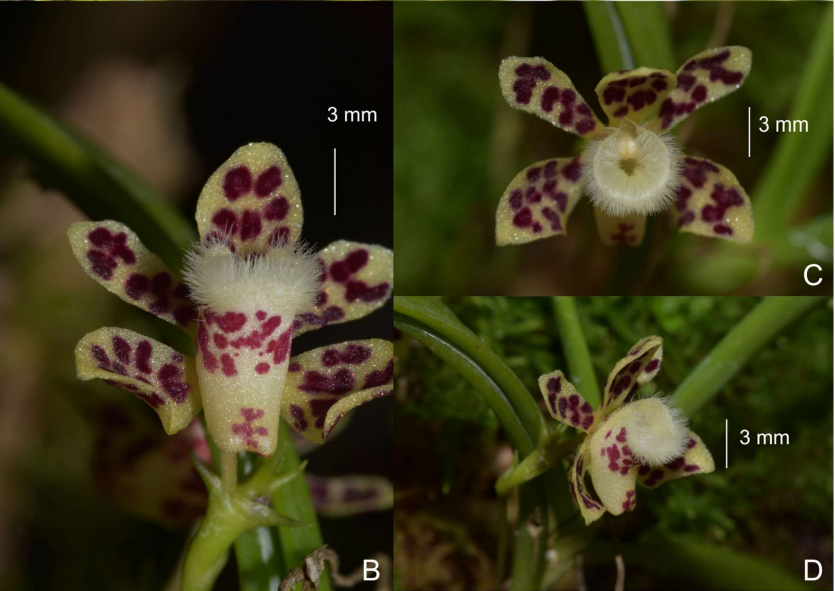
Eleven species of Thrixspermum (Orchidaceae: Vandeae: Aeridinae) newly recorded from Thailand
taiwania.ntu.edu.tw/abstract/2030
Excellent work by Sam! @toolmal
#orchid #taxonmy #Thailand @BotanyRNG @KewScience @nparksbuzz @UniofReading
English
SamZa đã retweet

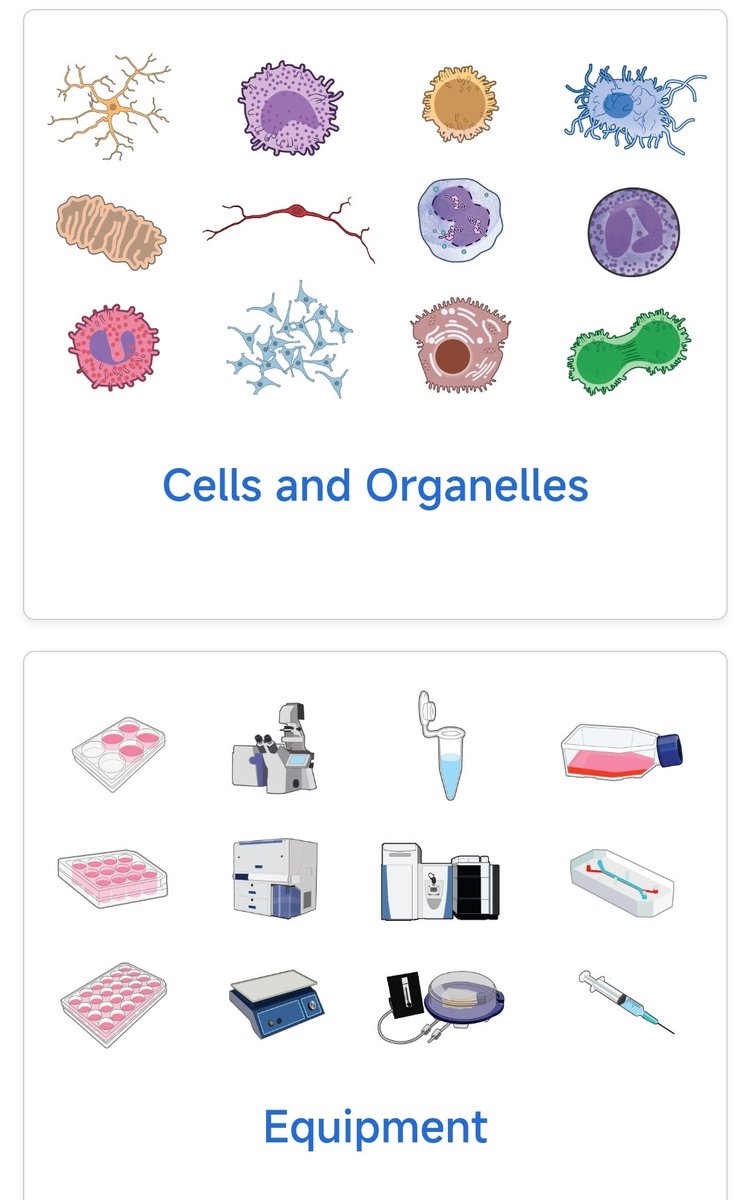
🚨 Great alternatives to BioRender are now available!!
📢 @NIAIDNews offers a collection of public figures and icons for everyone to use. Check it out at bioart.niaid.nih.gov
English
SamZa đã retweet

How to Write and Publish a Scientific Paper ( 9th Edition) Book
Download Link in Comment

English
SamZa đã retweet

When applying PCA, interpreting the relationship between the principal components is crucial. However, analyzing more than two components can get tricky. Fortunately, PCA 3D plots can help.
A 3D plot visualizes high-dimensional data reduced to three principal components, revealing patterns, clusters, and outliers that may not be visible in 2D plots. It makes the data more interpretable and provides deeper insights into the underlying structure.
Here's a quick guide to implementing a 3D PCA plot in R:
1️⃣ Prepare Data: Clean and preprocess your data, ensuring all variables are numeric by removing any categorical variables.
2️⃣ Perform PCA: Apply PCA to the preprocessed data using prcomp() and extract the component scores.
3️⃣ Create the 3D Plot: Use plot3d() from the rgl library to visualize the results in three dimensions, creating an interactive 3D scatter plot.
For a detailed step-by-step tutorial, check out my tutorial created in collaboration with Paula Villasante Soriano: statisticsglobe.com/3d-plot-pca-r
I have also developed an extensive online course on PCA, which explains the theoretical concepts and practical applications in R programming. Further details: statisticsglobe.com/online-course-…
#VisualAnalytics #Python #datascienceenthusiast #database #DataViz #RStats #DataAnalytics

English

SamZa đã retweet

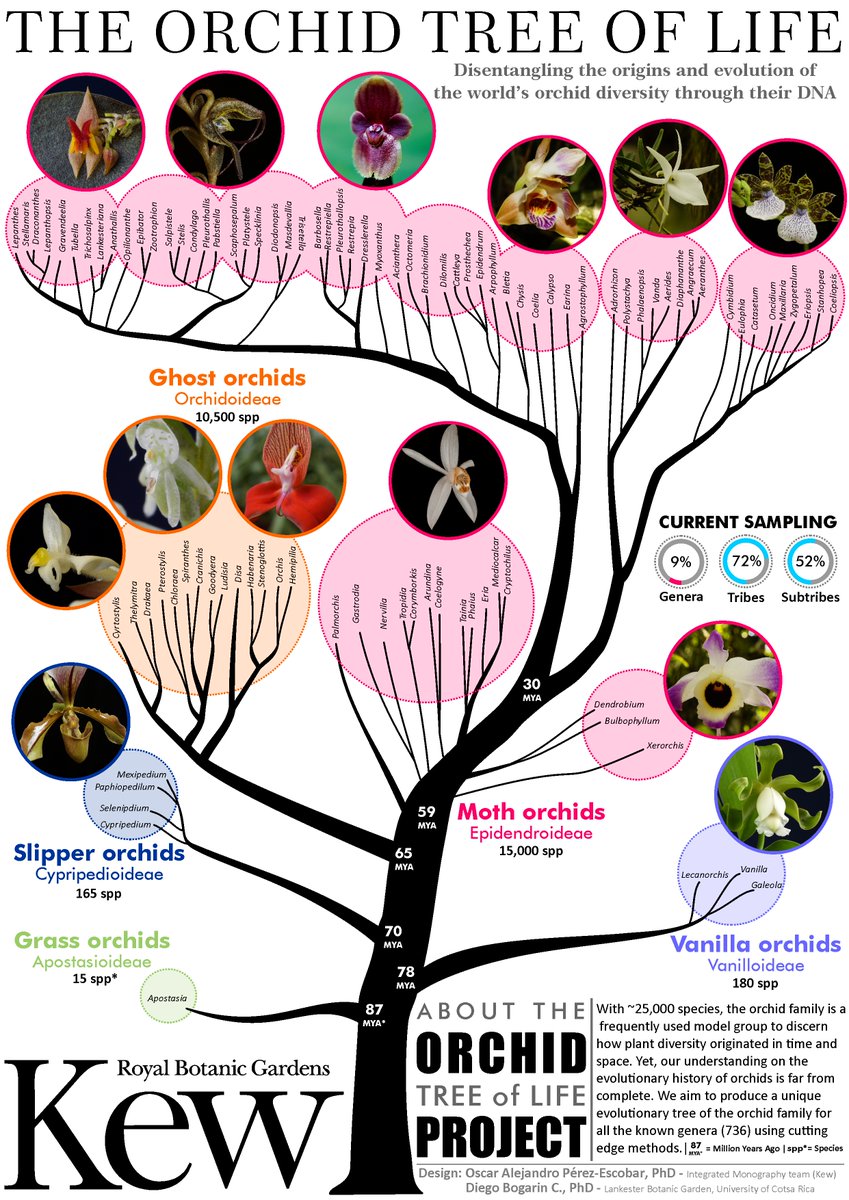
Because it is #NationalOrchidDay (well, it was yesterday but whatever 🤪), pls have a look at
a) 5 cool facts about orchids (see vid below produced by the talented @LydiaShelWalker!)
b) the orchid tree of life (read more about it here: nph.onlinelibrary.wiley.com/doi/10.1111/np…)
Please share!
English
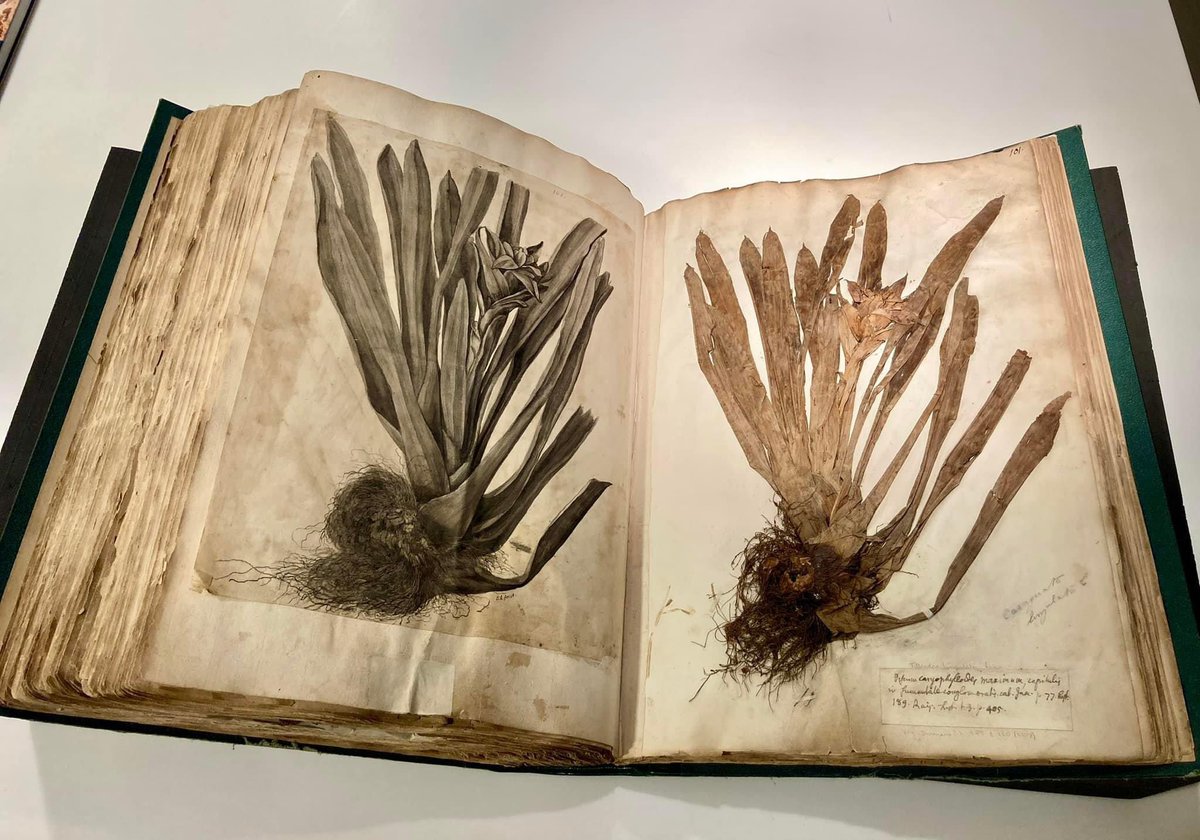
Vienna Dioscurides assumed to have been created in Constantinople around 500, is one of the most famous manuscripts of late antiquity. Its main section contains images of 383 alphabetically arranged medicinal plants; the corresponding text by the greek physician Dioscurides.

English
SamZa đã retweet

🍃🏷️ PART 2 – See how a collection is made for a Herbarium specimen! We're back in the Sarawak rainforest with Tropical Botanist @Scaphium to see how a botanical collection is pressed in the field before it is ultimately incorporated into the Sarawak and Edinburgh herbaria.
English