COT Data

12 posts

COT Data banner
COT Data

COT Data

@COTTracker

Free COT positioning tool for futures traders. Percentile rankings, extreme zones & 2yr history across Grains, Energy, Metals, FX + more. No signup needed. 📊

Online 加入时间 Mart 2026
0 关注6 粉丝
COT Data
COT Data@COTTracker·
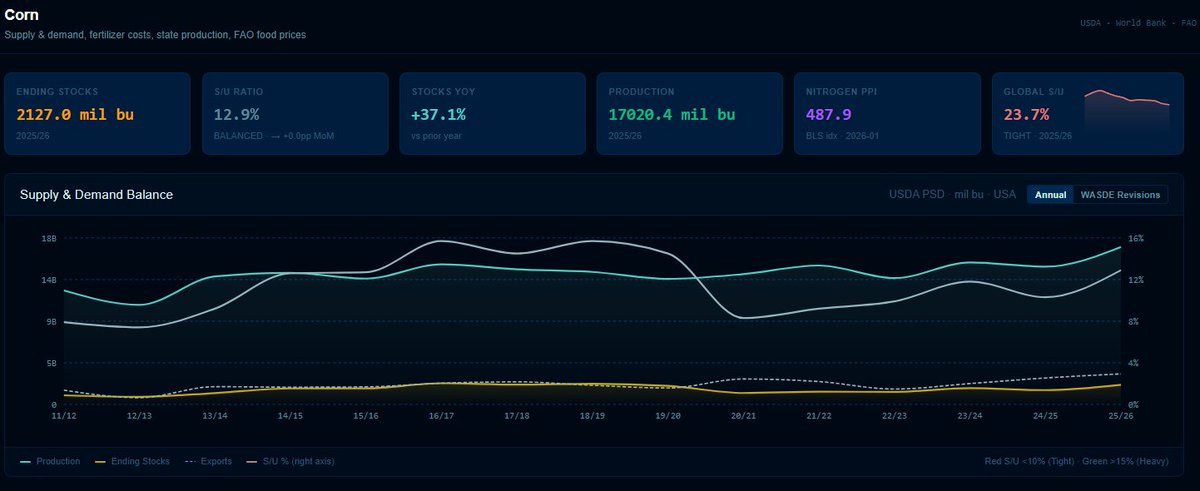
@virajhshah @PeakTrading ~20% of global LNG flows through the strait. Qatar disruption → gas spike → nitrogen fertilizer surges (already at 503 on BLS PPI). Higher input costs = fewer planted acres next season = that S/U ratio tightens fast. 
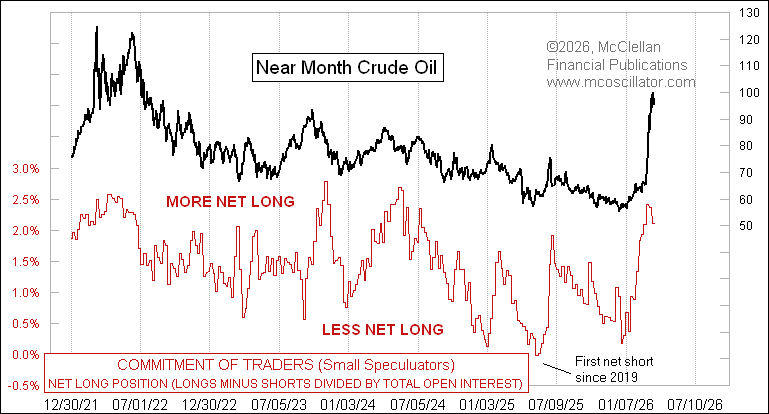
Hedge funds may be early, not wrong. #COT #Cotton #AgMarkets
English
1
0
1
64
COT Data
COT Data@COTTracker·
@virajhshah @PeakTrading Interesting on cotton specifically - fundamentals are actually bearish right now. US S/U 32.4%, global S/U 64.4%, ending stocks +10% YoY. Record longs into oversupply 👀 Potential risk is Hormuz escalation.
COT Data tweet media
English
1
0
1
25
Peak Trading Research
Peak Trading Research@PeakTrading·
Hedge funds are the LONGEST across the ag complex in 3 years at $22.8 billion. Record Cotton inflows two weeks ago. Record Sugar inflows last week. Crude Oil is driving capital into #ags and the flow data proves it. 🌾🛢️ #AgMarkets #COT #CrudeOil
Peak Trading Research tweet media
English
2
20
57
5.7K
COT Data
COT Data@COTTracker·
@dchijioke @Yongazhi or to be more precise: Bitcoin futures at 99th percentile net long, Z-score +2.34 - hedge funds are as long as they've ever been in the dataset. Crowded longs are a caution signal. When everyone's already long, who's left to buy?
English
0
0
1
24
COT Data
COT Data@COTTracker·
@IntlStacker Commercial shorts have been falling since Jan. But the more interesting signal in this week's COT is large specs quietly rebuilding longs from a historically low base (COT Index = 7). Less dramatic, but that's where the actual positioning shift is happening.
English
1
0
1
20
International Stacker
International Stacker@IntlStacker·
🚨COMMERCIAL SHORTS IN SILVER JUST COLLAPSED — BIG DE-RISKING HAPPENING?🚨 👉Look at this sharp drop on the latest COT report: 🔥Commercial short positions in silver futures have plunged to just 70,296 contracts — one of the lowest levels in years! 🔥This is a major reduction in hedging by producers and industry players! 🔥Many see this as a bullish signal that the “smart money” is stepping back from being heavily short! 👉But it could also mean other things — seasonal hedging adjustments, margin pressure, or simply repositioning ahead of expected volatility! 👉Either way, the paper market is showing signs of stress while the physical market continues to tighten! 🚨Crustacean Nation: 🔥Commercial shorts collapsing = bullish turning point or just noise? 🔥Reading this as a signal to stack more physical? 🔥What’s your take on the latest COT data? 👉Drop your thoughts & stack updates below!👇🦀 *Not financial advice. Stay stacked!
Resource Alpha@SpeculatorPL1

Look at the absolute cliff on the right side of this chart. This is the latest COT data showing Commercial Short positions in $Silver. While retail traders were panicking over the recent algorithmic price drops, the "Smart Money" was quietly executing a massive escape plan. Commercial shorts just plunged to 70,296 contracts. Can this line go lower? Yes, it can. But looking at the 10-year history, we are already in the extreme lower boundaries. The massive de-risking has already happened. They used the recent paper flush to cover their bets before the physical vaults run dry. The suppression is ending. #Silver #COMEX #Macro #SmartMoney #PreciousMetals

English
5
15
69
4.8K
COT Data
COT Data@COTTracker·
@McClellanOsc Also, watch out for a liquidity vacuum. With both funds and retail heavily skewed long right now, the trade is crowded. When everyone who wants to buy already has, who is left to push the price higher? The trend is up, but conditions are ripe for a sharp long squeeze.
English
0
0
0
50
Tom McClellan
Tom McClellan@McClellanOsc·
This week's COT Report released on Friday showed that the small "non-reportable" traders of crude oil futures are still up at a really high (for them) net long position. They are skewed to the long side, so one must judge their position relative to past data.
Tom McClellan tweet media
English
11
15
98
12.8K
COT Data
COT Data@COTTracker·
@WalkSquawk Exactly right, and the world supply picture gives this legs. US corn S/U sits 3pp above the 5yr average, so funds aren't buying domestic tightness. They're buying global tightness: world S/U at 23.7% vs. a 26.6% average - below trend and widening.
English
1
0
1
34
Jake Walker
Jake Walker@WalkSquawk·
Something interesting showing up in the latest COT report… Funds aggressively added to corn. Managed Money: +140,297 contracts on the week ending 3/10/26. That pushed funds to roughly 193k net long corn. What’s notable is the trade estimate only had funds around 47k net long going home Tuesday. Meaning the move into corn was much larger than expected. Zooming out, this lines up with a bigger macro setup developing: • Oil pushing toward $100 • Fertilizer prices rising • Bloomberg Commodity Index breaking higher • Funds rotating back into commodities When energy spikes, it tends to spill into agriculture. Energy → fertilizer → crop input costs → grain markets. We saw this chain reaction during the 2006–2008 commodity run. Corn may be starting to attract macro commodity flows again. Oil might be the headline… but grains could be next. #WalkSquawk
English
1
0
5
656
COT Data
COT Data@COTTracker·
Corn specs at 89th percentile net long - but US supply is the most comfortable in years. World tightening is driving the trade. Free WASDE+COT breakdown 👇 #WASDE #Grains #COT
COT Data tweet media
English
0
0
0
26
COT Data
COT Data@COTTracker·
Hedge funds piled into AUD & CAD futures (99th percentile) while GBP shorts hit a 2-year low. Widest cross-currency positioning spread in the dataset 👇 #COT #CFTC #FX
COT Data tweet media
English
0
0
0
24
COT Data
COT Data@COTTracker·
@ACY_Securities "institutions dumped 36k longs" when the COT report shows they closed exactly 287 of them. 😭 Actual CFTC data for 2026-03-03: → Non-commercial longs: -287 contracts (essentially FLAT) → What actually happened: shorts ADDED +20,071 The 36k number doesn't exist in the report.
COT Data tweet media
English
0
0
0
17
ACY Securities
ACY Securities@ACY_Securities·
Reddit is buying EURUSD 1.1600. The COT Report shows institutions just dumped 36k long contracts. Who do you want to follow? 👇 Learn to trade this for FREE: tinyurl.com/ACYFREEDEMO Swing Trading EURUSD feels scary when you go against the consensus, doesn't it? You see everyone buying and wonder if you're missing something. That humility keeps you grounded, nobody wants to be the only one wrong. But the "Winning Mindset" is looking at the Institutional Data (COT Report). ✅Retail is buying the RSI. ✅Institutions just liquidated 36,000 Euro Long contracts. ✅The big money is exiting. The "Priced-In Trap" (Page 13) is set. ❌Don't be the liquidity for the banks. Ready to trade like an institution? Download the Forex News Mastery eBook (Page 15 Strategy): tinyurl.com/ACYFOREX ❗Disclaimer: Trading Forex involves significant risk and may not be suitable for all investors. The information provided is for educational purposes only and does not constitute financial advice.
ACY Securities tweet media
English
1
3
7
18.3K
COT Data
COT Data@COTTracker·
AUD speculators just hit a 2-year extreme (99th percentile). CAD right behind them. On the other side - Natural Gas net shorts equally extreme in the opposite direction. COT is flashing at both ends this week. Full breakdown → cotdata.uk/blog/2026-03-0… #COT #CFTC
COT Data tweet media
English
1
0
0
52