置顶推文

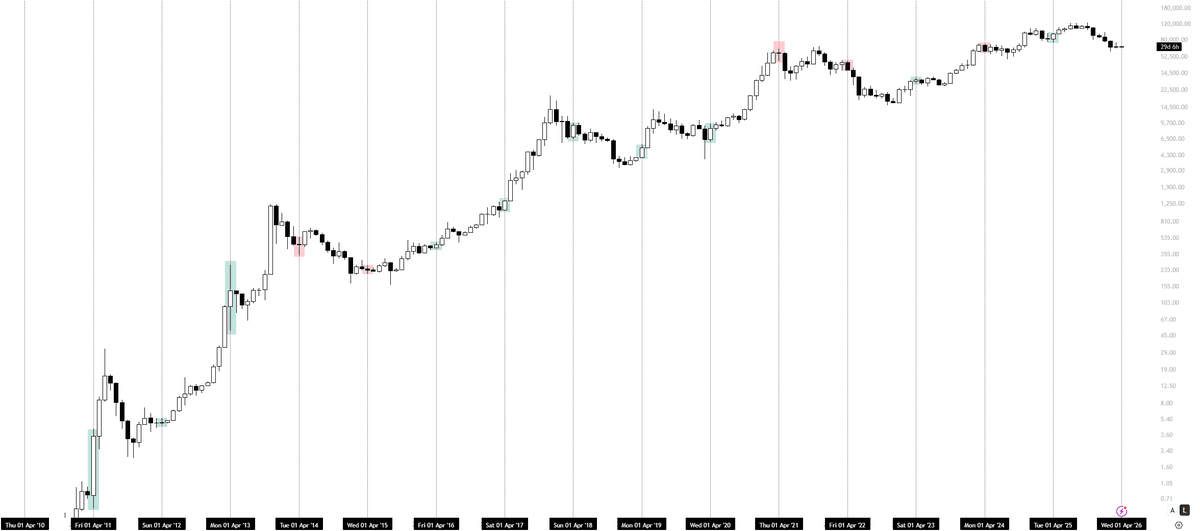
$BTC - Nothing you saw in the last 2 months mattered.
February and March — every move looked directional.
None of it had acceptance.
BTC has been rotating inside a range.
Here’s what actually matters:
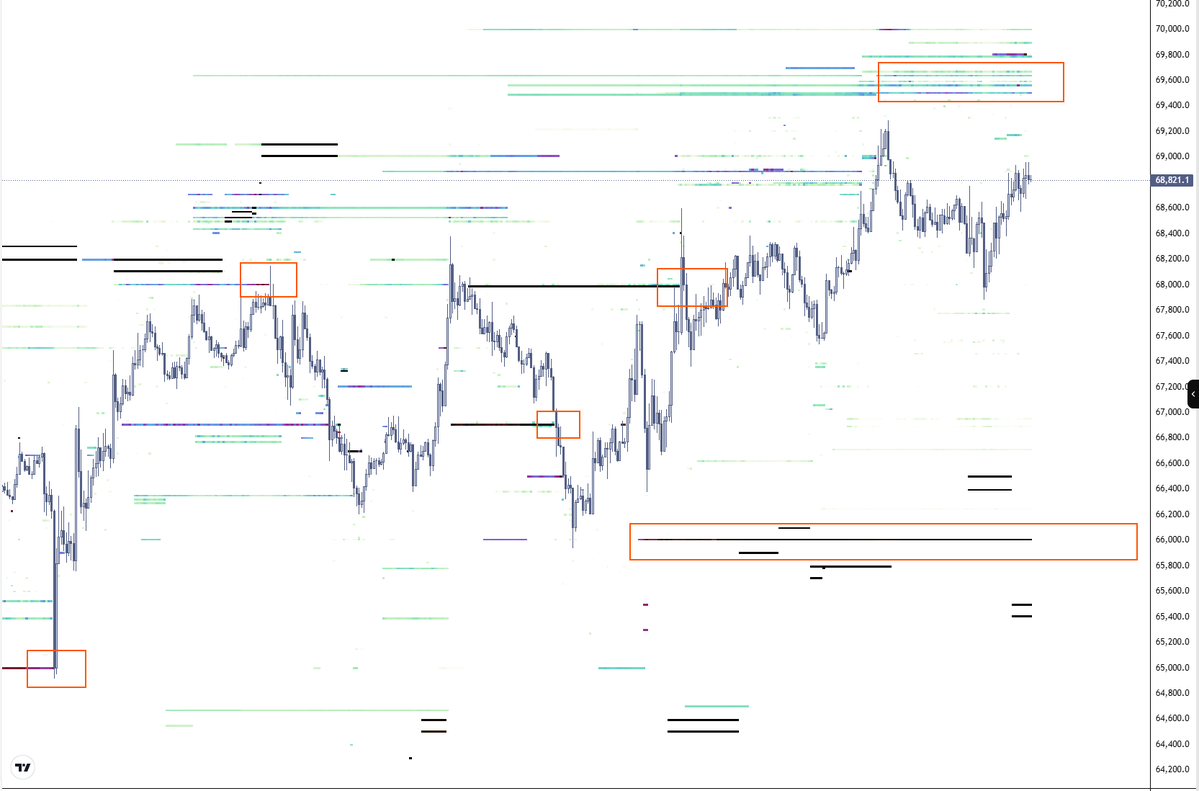
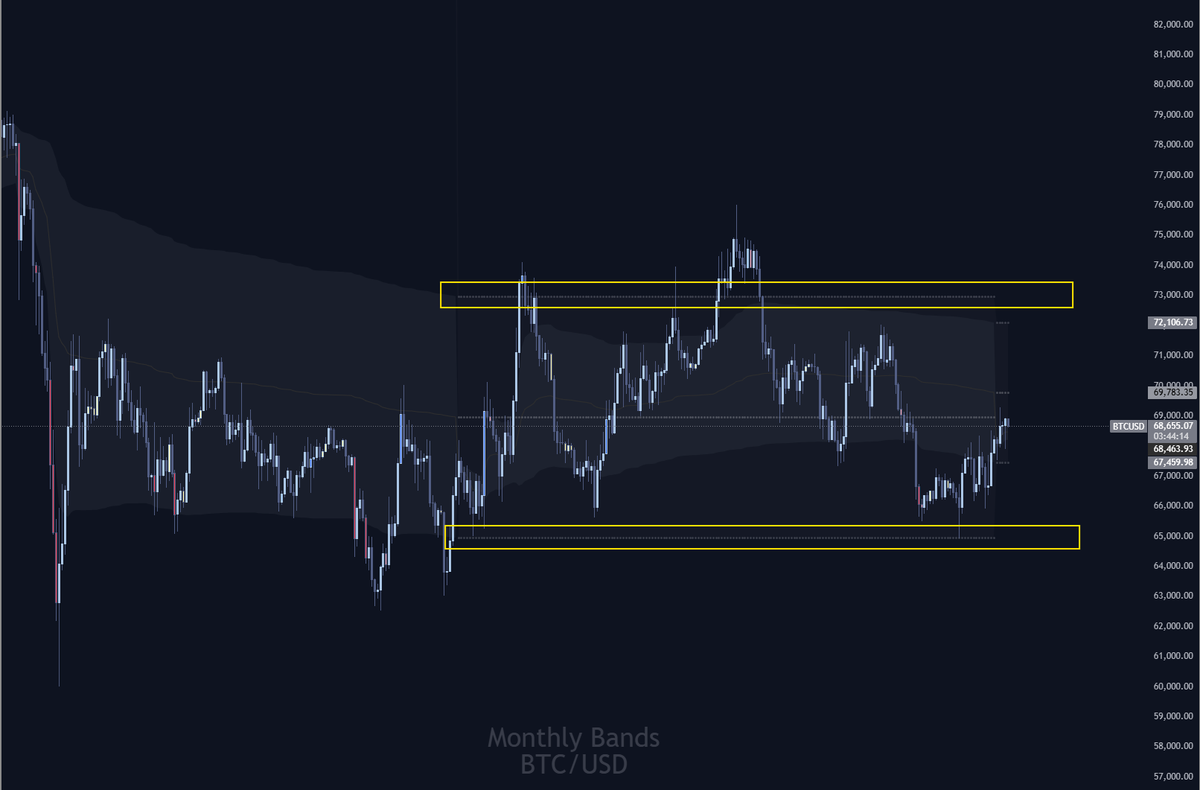
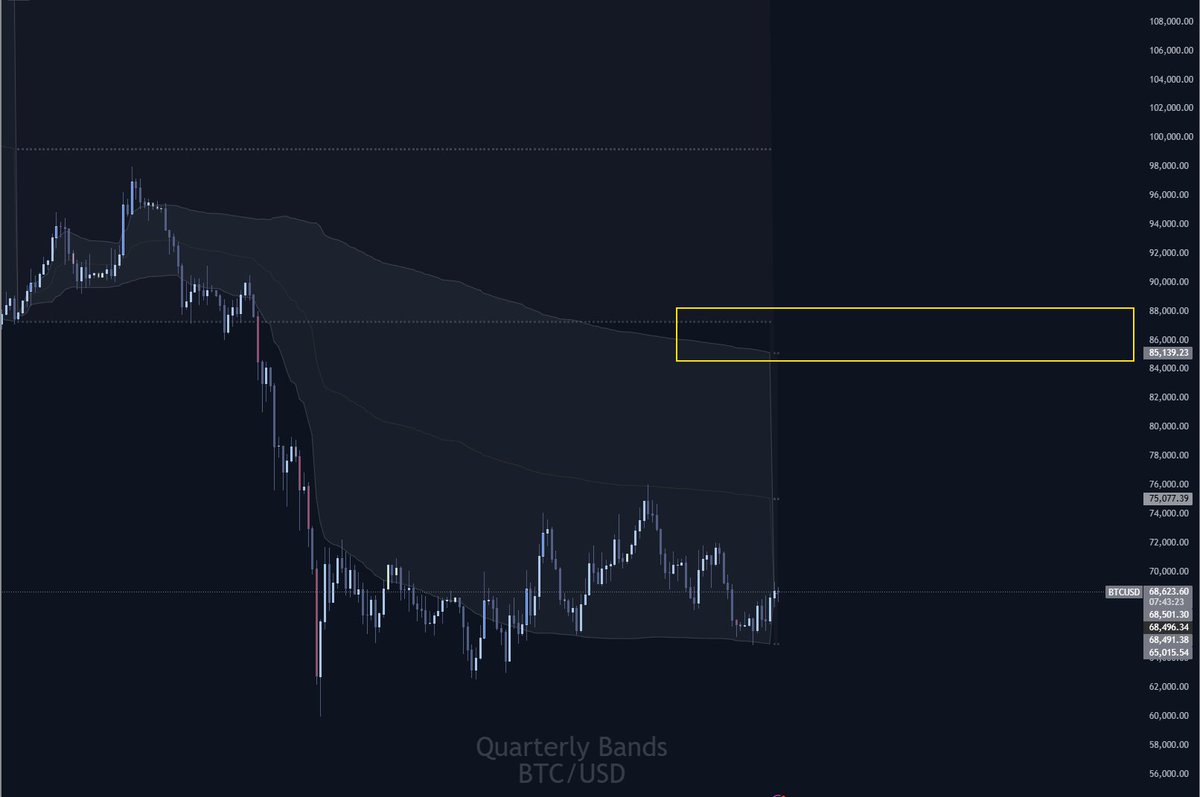
Overhead Supply:
Feb VWAP VAH → 73K
March VWAP VAH → 72K
Q1 VWAP → 75K
2025 deviation → 75.7K
→ Multiple timeframes aligning above price
Equilibrium:
Feb VWAP → 69K
March VWAP → 69.8K
2024 & 2025 VWAP → 66–69K
→ Price keeps returning here. No directional control.
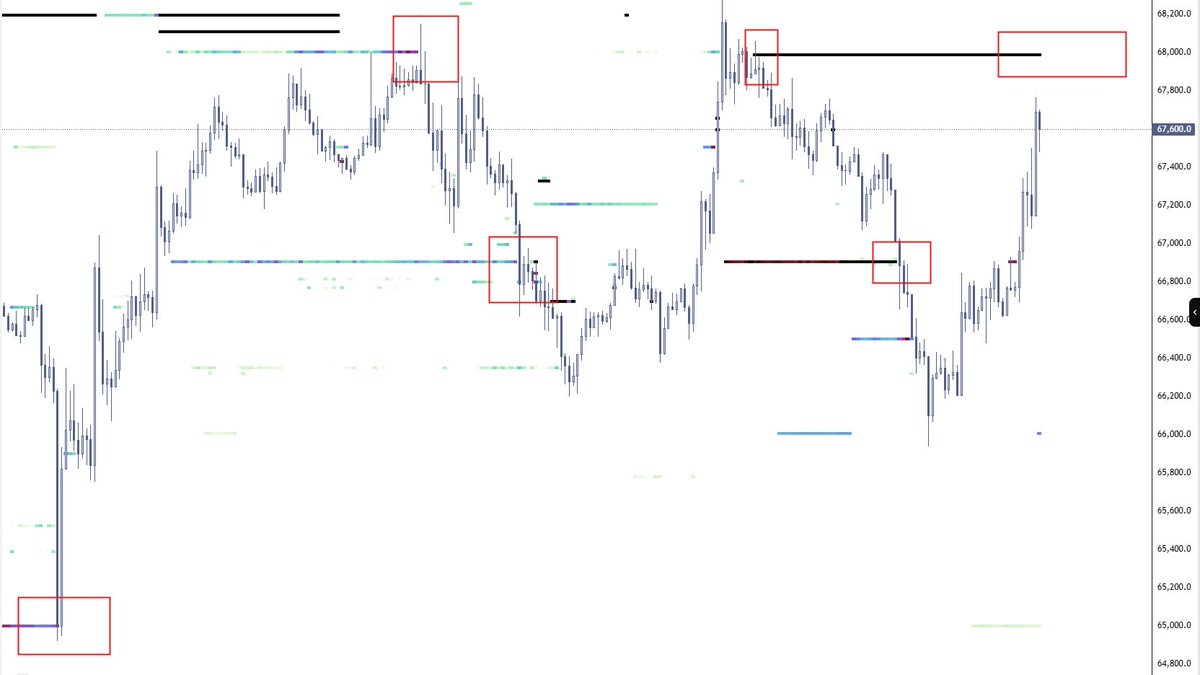
Buy-side Defense:
Feb VWAP VAL → 65K
Q1 lower VWAP → ~65K
→ Buyers responding at the same zone
Context:
Monthly, quarterly, and yearly levels are overlapping.
This isn’t trend.
This is auction.
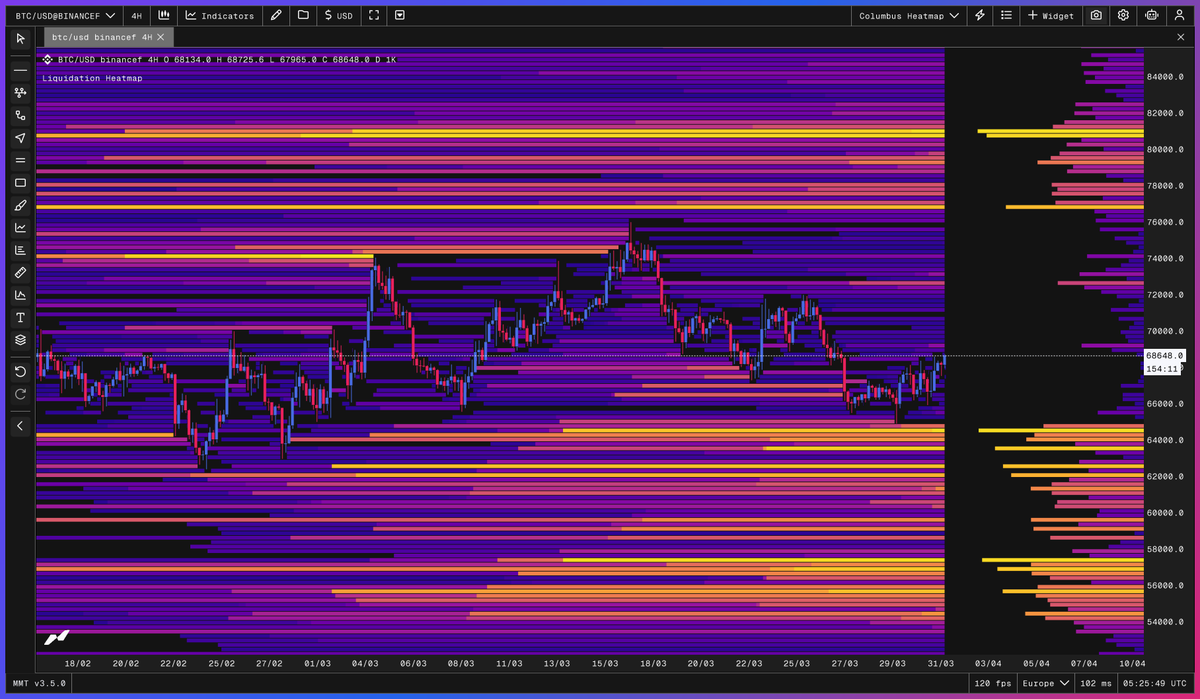
What matters now:
Acceptance above 72–73K → expansion higher
Acceptance below 65K → expansion lower
Inside → continued rotation / traps
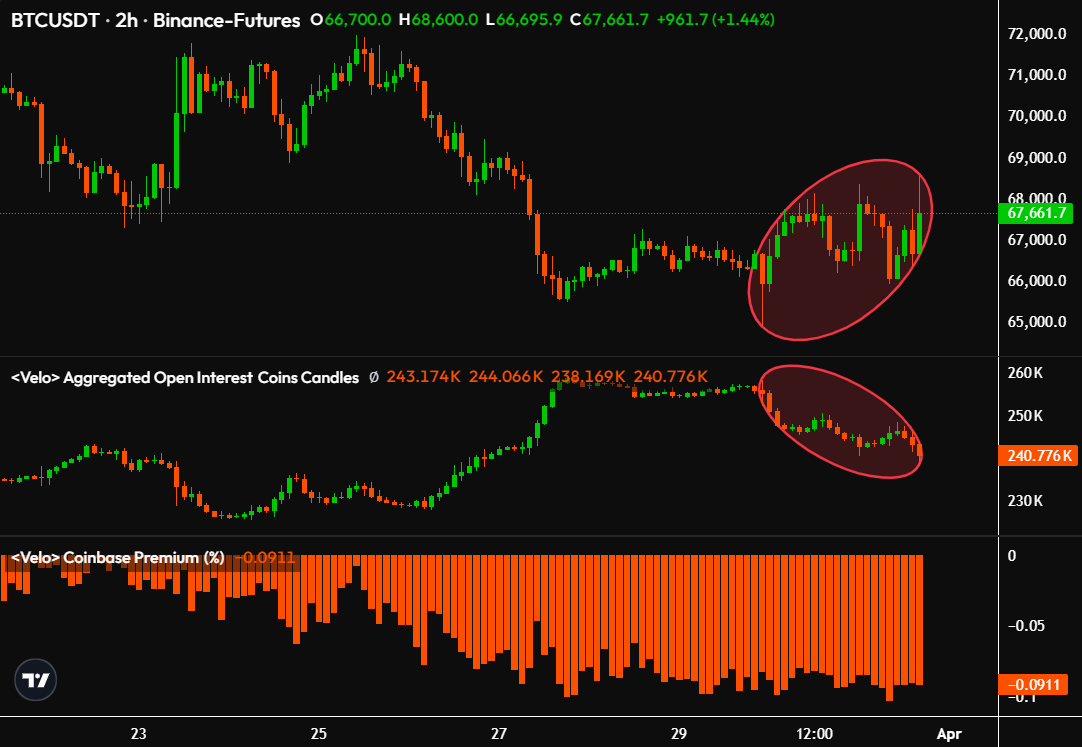
The market didn’t trend for 2 months.
It auctioned.
If you chased every move inside this range…
you were trading noise.

English