Before zone alerts: entry zone overloads, nobody notices for 20 minutes, customers leave. After zone alerts: threshold crossed, staff moves before the backup forms. Same camera. Different model.
Zone avoidance is a metric gym operators almost never track. The area that should be busy but consistently shows low utilization is telling you something — usually before it shows up in churn.
Question for gym operators: if you could see exactly which zone consistently overloads — not the whole gym, just that specific zone — what would you change first?
Gym equipment decisions based on member complaints miss the real picture. "Cardio feels crowded" doesn't tell you which zones, at what times, or whether expansion would even help. Zone data does.
Gym operators know their peak hours. What they usually don't know: which specific zones hit capacity, which sections are empty, and where the member experience actually breaks down.
Your mental model of which zones are busiest is formed from floor walks and memorable incidents — not data. Zone-level occupancy almost always shows a different picture than the one operators assumed.
Before zone alerts: line builds → complaint → react. After zone alerts: threshold crossed → alert fires → move before backup forms. Same camera. Different model.
Retailers know what sold. They don't know what happened before the sale. Which display stopped people. Which zone had traffic but no engagement. That's in your camera feed.
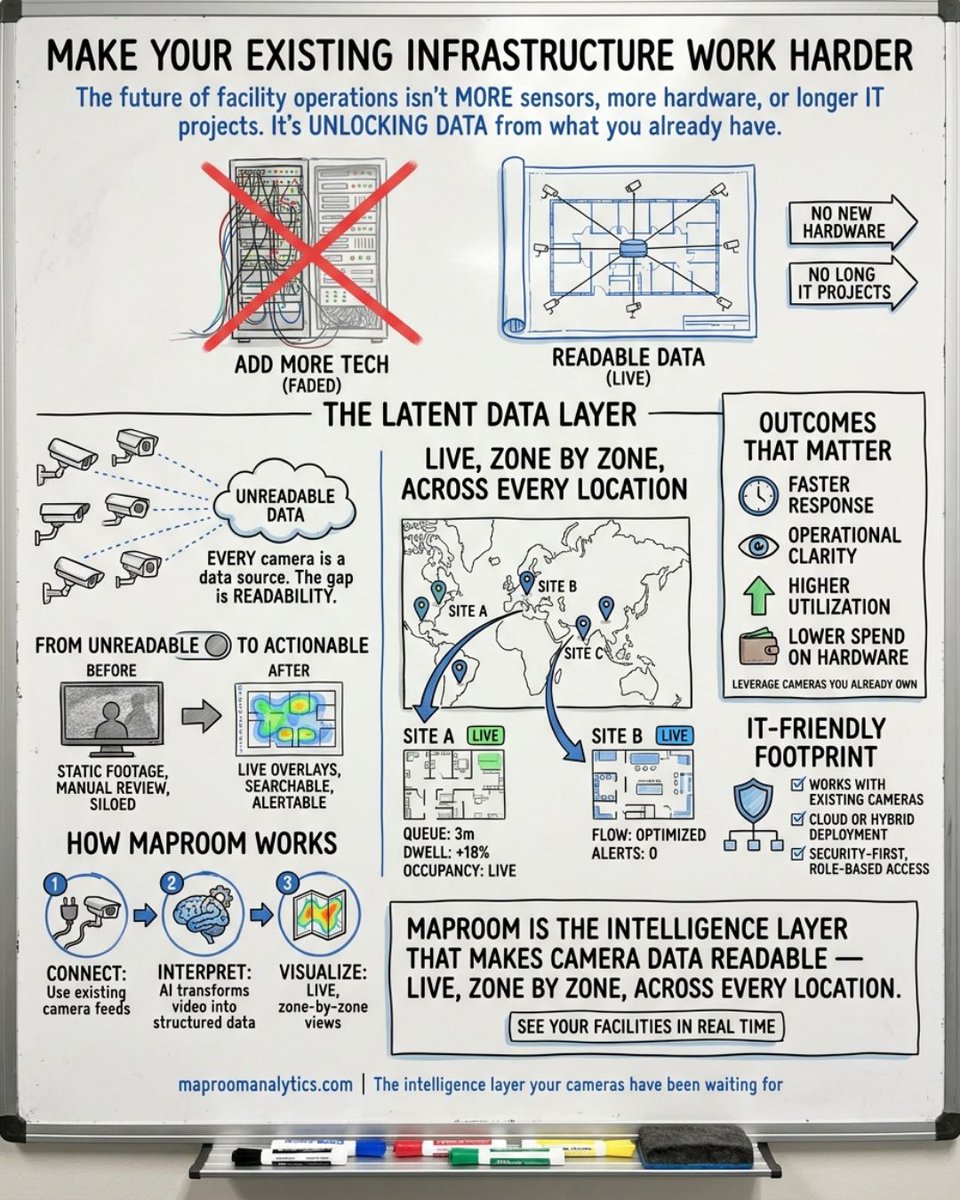
What MapRoom gives you from cameras you already have: live zone occupancy, dwell time, flow, threshold alerts, trends, multi-location comparison. No new hardware. maproomanalytics.com
Better scheduling tools aren't the answer. Better occupancy data is. Zone-level real-time data tells you where staff should be — not just how many. MapRoom provides it.
People counting tells you how many entered. Zone-level occupancy tells you what happened next. Where they went, stayed, and got stuck. That's the actual insight.
Pick the zone you're always guessing about. Connect the camera. Live occupancy in minutes. One zone, one camera, an answer instead of an estimate. maproomanalytics.com
Security cameras: review footage after incidents. Operations cameras: respond before problems peak. Same hardware. Completely different model. MapRoom makes the shift.
Multi-location operators need comparable data, not comparable stories. Zone-level occupancy — same metric, same method, across every site. MapRoom makes it possible.
Does it work with our cameras? Yes. 30 minutes. Live occupancy, dwell time, alerts — from infrastructure you already have. Book it → maproomanalytics.com
The camera investment is done. The data is being collected. The question is whether you're reading it. MapRoom does. No new hardware. maproomanalytics.com
Most gym equipment decisions come from complaints and instinct. Zone occupancy data tells you exactly which sections hit capacity and when. Data beats gut. #gymops
Retail operators: zone occupancy, dwell time, checkout alerts, and multi-store comparison from cameras already in your stores. No new hardware. maproomanalytics.com
A manager can only watch one zone at a time. A threshold alert watches every zone simultaneously, without breaks. Define the limit. MapRoom fires the alert.