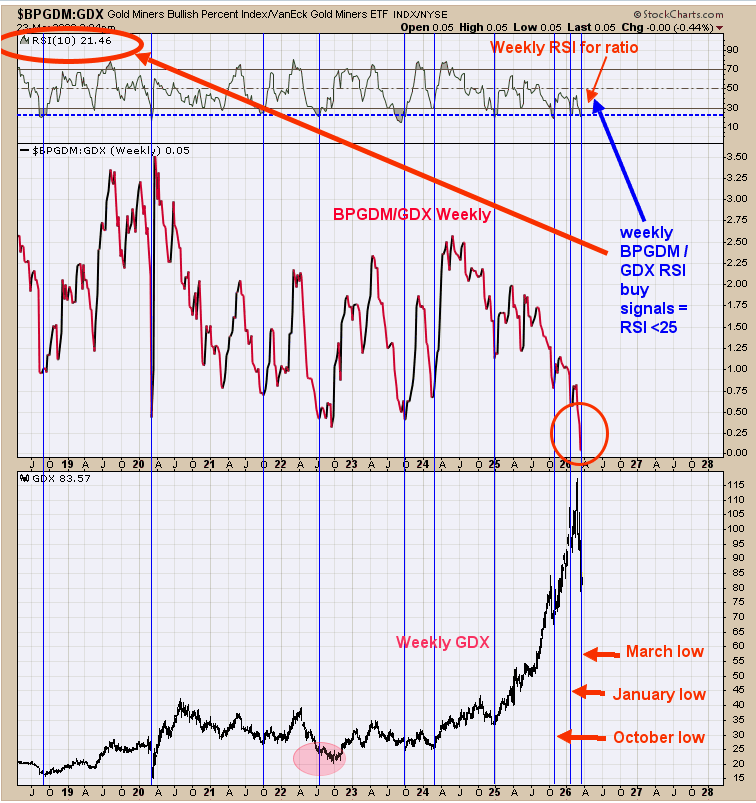
Pull back in $GDX appears complete. Bottom window is the weekly GDX, next higher window is the weekly bullish percent index for the Gold Miners index/GDX ratio and the top window is the 10 period weekly RSI for the ratio. We noted the times with blue lines when the weekly RSI for the weekly Bullish percent index for the Gold Miners index/GDX reached below 25. This chart goes back to mid 2018. Since 2018 until now the RSI reached below .25 nine times (not counting current signal) and eight times the market was at the low and one time is was near the low (back in 2022 pink circle). Over the last five months there have been three signals and the October and January signal worked perfect leaving the current signal to be determined. The odds suggests a low is forming here.
English