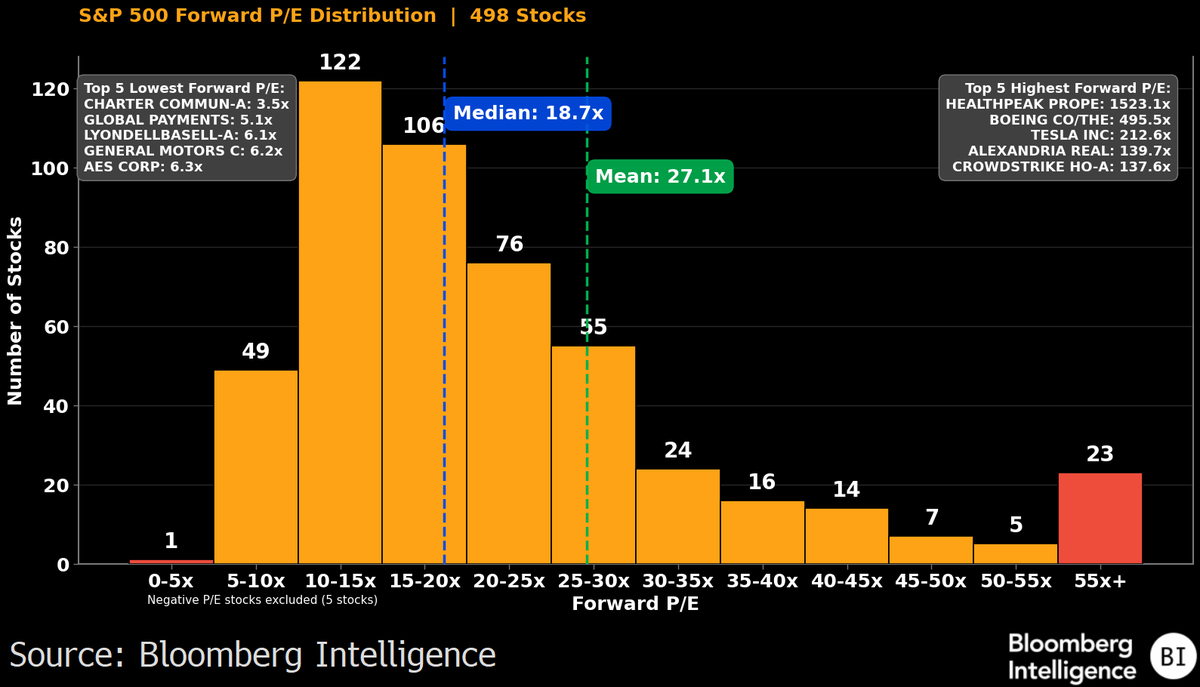
Some S&P 500 valuation charts...
TLDR; SPX valuations aren't as crazy as they look at first glance
Big diff between market cap weighted and equal weight valuations (forward P/E). Ratio close to highest in this data. EW valuations are right around medians (compared to itself)

English