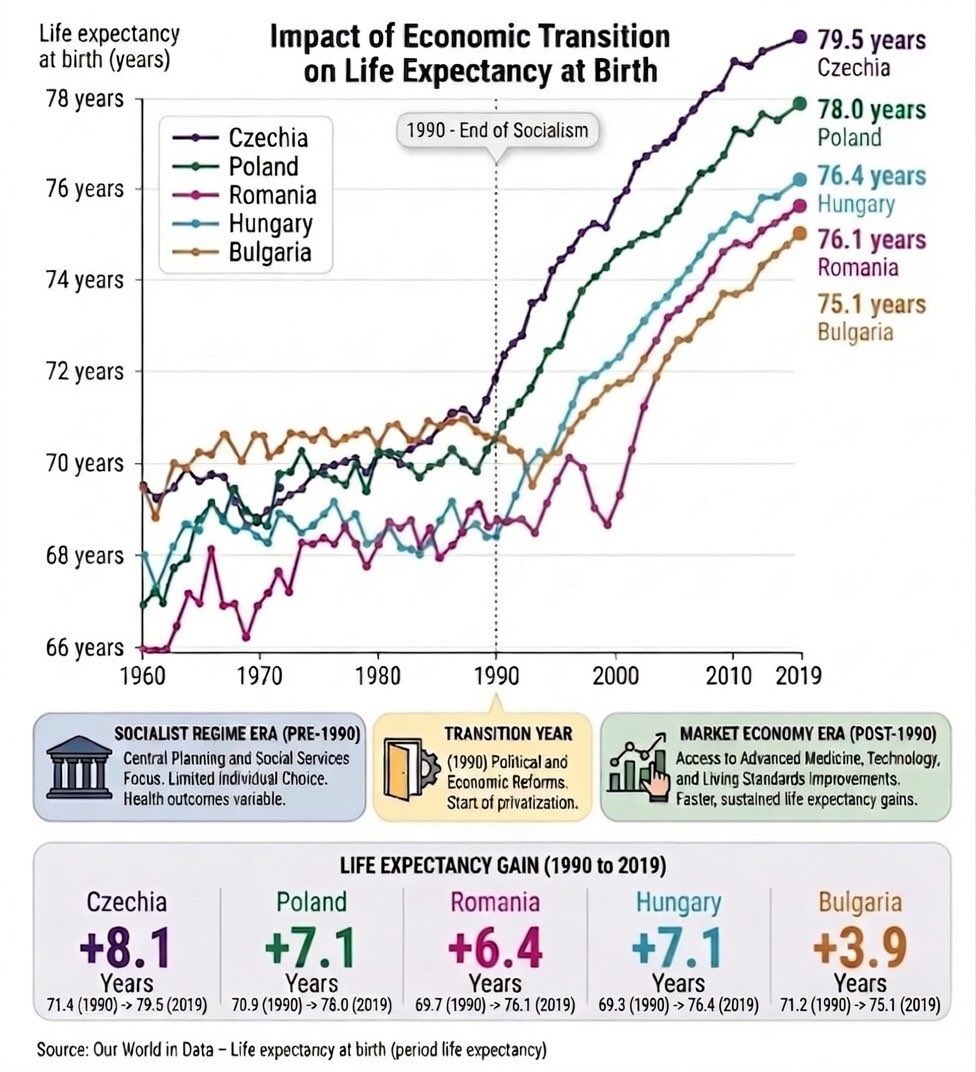
تغريدة مثبتة

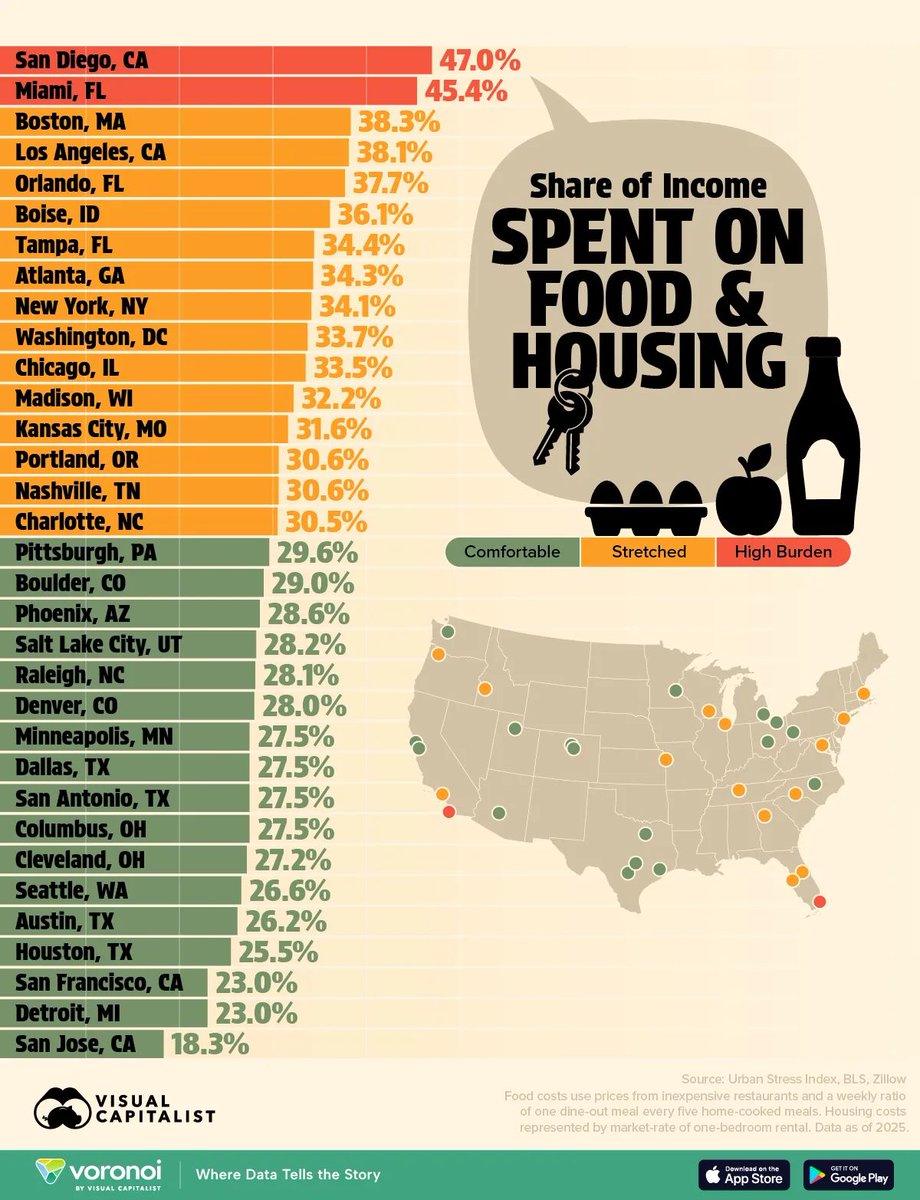
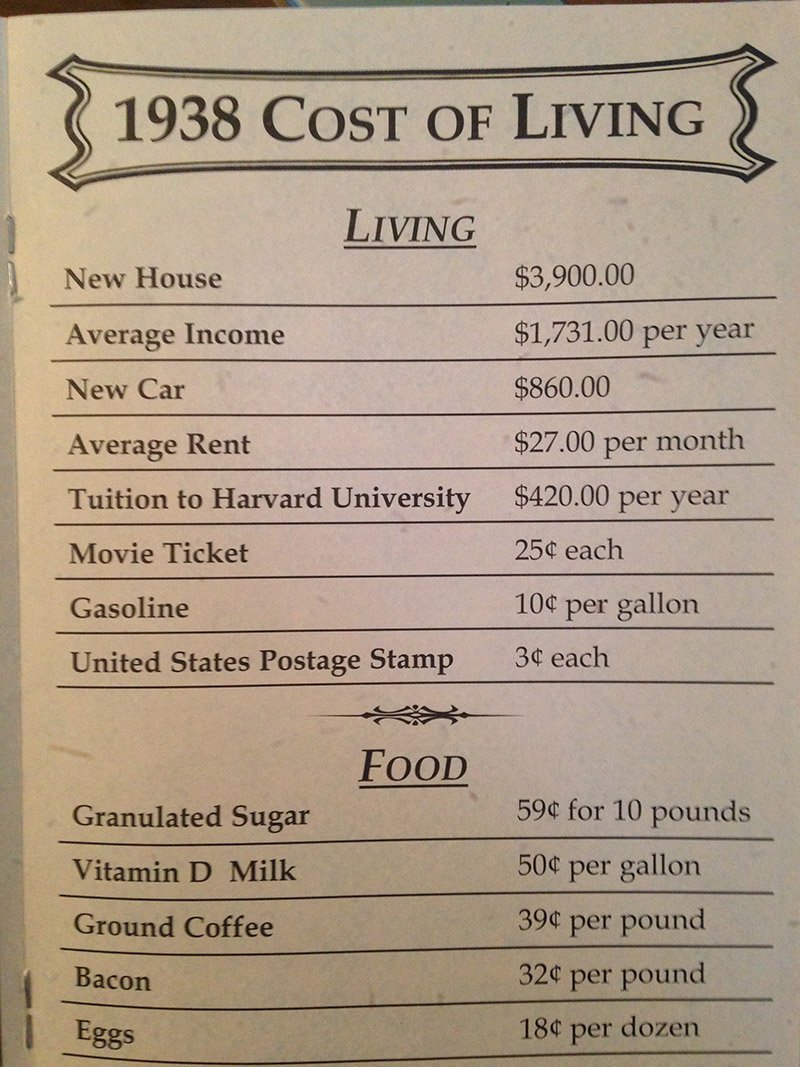
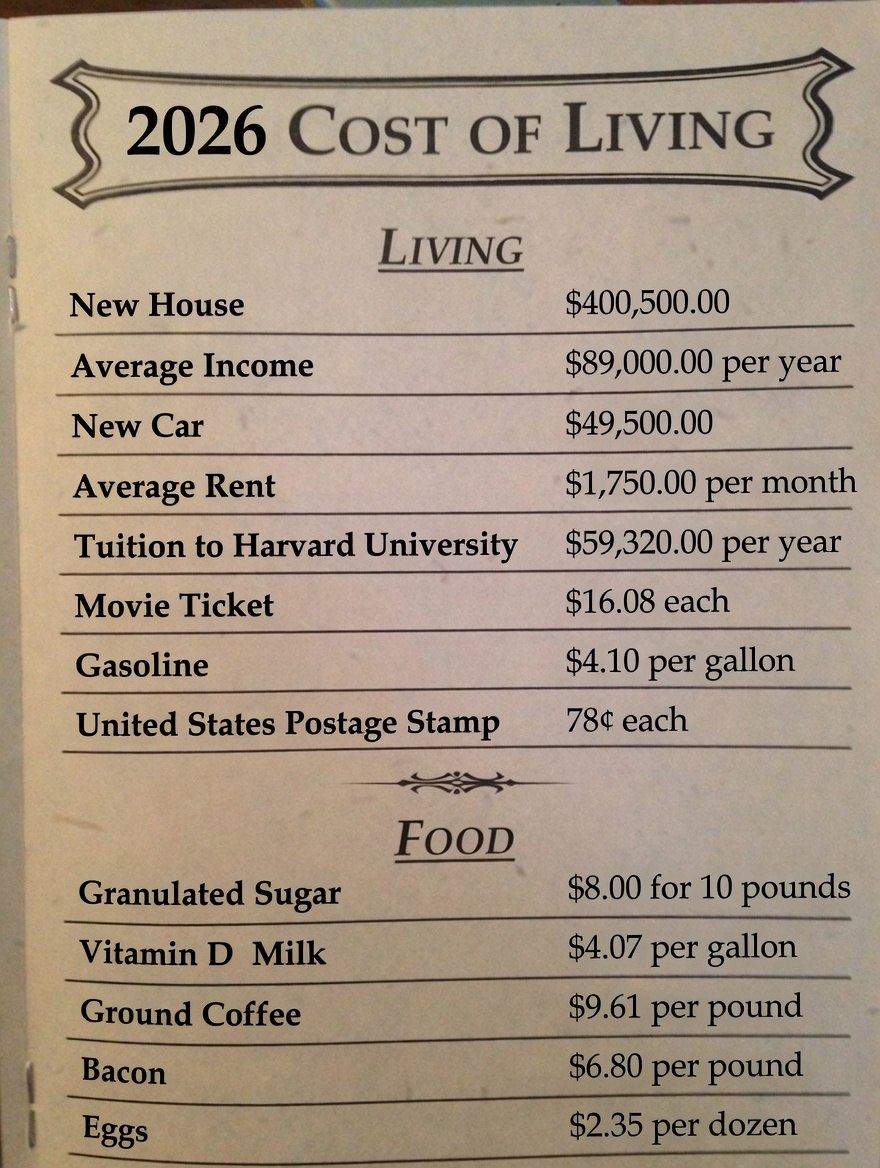
How many hours of your life does a house cost?
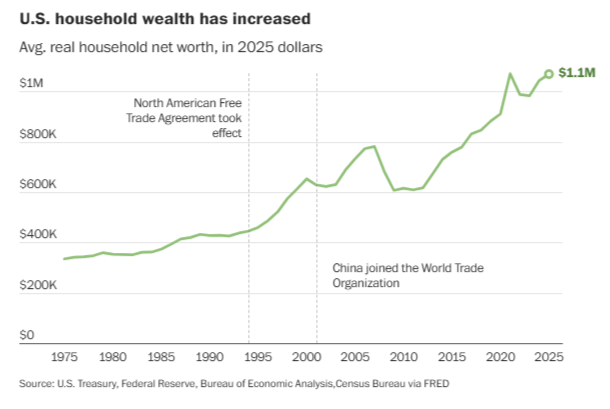
The answer used to be very different. It changed, and it didn't change because you stopped working hard enough.
English
Nick Manteris
198 posts

@thecostofwork
Why a regular paycheck used to cover a regular life and doesn't anymore. Restaurant server. Reader. Writing about what the economic debate keeps leaving out.


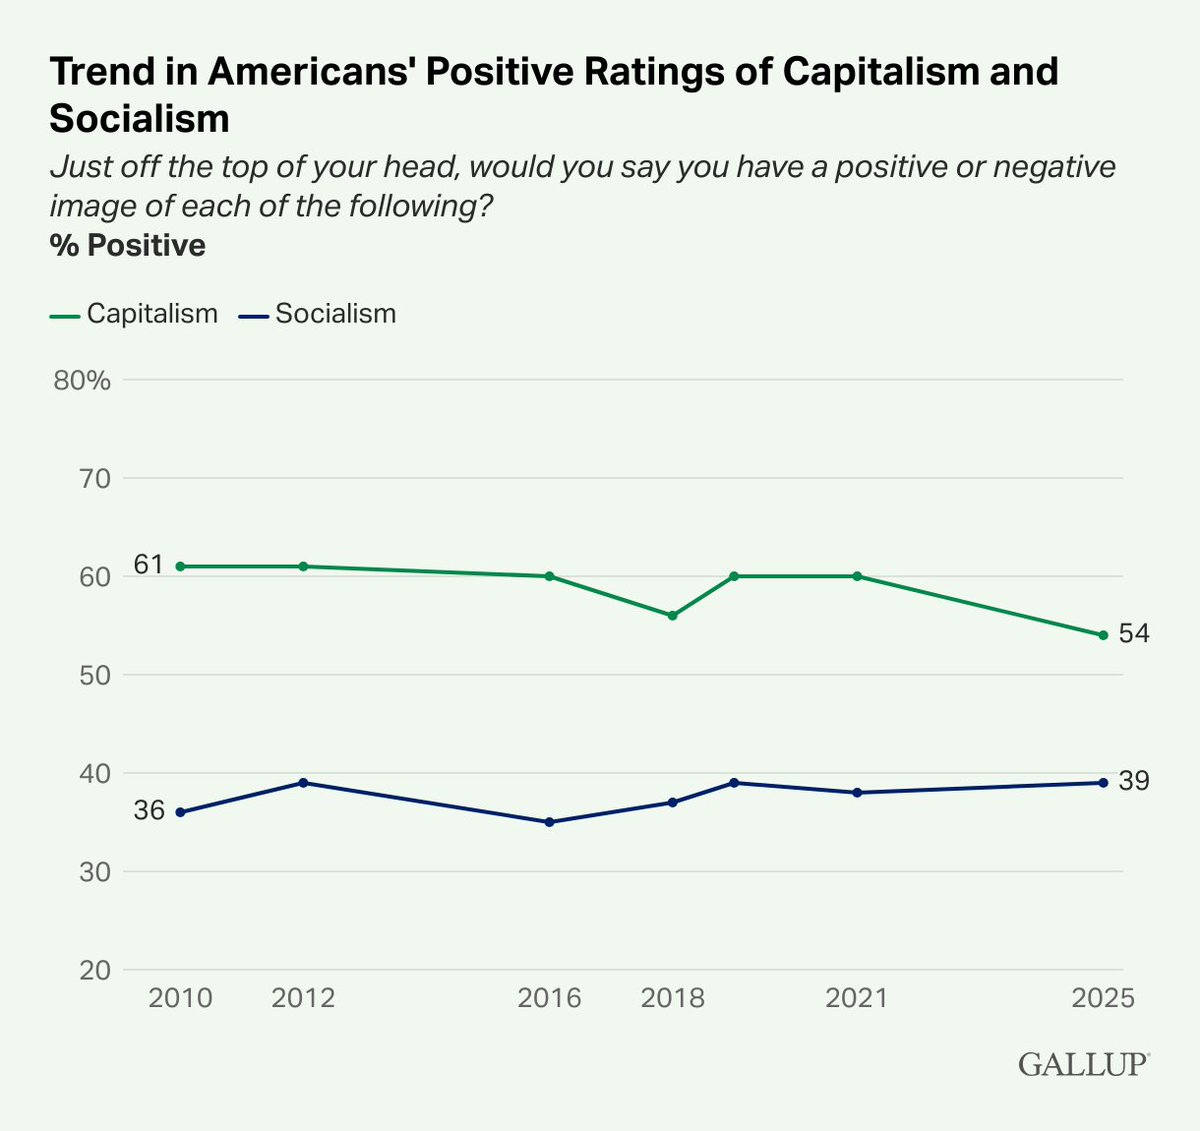
People dislike capitalism but like free markets. Go figure. profectusmag.com/building-a-bet…


If we want more jobs, why are we taxing human labor? blog.andrewyang.com/p/tax-the-bots