
8TML
3.2K posts

8TML
@8tmlcrypto
Wyckoff & SFP Trader | Powered by @Versoriumn ✌🏽
Trade with me: Beigetreten Ocak 2024
80 Folgt1.5K Follower

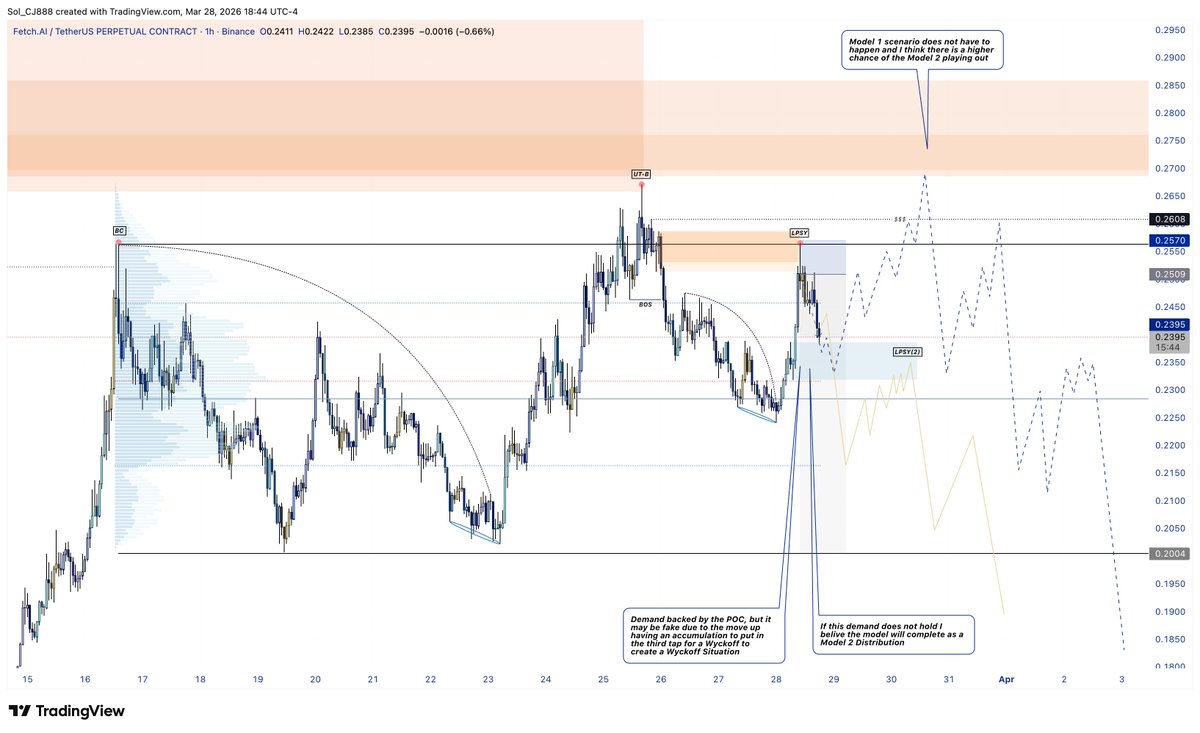
$FET
There are two scenarios I see for Fetch:
1. We complete the Wyckoff Model 2 Distribution, as it is where the LTF structure break confirmed the LPSY in supply. I view the faster move up as manipulation sweeping liquidity backed by an LTF Wyckoff accumulation to put in the higher TF LPSY. This would mean market makers are not protecting the demand created on the move up and will get disrespected.
2. The demand on the move up is going to be used to create a Wyckoff Model 1 Distribution (Blue drawing), taking the high once more into refined supply above the range.
Given the two scenarios, I would bet a lot more heavily on option 1. The confirmation of that is that demand is getting disrespected. If that happens and we flip the POI, putting a LTF distribution back into it becomes very high probability and can confirm a LPSY(2).
For now, this is all speculation and pre-planning for multiple scenarios. I think it is valid to already be in on the Model 2, I just missed it due to weekend timing in crypto.
English

How can you be convinced in a game of probabilities?
English
8TML retweetet
8TML retweetet

Secret Indicator | @mzyriQuantum
x.com/8tmlcrypto/sta…
8TML@8tmlcrypto
I’m going to be completely honest with you… For the past few weeks, it’s felt like I’ve been cheating. I’ve been using a secret indicator (shoutout to @mzyriQuantum) that’s helped me chart nearly 3x faster than usual. It makes identifying supply and demand, hidden liquidity, order blocks, breaker blocks, UNF candles, and more incredibly clear and efficient. This tool has genuinely been a game changer for me. It’s cut down my charting time significantly and allowed me to put far more focus on what actually matters - execution. If you’re serious about improving your workflow, I highly recommend sending @mzyriQuantum a DM to claim a FREE TRIAL of the indicator. I don’t say this lightly: it truly feels like unlocking a new level in your charting process. If you take advantage of this shortcut, you’ll see the difference. Don’t miss out! ⚡
Español
JDB Retracement | @JDB_trading
x.com/JDB_trading/st…
JDB@JDB_trading
Component 2 van de JDB strategie, de retracement strategie, is wederom prima toepasbaar voor beginnende traders. Het is een typische short strategie waarmee je speculeert op een grote correctiegolf / bearmarket. Dat betekent dat de slagingskans in je nadeel is, maar de risk/reward is daarentegen extreem gunstig! Het is vooral heel belangrijk wanneer je deze strategie toepast. Als je namelijk in elke bullmarket dip short gaat op 50-61.8% ga je kapot, want dan ga je na elke dip uitgestopt worden. Daarom pas ik deze strategie uitsluitend toe NA doorbraak dominante MA (trenddoorbraak) en/of een blow-off top. Die laatste maakt het nog onzekerder, maar als je gaat wachten op een doorbraak van de dominante MA na een bubble ben je vaak te laat. Een bubble eindigt namelijk vaak met een blow-off top waarop de retracement volgt en daarna pas een doorbraak van de dominante MA. Vandaar dat de blow-off top een uitzondering is, want in alle andere gevallen wacht je eerst de doorbraak van de dominante MA af. De strategie is te herleiden naar klassieke bearmarket patronen, want vrijwel iedere bearmarket laat uiteindelijk hetzelfde patroon zien. Vooral als je kijkt naar de grote bearmarkten uit het verleden van de belangrijkste wereldwijde aandelenindices. De retracement speelde daarbij altijd een belangrijke rol en het is de component waar ik het meeste geld mee heb verdiend door de jaren heen. Het is een gouden strategie zodra je weet hoe je die moet gebruiken! Het is by far mijn favoriete component van de JDB strategie. Hoe teken je de retracement: De top van de retracement (100%) is simpel, want die leg je altijd op de recente top van de koers. De 0% leg je op de recente bodem van de koers, maar indien de koers nieuwe bodems maakt, pas je de retracement dus ook aan naar de nieuwe bodem. Entry, stoploss en winstpakken (money management): Zodra je hebt bepaald dat het toepassen van de retracement valide is (dus na doorbraak dominante MA en/of blow-off top) leg je de short entry exact op 50% retracement. Je stoploss leg je standaard een stukje boven 61.8% (1/5 van het vlak tussen 61.8% en 100%, laten we voor het gemak zeggen op 70%). Waarom deze getallen? Omdat de klassieke bearmarket rally stopt tussen de 50-61.8% en soms schiet de staart van de candle iets door de 61.8% om er vervolgens toch weer onder te sluiten. Het koersdoel van de retracement strategie is ALTIJD de MA200 op het dominante timeframe (vaak de week- of maandgrafiek). Deze strategie is dus met name interessant na een blow-off top en/of doorbraak dominante MA20, omdat het gat naar de rode lijn dan extreem groot is. Dit is dus een ideale strategie om de combinatie met aandelen/futures en opties op te zoeken. Omdat je een koersdoel hebt (MA200) kun je dus makkelijk je straatje out of the money put opties uitzoeken die je vervolgens gestaffeld kunt verkopen zodra de ene optieserie het van de andere overneemt. De aandelen/futures short kun je sluiten zodra de eerste optieserie wordt bereikt. Dit is het kers en de taart verhaal (eerder besproken op mijn kladblok). Waarom opties overigens ook interessant zijn in dit verhaal is omdat op de retracement de implied vola laag staat! Dit in tegenstelling tot bij een forse doorbraak van de dominante MA. Tot slot is het natuurlijk cruciaal om een blow-off top te herkennen (doorbraak dominante MA heb ik reeds besproken). Een blow-off top is een snelle felle stijging die minstens zo snel weer wordt afgebroken. Je moet in feite een puntdak van een huis kunnen tekenen in de grafiek. Bij voorkeur wil je zien dat de laatste fase van de parabolische bullrun minstens even snel weer wordt afgebroken. Dan weet je dat de kans groot is dat de bullrun voorbij is en dan is het nog wachten op de 50-61.8% retracement voor de ultieme short risk/reward. Ik heb 4 grafieken als voorbeelden toegevoegd; Grafiek 1 betreft een duidelijke blow-off top in het aandeel NVDA. Je kunt een duidelijk puntdak op de beweging tekenen, terwijl de dominante MA nog niet is gebroken. Overigens zie je hier ook duidelijk het verschil tussen een bullishe zijwaartse consolidatie naar de dominante MA (blauwe pijl) en een blow-off top. Het ene is bullish en het andere is bearish. Na de blow-off top kwam de klassieke 50-61.8% retracement, met entry short op 50% en stoploss nooit geraakt. Grafiek 2 laat zowel een blow-off top (puntdak) als doorbraak dominante MA zien van de Nasdaq100 tijdens de dotcom bubble. Daarna volgde de perfecte retracement voor de ultieme short entry op 50%. De koers is iets boven 61.8% geweest, maar niet boven de stoploss! Grafiek 3 betreft de SP500 tijdens de grote 2008 crisis. Niet echt een blow-off top, maar wel een hele duidelijke doorbraak dominante MA, waarna je de retracement kon toepassen. En ook hier de perfecte set-up. Grafiek 4 laat het uiteenspatten van de Nikkei bubble begin jaren 90 zien. Eigenlijk ook wel een blow-off top, maar je ziet dat als je short ging op basis van doorbraak dominante MA de risk/reward niet meer zo gunstig was. Dat terwijl die risk/reward extreem gunstig stond bij de retracement strategie!
English
8TML retweetet

The real reason most traders fail:
They treat trading like a hobby instead of a business
You wouldn't open a shop and just hope customers show up
You'd have a plan, track your numbers, know what's working
But somehow with trading people just wing it and wonder why they're not making money
Start treating it like a proper business and you'll start seeing proper results
English

The Famous 35R XAU Short
Runner hit 125R to Po3 target
Stayed awake till 1:30 am for this one and didnt get a good rest for 3 days.
Learnt a lot of valuable lessons from this trade
Wycrest ⭕@Wycrest
Lol @Wyckoff_Insider
English

@wozo_capital The consistency you seek is in your mind, not in the markets.
English
8TML retweetet

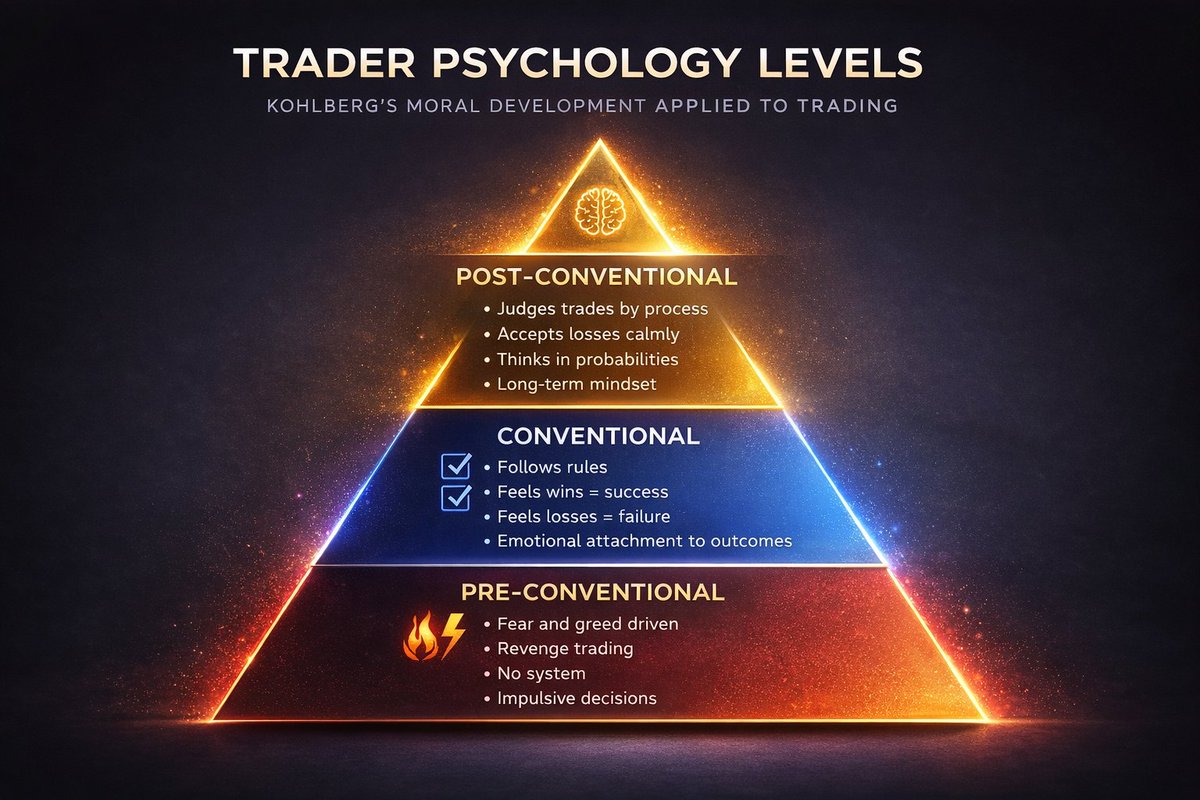
🧠 This is so significant for traders. I can not stretch it's importance enough.
Everybody's gonna have a different level of awareness. At the very bottom there's right and wrong, black and white, WIN and LOSS, GOOD trader BAD trader, reward and punishment, heaven and hell.
As you go up, it becomes more abstract and you understand situational ethics until you finally understand universal laws. When universal laws are there, you realize that these are a synthesis of opposites.
So at first, it's: avoid that, seek that. But as the Buddhists said very beautifully, the desire for that which is unobtainable and the desire to avoid that which is unavoidable is the source of human suffering.
People are suffering trying to get rid of half of their life.
If you look and you did a drone viewing of you or me or any human being for three months at a time and video recorded them 24 hours a day, you wouldn't see a hero without a villain. You wouldn't see a saint without a sinner. You wouldn't see a positive without a negative. You wouldn't see a like without a dislike.
Nature has a balance of opposites and wisdom is the embracing of the two sides of life, not the fantasy of one-sidedness.
Citing John deMartini again. Also added and removed some things.
English
@mzyriQuantum @wozo_capital @AnesvasX @Larskooistra_ @timheus @Moneytaur_ @JDB_trading @RuurdSnijdtDoor @lucas67261771 @traderAhmed @Dowz_0 @Snipezhq @Sol_CJ888 @TCT_Lazoo @MarkellSimons_ @mr_abundance_ @BTziatas You already give too much, imo.
Respect.
English

@wozo_capital @AnesvasX @Larskooistra_ @timheus @Moneytaur_ @JDB_trading @RuurdSnijdtDoor @lucas67261771 @traderAhmed @Dowz_0 @Snipezhq @8tmlcrypto @Sol_CJ888 @TCT_Lazoo @MarkellSimons_ @mr_abundance_ @BTziatas Thanks a lot. I will try to give more to the space guys.🙏🔥💜
English
Accounts on X to follow right now.
Obvious:
@Larskooistra_
@timheus
@Moneytaur_
Lesser known but A+:
@JDB_trading
@RuurdSnijdtDoor
@lucas67261771
@traderAhmed
@Dowz_0
@Snipezhq
@8tmlcrypto
@Sol_CJ888
@TCT_Lazoo
@MarkellSimons_
Turn off brain → click follow.
English
@wozo_capital @Larskooistra_ @timheus @Moneytaur_ @JDB_trading @RuurdSnijdtDoor @lucas67261771 @traderAhmed @Dowz_0 @Snipezhq @Sol_CJ888 @TCT_Lazoo @MarkellSimons_ Thank you, it's an honour!
GIF
English

a lot of people buy $TAO as investment without even knowing what a TAO subnet is !
@swiss_circle just uploaded a new blog post explaining just that !
check it out
👇👇
swisscircle.trade/blog/bittensor…
CoinGecko@coingecko
INSIGHT: Bittensor subnets are pumping alongside $TAO with the category gaining 18.6% today. Track #dTAO subnets here: coingecko.com/en/categories/…
English
I get your point, but I’d say both drawings are valid. It really depends on the timeframe you’re using. On the 2h, there wasn’t an initial bullish break, just an SFP, so drawing the range top to bottom wouldn’t be correct. But on lower timeframes, your pull makes sense.
It mostly comes down to preference. I base my range on the highest timeframe break, which in this case was the 2h (after the SFP high was broken).
English
@8tmlcrypto Nah if you aren’t drawing it from the distribution that created the PSY and the BC you are drawing it wrong imo. Everything is perfect once you see the structure. We are in a Model 1 distribution
English
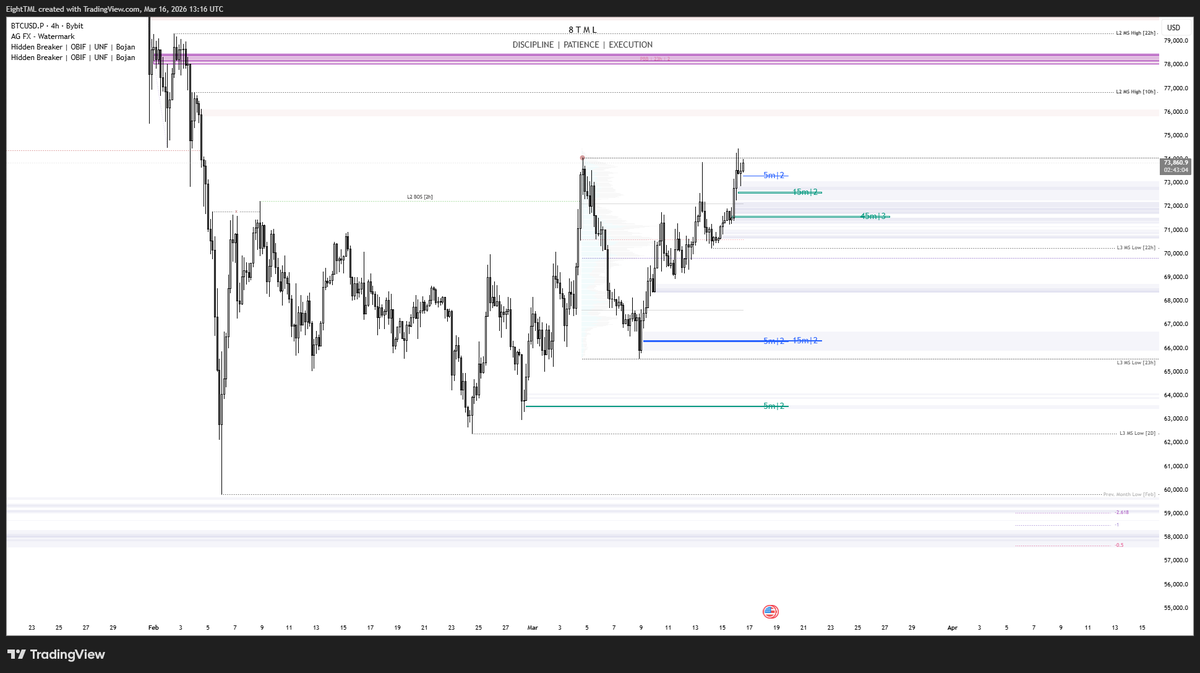
$BTC
The recent upward move to $74,000 has required a redraw of my primary range, as shown in the attached chart.
Price has now deviated above the range high, confirming the need for patience while we await further distributive price action.
The 'Hidden Breaker | OBIF | UNF | Bojan' indicator (visible in the top left of the chart) has proven highly effective in identifying key levels and inefficiencies. I highly recommend it guys! Message @mzyriQuantum for a free trial.
8TML@8tmlcrypto
$BTC Ideal scenario. Requoting this idea as price continues to respect the plan so far. The potential distribution schematic is developing largely as anticipated. Now it’s just a matter of waiting for the proper confirmations before committing to a trade. Discipline → Patience → Execution.
English
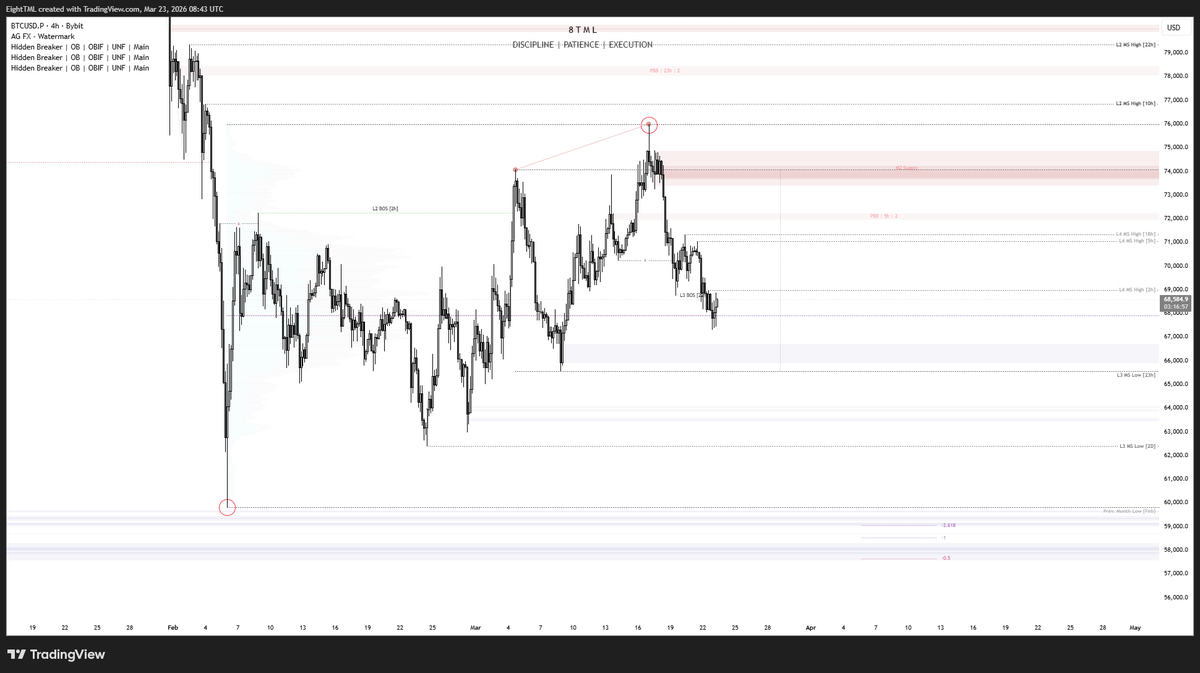
$BTC
In case you missed it, price has confirmed a new HTF range and is currently trading right at EQ, aligned with the POC for this range.
This is a level where caution is warranted. It’s not the best spot to open new positions and it's better to wait for clear directional bias before getting involved, especially with $ALTS.
For now, I’m staying patient and observing, with alerts set at the MTF range low ($65,500) and at the supply zones above.
8TML@8tmlcrypto
$BTC The recent upward move to $74,000 has required a redraw of my primary range, as shown in the attached chart. Price has now deviated above the range high, confirming the need for patience while we await further distributive price action. The 'Hidden Breaker | OBIF | UNF | Bojan' indicator (visible in the top left of the chart) has proven highly effective in identifying key levels and inefficiencies. I highly recommend it guys! Message @mzyriQuantum for a free trial.
English
Episode #2 of my @hyrotrader_com Challenge is now live on YouTube!
In the epsiode I update the trades and talk a lot about trader psychology, as well as my downfalls and how I am resetting and forging the psychological edge in real time.
Enjoy ⚡️
youtu.be/RnaDWc1E8MA

YouTube
English
@Sol_CJ888 I prefer not to treat the initial range following an extended one-sided move as the true Wyckoff range. Instead, I interpret it more as PS/PSY. Also, given the bullish 2h BOS, I considered it the start of a new range.
English