8TML
3.3K posts

8TML
@8tmlcrypto
Trading Maths & Candles · Building @Versoriumn
Katılım Ocak 2024
80 Takip Edilen1.5K Takipçiler
Take your trading to the next level with HyroTrader’s two brand-new terminal integrations: Tealstreet and Tiger.
What’s New?
Elite Trading Interfaces: Experience professional-grade execution speeds and sharper UI layouts.
Deep Liquidity: Tap directly into live Bybit order books.
Seamless Connectivity: Enjoy instant, rock-solid API integration built for high-performance traders.
Ready to prove your skills and manage up to $200K in funded capital?
Sign up today and get an exclusive 10% discount on all evaluation challenges. Use code [8TML] at checkout, or click the direct link below to apply your savings automatically:
➡️ hyrotrader.com/?coupon=8tml

English

$BTC Update
Supply is supplying, the plan is planning.
Every local level I'm watching is mapped out on the attached chart.

8TML@8tmlcrypto
bitcoin:native A closer look at the current MTF read on Bitcoin. Price has confirmed a nice, volume-dense range, with a deviation of the Range Low already in place. The plan is simple: wait for a Wyckoff accumulation entry; provided the confirmations are present. That Model 1 / Spring POI 🤤
English

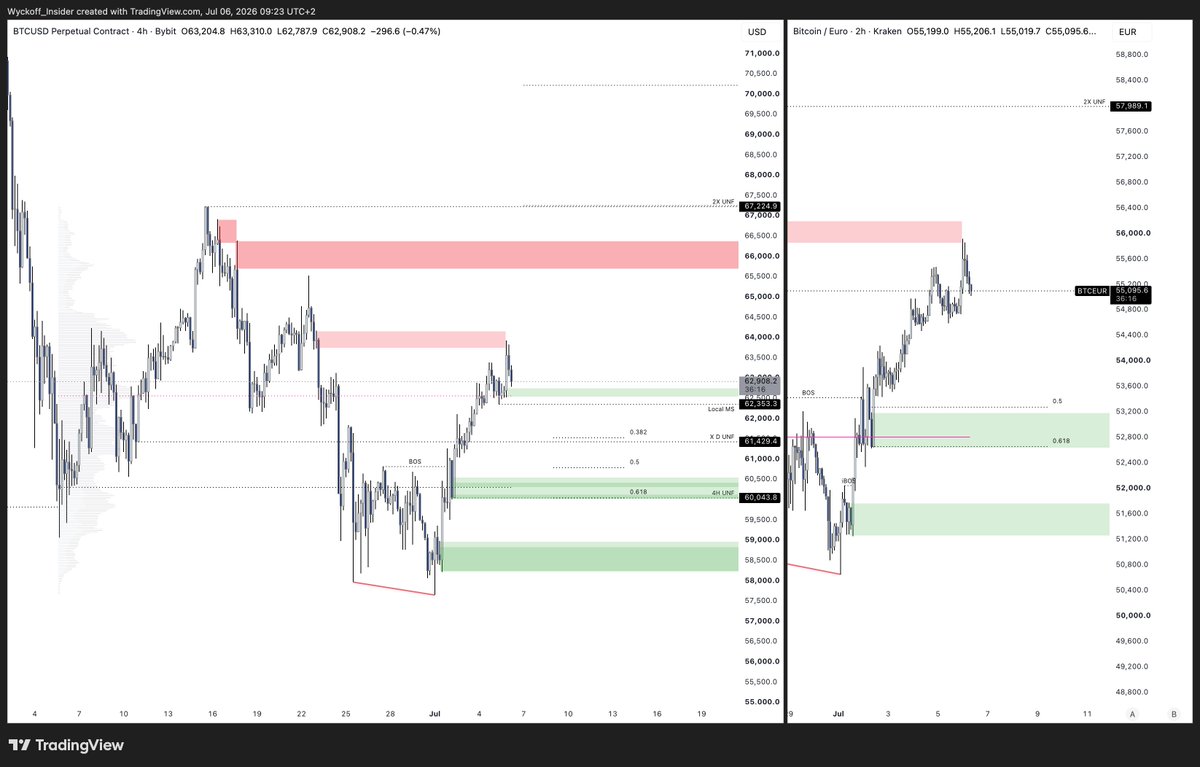
$BTC trade idea for next week.
Currently in a confirmed accumulation, but also facing significant supply.
If we see a clean #TCT / Wyckoff model form in these areas, short it.
Will TP the majority of my position at local range low because counter context.
My pleasure.

English
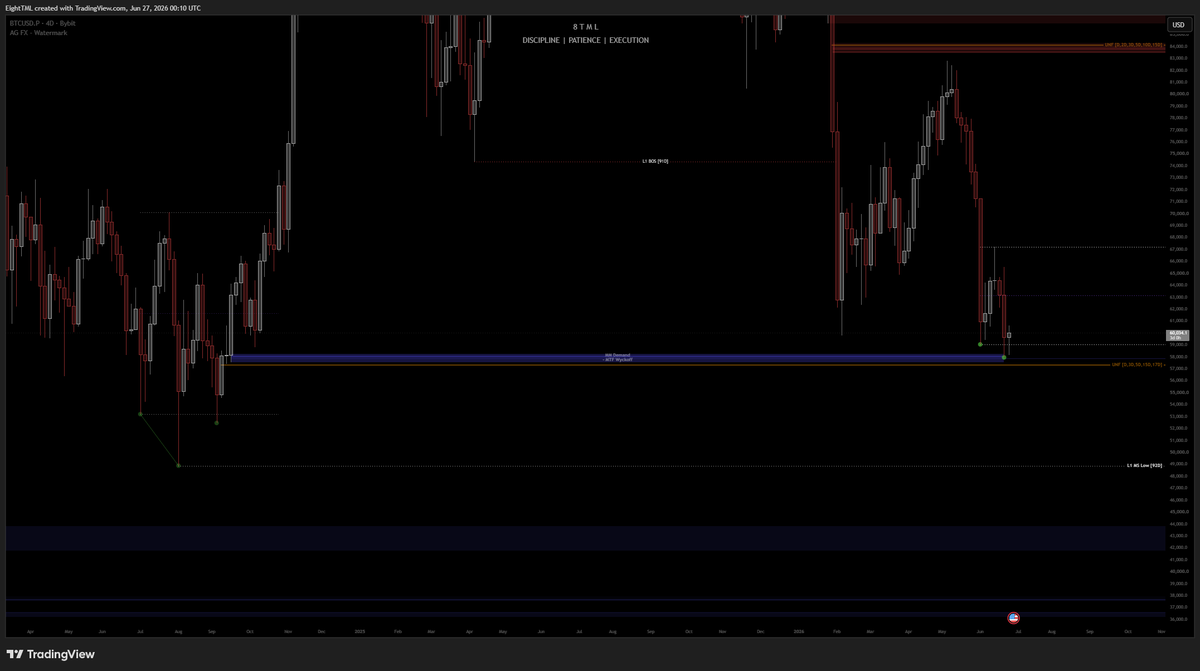
Strong demand zone! 👀 @wozo_capital
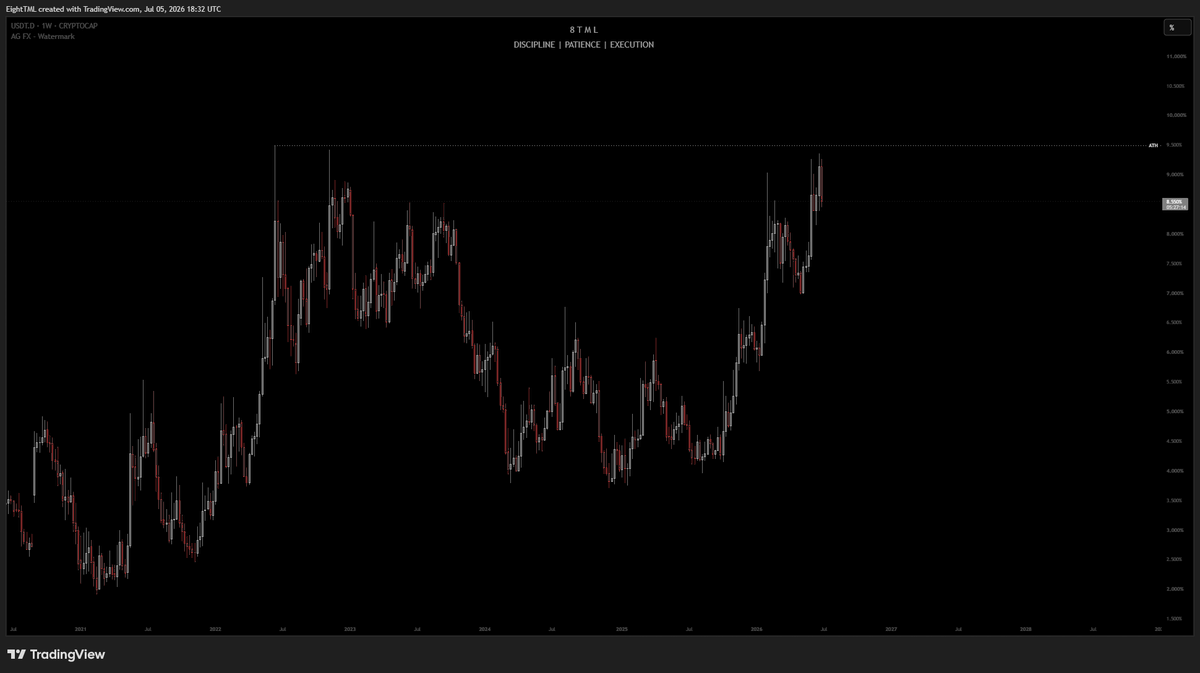
USDT.D taking ATH as a +1?
wozo@wozo_capital
$BTC trade idea for next week. Currently in a confirmed accumulation, but also facing significant supply. If we see a clean #TCT / Wyckoff model form in these areas, short it. Will TP the majority of my position at local range low because counter context. My pleasure.
English


$USDT HTF !!!
let me be clear for anyone that wants to sell their house now to join shorts... 'crypto shorts'
is this the smartest place from a chart perspective to start ?

FLEURSENN🎋@fleursenn
$BTC to buy -> take liq and show strength -> reclaim HTF RES & break structure i dont think there is much reason to bottom ' relief ' from here. ' like i said the relief was needed to get active liquidity back in the game ' -> MM job succesfull my view -> execute on yours.
English
bitcoin:native
A closer look at the current MTF read on Bitcoin.
Price has confirmed a nice, volume-dense range, with a deviation of the Range Low already in place.
The plan is simple: wait for a Wyckoff accumulation entry; provided the confirmations are present.
That Model 1 / Spring POI 🤤

8TML@8tmlcrypto
$BTC is testing a major demand level. High-probability zone to start looking for MTF long setups. Preferring a Wyckoff accumulation schematic for leveraged entries.
English
8TML retweetledi


| EDUCATIONAL CONTENT #2 | Wyckoff Schematic |
In the previous post, we broke down Wyckoff Distribution Schematic Model 2.
The main idea was simple:
Retail calls it a breakout.
Market makers call it inventory distribution.
Now we move into Wyckoff Distribution Schematic Model 1.
Different model.
Same illusion.
Most traders still believe the market moves because of patterns, trendlines, indicators, or “bullish momentum”.
But price is not random.
Price is delivered to areas where liquidity exists.
And in this example, the entire range acts as a controlled environment to engineer belief, attract buyers, absorb demand, and prepare the markdown.
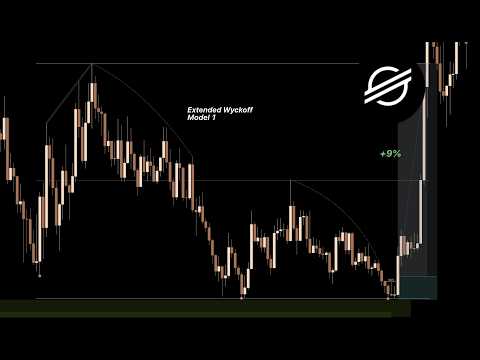
This is a Wyckoff Distribution Schematic Model 1 on German 40 through the lens of market engineering.
After the initial bullish movement, retail sees a range.
They assume the market is consolidating before another expansion higher.
But during distribution, the market needs one thing above everything else:
Buyers.
Large inventory cannot be distributed efficiently into weakness.
It needs demand.
It needs emotion.
It needs breakout traders.
It needs traders to believe higher prices are coming.
That is why the range is built.
It creates structure.
It creates reference points.
It creates liquidity.
And once enough liquidity is engineered, price can be delivered in the opposite direction.
-------------------------------
1st - BC – Buying Climax
-------------------------------
The structure starts with the Buying Climax.
Price pushes aggressively into the first major high.
To most traders, this looks like strength.
The move looks clean.
The candles look bullish.
The narrative becomes continuation.
But in distribution, strength is often the bait.
A Buying Climax is not just bullish momentum.
It is often the first area where aggressive buyers provide the liquidity needed for larger participants to start distributing inventory.
Retail sees strength.
Market makers see buyers to sell into.
That is the first difference.
-------------------------------------
2nd - AR + ST – Defining the Range
-------------------------------------
After the BC, price reacts sharply lower into the AR — Automatic Reaction.
This reaction is important.
Because if the market were truly strong, price should not reject with that level of aggression after making the high.
The AR reveals that supply is present.
Then comes the ST — Secondary Test.
Price attempts to retest the upper area, but the market is no longer expanding freely.
It starts rotating.
And that rotation defines the range.
Highs.
Lows.
Support.
Resistance.
Retail traders use these levels to make decisions.
Market makers use these levels because orders accumulate around them.
Stops above highs.
Stops below lows.
Breakout orders above resistance.
Dip buyers at support.
Shorts entering too early at resistance.
The range is not random.
It is the liquidity map.
-----------------------------------------------
3rd - SOW-B – Sign of Weakness in Phase B
-----------------------------------------------
Inside Phase B, price sweeps into the lower part of the structure and creates the SOW-B.
This is where the first real weakness appears.
Price trades below the range support area, takes sell-side liquidity, and then reclaims back into the range.
To retail, this can look bullish.
They think:
“Support was swept.”
“Price reclaimed.”
“Demand is stepping in.”
“This can still continue higher.”
But from a market-engineering perspective, the market is doing something deeper.
It is creating liquidity on both sides.
First, sell-side liquidity gets taken.
Then price returns back into the range.
Then traders start believing the downside move failed.
That belief is needed.
Because the next objective is not immediately lower.
The next objective is often the buy-side liquidity resting above the range.
---------------------
4th - UT – Upthrust
---------------------
After the SOW-B, price rotates higher and trades back into the upper resistance area.
Then comes the UT — Upthrust.
Price pushes above the previous resistance zone.
Retail sees strength.
Breakout traders start getting interested.
Early shorts get stopped out.
Momentum traders begin to chase.
This is where the illusion becomes stronger.
Because the market is not just moving higher randomly.
It is delivering price into liquidity.
The UT creates the first manipulation above the range.
But it is not the final event yet.
It is part of the process.
The market is teaching traders that breaking above resistance might lead to continuation.
That belief sets up the real trap.
-------------------------------------------
5th - UTAD – Upthrust After Distribution
-------------------------------------------
Now comes the key event of Distribution Model 1.
The UTAD.
Price pushes above the established resistance area again and trades into premium.
This is where the bullish narrative becomes obvious.
Breakout buyers enter.
Early shorts get stopped.
Momentum traders chase.
Retail sees confirmation.
The market looks ready to continue higher.
Exactly the liquidity needed.
But the UTAD is not just a higher high.
It is a liquidity event.
Price moves above the range to access buy-side liquidity resting above resistance.
The move above the high is not the real signal.
The reaction after the move is the signal.
If the breakout were real, price should accept above resistance.
But in this example, price fails to hold above the high.
That failure tells the real story.
The breakout was not respected.
It was used.
Used to trigger buyers.
Used to stop shorts.
Used to complete distribution.
Used to engineer the illusion of strength.
This is why most traders get trapped.
They buy the moment where distribution is already being completed.
-------------------------------
6th - TEST – Testing the Trap
-------------------------------
After the UTAD, price comes back below the resistance area and begins testing the structure from underneath.
This is where the chart becomes very important.
The market gives traders another reason to believe.
Another test.
Another reaction.
Another possible “buy the dip” opportunity.
But structurally, the auction has already shifted.
Price is no longer accepting above resistance.
The tests fail.
Resistance holds.
Demand weakens.
Every reaction becomes less convincing.
This is where former bullish structure starts turning into supply.
The resistance lines are no longer breakout levels.
They become areas where trapped demand gets absorbed again.
Retail still sees a possible recovery.
Market makers see failed acceptance.
And failed acceptance after a liquidity sweep is one of the clearest signs of distribution.
7th - Phase D → Phase E
Once the tests fail, the market begins transitioning from Phase D into Phase E.
This is where the markdown starts.
To retail, the selloff looks sudden.
But it was not sudden.
It was prepared through the entire range.
The BC attracted demand.
The AR revealed supply.
The ST defined the range.
The SOW-B showed weakness.
The UT manipulated above resistance.
The UTAD swept buy-side liquidity.
The tests confirmed failed acceptance.
Then price delivered lower.
The range had already served its purpose.
Liquidity was engineered.
Breakout buyers were trapped.
Early shorts were stopped.
Demand was absorbed.
Resistance held.
The market had no reason to stay elevated anymore.
Now price can move toward the technical target.
The markdown is not random.
It is the result of everything that was engineered inside the range.
The biggest lesson:
Same chart.
Completely different understanding.
Liquidity first.
Acceptance second.
Direction last.
Once you understand this, Wyckoff stops being just a schematic.
It becomes a language for understanding how the market engineers belief before delivering the real move.

xalorising@xalorising
---------------------------------------------------------- | EDUCATIONAL CONTENT #1 | Wyckoff Schematic | ---------------------------------------------------------- Most traders don’t lose because their analysis is bad. They lose because they don’t understand what price is actually engineered to do. Retail calls it a breakout. Market makers call it inventory distribution. This is where most traders misunderstand the market. They believe price moves because of patterns, trendlines, indicators, or “bullish momentum”. But price is not random. Price is delivered to areas where liquidity exists. And in this example, the entire range acts as a controlled environment to create, attract, and absorb liquidity. This is a Wyckoff Distribution Schematic Model 2 on NQ through the lens of market engineering. After the bullish expansion, retail sees consolidation. They assume the market is building strength for the next leg higher. But during distribution, the market needs one thing above everything else: Buyers. Large inventory cannot be offloaded efficiently into weakness. - It needs demand. - It needs emotion. - It needs traders to believe higher prices are coming. That is why the range is built. --------------------------------- 1st - PSY – Preliminary Supply --------------------------------- The first sign that supply enters the auction. Price still looks bullish on the surface, but momentum starts losing efficiency. From the outside, it looks like normal hesitation. From a market-engineering perspective, supply is quietly being introduced. ---------------------------- 2nd - BC – Buying Climax ---------------------------- This is where the public gets excited. The move looks strong. The candles look clean. The narrative becomes bullish. Perfect conditions for distribution. Because aggressive buyers provide the liquidity needed to sell into. A Buying Climax is not just strength. It is often the first major transfer of risk from informed participants to late buyers. -------------------------------------- 3rd - AR + ST – Building the Range -------------------------------------- After the climax, price reacts lower and retests the upper area of the range. This creates structure: Highs. Lows. Support. Resistance. Retail traders need these levels to make decisions. Market makers need these levels because orders accumulate around them. Stops above highs. Stops below lows. Breakout orders above resistance. Dip buyers at support. The range is not noise. It is the liquidity map. ----------------------------------------------------- 4th - UT-B – The Manipulation Above the Range ----------------------------------------------------- Now comes the key event. Price trades above the range high. Retail sees confirmation. Breakout buyers enter. Early shorts get stopped out. Momentum traders chase. Exactly the liquidity needed. That move above the high is not necessarily designed to continue. It is designed to access liquidity. The breakout creates the illusion of strength while distribution is being completed into the buying pressure. This is engineered liquidity. Aggressive Re-entry Into the Range The real signal is not the move above the high. The real signal is the failure to stay there. Once price rejects and cuts back into the range, the story changes completely. If the breakout were real, price should accept above the range. If price immediately returns inside, it means the liquidity above the high was used — not respected. That is the trap. ------------------------------------- 5th - LPSY – Last Point of Supply ------------------------------------- After the failed breakout, price gives one more weak attempt higher. This is where late buyers still believe they are getting a second chance. But structurally, this is often the final opportunity to sell into remaining demand. The market is no longer showing expansion. It is finishing the transfer. ---------------------------------- 6th - SOW – Sign of Weakness ---------------------------------- Then support breaks. This is where market character changes. Breakout buyers are trapped. Dip buyers defend the wrong levels. Old support becomes resistance. Once price retests from below and fails, distribution becomes confirmed. The market has no reason to stay inside the range anymore. The liquidity has already been engineered. --------------------------- 7th - Phase D → Phase E --------------------------- Now the markdown begins. To retail, it looks like a sudden dump. But it was prepared long before. The highs were swept. Breakout buyers were trapped. Shorts were stopped. Demand was absorbed. Support failed. The move down is only the result of everything that was engineered inside the range. ---------------------- The biggest lesson: ---------------------- A breakout is not bullish just because it breaks resistance. A breakout is only bullish if price accepts above resistance. If price sweeps the highs, rejects aggressively, breaks internal support, and turns old support into resistance, it is not strength. It is distribution. Retail sees price. Market makers see liquidity. Retail trades the illusion. Market makers engineer the illusion. Same chart. Completely different understanding. Liquidity first. Acceptance second. Direction last.
English
8TML retweetledi
Traders who show up daily, focused on skill-building:
Outperform those chasing quick profits alone.
Markets teach: consistency trumps greed; every time.

フ ォ リ ス@follis_
Guys who show up every day with the goal of becoming a better trader Will always outperform guys whose only motivation is to make money Lesson in there
English

I’ve been away from X for a while, focusing on extensive backtesting and forward testing while refining my edge.
I remain fully committed and will return stronger than before ..
Yes, i can !
English
$BTC | LTF Setup [Update]
[17.06.2026]
My low-risk long was stopped out as price went on to sweep the low once again.
The SMT with Ethereum remains clear. While BTC continues to raid sell-side liquidity, ETH is just holding up and remains compressed.
I've mapped out the new range I'm watching, but I'm not married to the idea that price must bounce from here. There are still plenty of reasons for BTC to trade lower, so I'll continue to let PA dictate the next move.

8TML@8tmlcrypto
$BTC | LTF Setup [Update] [16.06.2026] Currently operating a low-risk long. Price swept the extreme liquidity level, but front-ran the extreme demand zone, giving price a reason to re-visit lower; $65,500. 0.4% risk for potential 7R. If price goes for the demand, I will re-evaluate and watch the reaction there.
English
$BTC | LTF Setup [Update]
[16.06.2026]
Currently operating a low-risk long.
Price swept the extreme liquidity level, but front-ran the extreme demand zone, giving price a reason to re-visit lower; $65,500.
0.4% risk for potential 7R.
If price goes for the demand, I will re-evaluate and watch the reaction there.

8TML@8tmlcrypto
$BTC | LTF Setup [16.06.2026] Watching this LTF accumulation range on Bitcoin for a potential Wyckoff Model 2 accumulation. - SMT[ETH} - HTF Discount Zone (<0.5) - 2h SFP - Clean M2 POI (Extr. Liquidity + Demand) Monitoring for confirmation and expansion from this range, at the HTF POC.
English

Great question! After uploading the video, I noticed I forgot to mention that the FVG I talked about in the beginning (above the demand) WAS filled.
So instead of mitigating the demand, it filled the FVG, and went higher.
And about the risk; The demand frontrun doesn’t change the fact that the model is confirmed, but I would have considered higher risk % if it was mitigated.
English