
DOT showing a classic conflict setup right now 👇
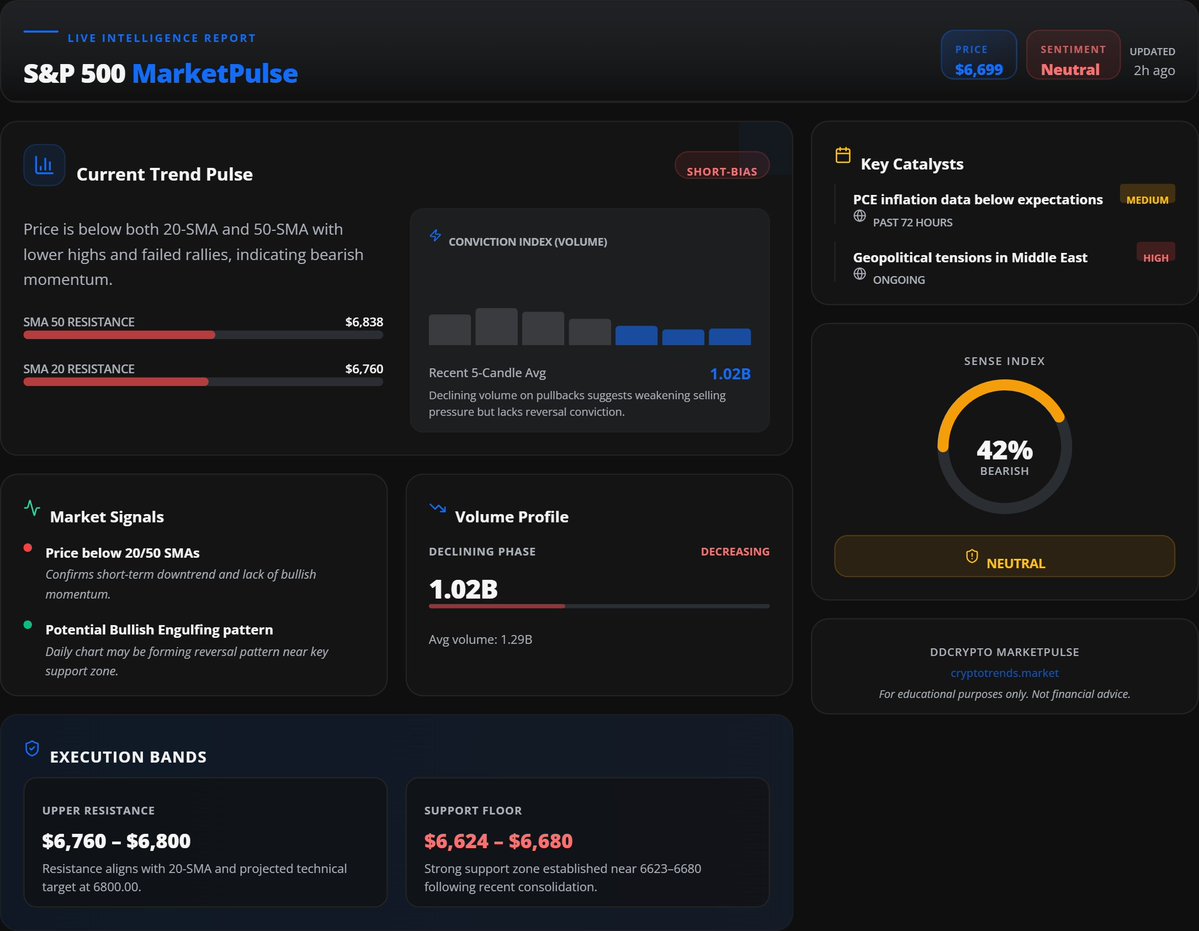
📉 Trend (HTF): Bearish — lower highs, below SMAs
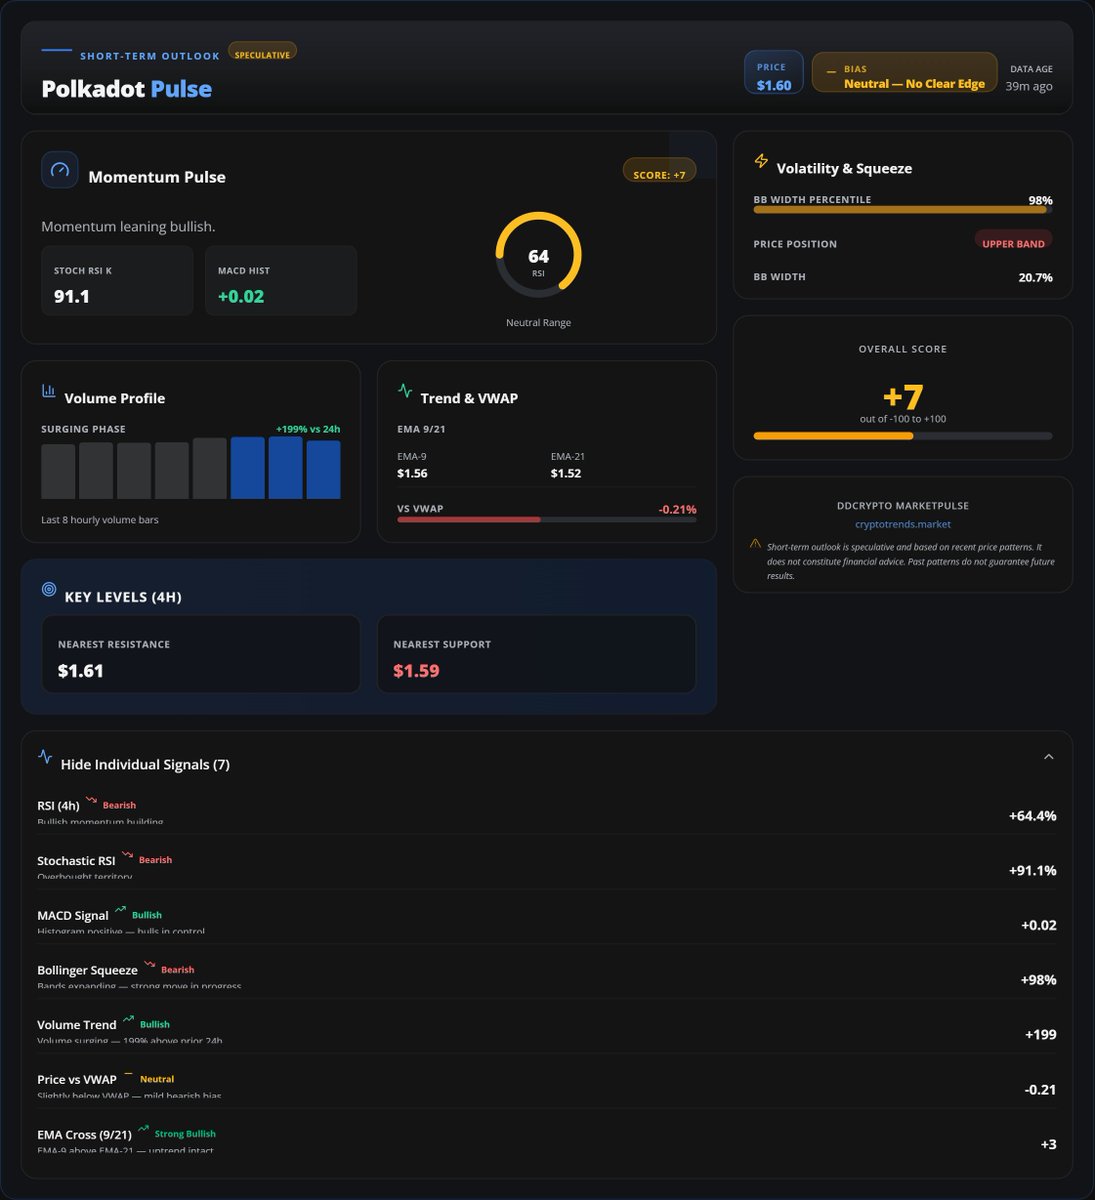
📈 Short-term: Attempted bounce with strong volume
⚡ Volume: +199% surge → real activity
📊 Momentum: Mixed (MACD bullish, but Stoch RSI overbought)
🖼️ Chart read:
• Clear downtrend structure after rejection
• Weak bounces → sellers still in control
• Current move looks like relief rally into resistance
⚠️ Key issue:
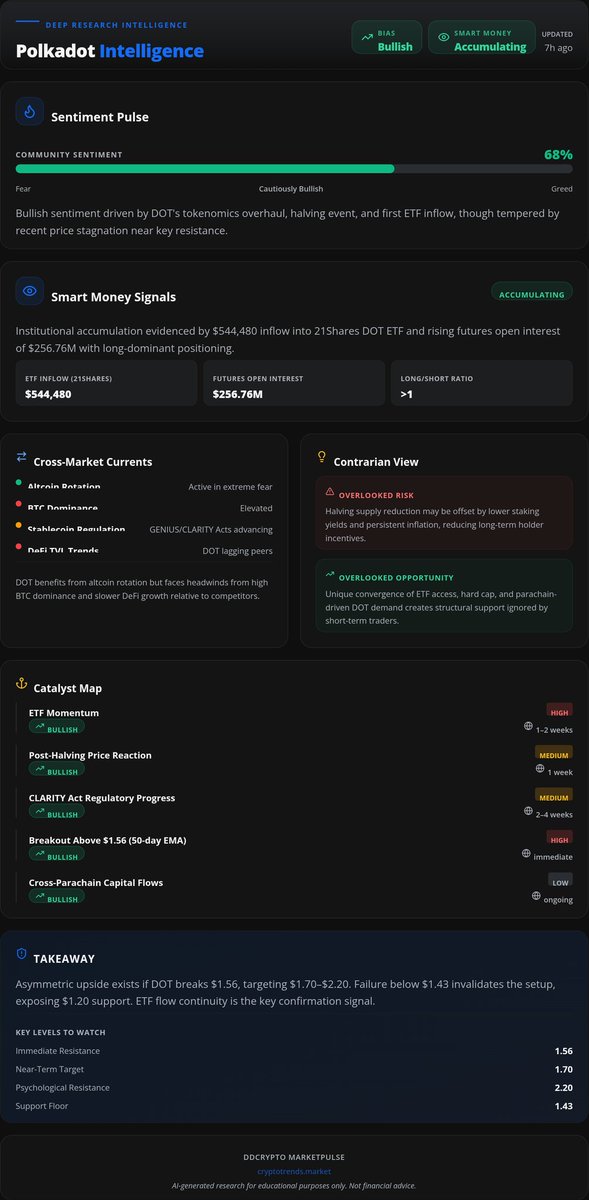
Bullish catalysts (ETF + supply cap)
❌ NOT translating into price strength yet
🎯 Levels that matter:
• $1.60–$1.65 = major supply zone (rejection area)
• $1.50 = breakdown trigger
• $1.40 → $1.35 = downside targets
🧠 Setup:
Break $1.65 → trend reversal + squeeze
Reject here → continuation of bearish structure
⚖️ Bias: Neutral → leaning bearish unless breakout confirms
🔗 Full analysis: cryptotrends.market
#DOT #Polkadot #Crypto #Altcoins #CryptoTrading #Trading #MarketPulse
For educational purposes only. Not financial advice.

English