
ᴍᴇᴍᴏʀɪᴇsɪᴛ
899 posts


I'm developing a new indicator
It will identify:
1. Liquidity
2. Heatmaps
Who wants it?
English
ᴍᴇᴍᴏʀɪᴇsɪᴛ retweetet

Bull Run 2026 Pattern:
January – Accumulation
February – Bitcoin Rally
March – Alt season
April – Bitcoin 250K
May – Bull Trap
June – Mass Liquidations
July – Bear Market
Bookmark this and check back in 6 months
English

$BTC to $82,000?!
I am bearish and looking for shorts!
-Like
-Comment: "BTC"
-Follow me (so I can DM you)
And I will send you this trade setup + explanation!
English
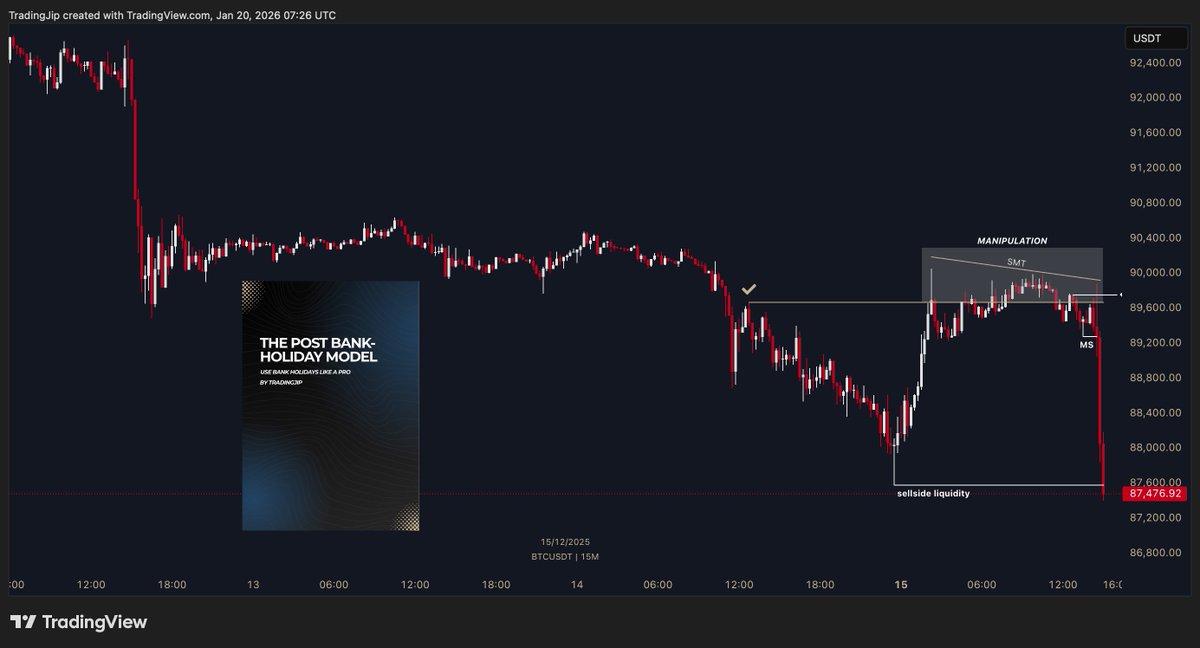
The Post Bank Holiday Trading Model
I’ve written a guide explaining it
Like + Comment "BANK" and I'll send you the PDF
(must follow me)
English
ᴍᴇᴍᴏʀɪᴇsɪᴛ retweetet

ᴍᴇᴍᴏʀɪᴇsɪᴛ retweetet

All 9 classes of angels including the Seraphim 👁️🪽 if you'd like a video explaining these just let me know.

English
ᴍᴇᴍᴏʀɪᴇsɪᴛ retweetet

🚨 THIS IS WHY ALTCOINS ARE BLEEDING
Nobody knows what they’re talking about, so I’ll explain everything.
People need to stop saying retail is gone, that’s not the story.
This move isn’t coming from small players, and the timing is not random.
Here’s the real explanation:
This pressure is coming from funding and leverage.
Over the last few weeks, altcoin funding rates turned aggressively positive.
That means:
– Too many longs
– Too much leverage
– Too many positions
When leverage builds up like this, bad news isn’t required for the price to drop.
A small dip is enough.
That dip liquidates crowded longs, liquidation pressure pushes price lower, stops get hit, spot holders react late, and forced selling takes over.
Then it repeats.
This is exactly what’s playing out right now.
Just look at the data:
– Open interest is starting to fall
– Longs are being liquidated aggressively
– Spot buyers are nowhere to be found
Excess leverage is being removed.
And here’s what most people don’t get: this is actually a good thing.
You don’t get sustainable upside when the entire market is already long.
Just so you know, I’ve been studying macro for over 20 years, and I’ve been in Bitcoin for more than a decade. I called the last 2 major market tops and bottoms.
When the next bottom is in and I start buying BTC again, I’ll say it here so you can copy my moves.
If you still haven’t followed me, you’ll regret it.

English
ᴍᴇᴍᴏʀɪᴇsɪᴛ retweetet
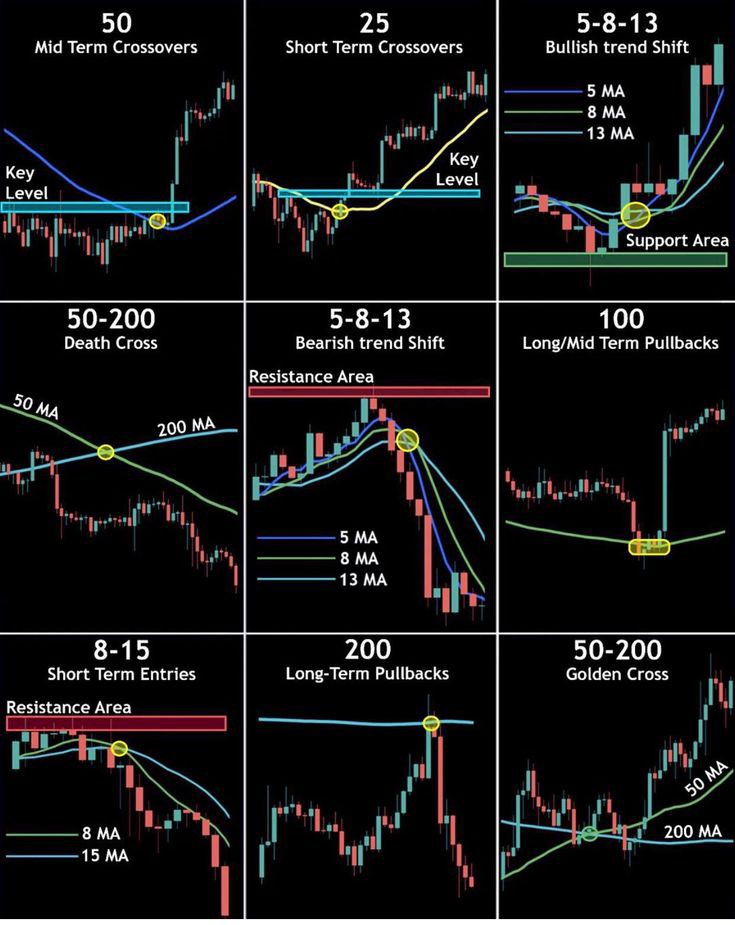
9 MOVING AVERAGE ROAD MAP.
1.50 mid term crossover
2.25 short term crossover
3.5-8-13 Bullish trend
4.50-200 Death cross
5.5-8-13 Bearish trend shift
6.100 Long/mid term Pullbacks
7.8-15 Short term entries
8.200 Long term Pullbacks &
9.50-200 Golden cross
English
ᴍᴇᴍᴏʀɪᴇsɪᴛ retweetet

ᴍᴇᴍᴏʀɪᴇsɪᴛ retweetet

ᴍᴇᴍᴏʀɪᴇsɪᴛ retweetet

🕯️ HISTORY DOESN’T WARN — IT RHYMES
Two different sources.
Two different centuries.
One identical message.
📉 Benner Cycle (1870)
📊 Modern Market Mapping
1999 → High prices → SELL
2007 → High prices → SELL
2023 → Accumulation → BUY
2026 → “Good Times” → SELL EVERYTHING
Markets don’t collapse at fear.
They collapse at belief.
2026 is not a crash year.
It is a risk-transfer year.
Smart money exits quietly.
Narratives peak.
Retail arrives confidently.
Crashes come after good times —
never during them.
Those laughing at cycles today
will be forced to respect them tomorrow.
🔻 Timing is not prediction
🔻 It is survival
History doesn’t repeat.
Human behavior does.
✍️ @AlgoBoffin
...

English
ᴍᴇᴍᴏʀɪᴇsɪᴛ retweetet
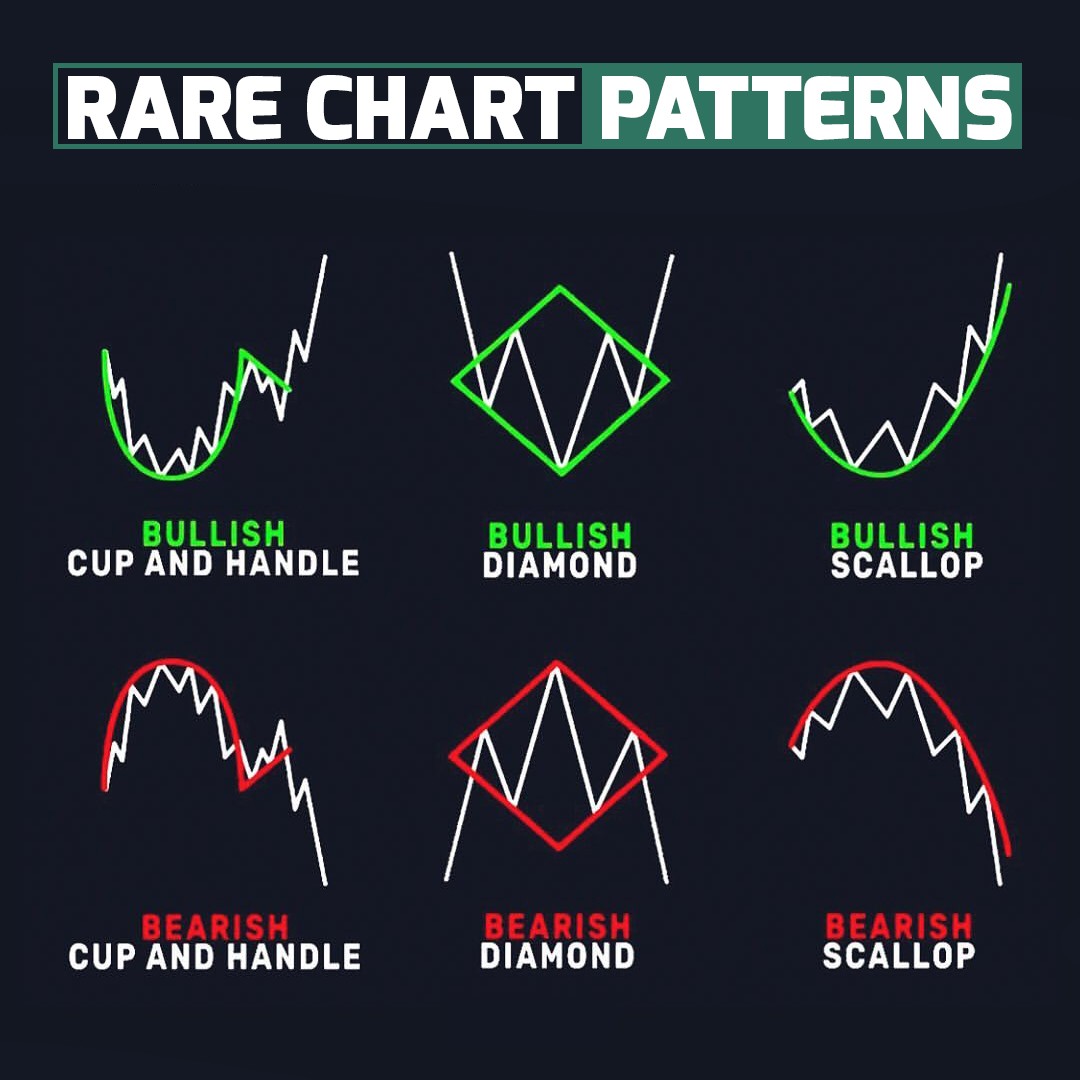
Start your 2026 with big problem of most investors 👇
16 classic chart patterns
1.Ascending Triangle
2.Falling wedge
3.Bulish flag
4.Bullish symmetrical Triangle
5.Descending triangle
6.Rising wedge
7.Bearish wedge
8.Bearish flag
9.Bearish symmetrical Triangle
10.Double bottom
11.Tripple bottom
12.Inverted H&S
13.Falling wedge
14.Double top
15.Triple Top&
16.Head&shoulders

English
ᴍᴇᴍᴏʀɪᴇsɪᴛ retweetet

ᴍᴇᴍᴏʀɪᴇsɪᴛ retweetet
🚨 THIS IS VERY, VERY BAD!!
I spent days looking at where the global financial system is heading…
And next year will be rough.
97% of people will lose EVERYTHING in 2026.
Not because of a classic recession or a bank run.
It’s something much bigger than that, let me explain:
In sovereign bond markets, especially U.S. Treasuries.
Bond volatility is already starting to wake up.
The MOVE index has been creeping higher, and historically that doesn’t happen without a reason.
Bonds don’t move on vibes or narratives but they move when funding conditions are starting to tighten.
What makes this worrying is that three major fault lines are lining up at the same time:
First, the U.S. Treasury.
In 2026, the U.S. has to roll and issue an enormous amount of debt while running massive deficits.
At the same time, interest costs are exploding, foreign buyers are stepping back, dealers are more balance-sheet constrained than ever, and long-end auctions are already showing signs of stress.
Bigger tails, weaker demand, less appetite to absorb supply.
That’s not a theory, it’s already visible in the data.
This is how funding shocks start.
Not with panic, but with auctions that quietly struggle.
Second, we have Japan.
Japan is the largest foreign holder of U.S. Treasuries and the backbone of global carry trades.
If USD/JPY keeps pushing higher and the Bank of Japan is forced to react, carry trades unwind fast.
When that happens, Japanese institutions don’t just sell domestic assets…
They sell foreign bonds too.
That loop puts even more pressure on U.S. yields right when the Treasury needs demand the most.
Japan doesn’t cause the shock by itself. It amplifies it.
Third, we have China.
Behind the scenes is a massive local-government debt problem that hasn’t gone away.
If stress there turns into a visible credit event, the yuan weakens, capital looks for safety, commodities react, and the dollar strengthens.
That feeds directly back into higher U.S. yields again. China becomes another amplifier, not the origin.
The trigger for all of this doesn’t need to be dramatic.
It could be something as simple as a poorly received 10-year or 30-year Treasury auction.
One bad auction at the wrong time is enough to spike yields, tighten global funding, and force risk assets to reprice quickly.
We’ve seen this movie before, the UK gilt crisis in 2022 followed this exact path.
The difference now is scale. This time, it’s global.
If that kind of funding shock hits, the sequence is fairly predictable: long-term yields jump, the dollar strengthens, liquidity dries up, risk assets sell off hard, and volatility spreads everywhere.
That’s not a solvency crisis, it’s a plumbing problem. But plumbing problems move fast.
And then comes the response.
Central banks step in. Liquidity gets injected.
Swap lines open. Buybacks and balance sheet tools come back into play.
The system stabilizes but at the cost of another wave of liquidity.
That’s when the second phase starts.
Real yields fall, hard assets catch a bid, gold breaks higher, silver follows, Bitcoin recovers, commodities move, and the dollar eventually rolls over.
The shock clears the way for the next inflationary cycle.
That’s why 2026 matters…
Not because everything explodes permanently, but because multiple stress cycles peak at the same time.
And the early signal is already there.
Bond volatility doesn’t rise early by accident.
The world can handle recessions… but what it struggles with is a disorderly Treasury market.
That’s the risk building beneath the surface and it’s worth paying attention to long before it shows up.
I was one of the only people who called the top in October, and I’ll do it again, that’s literally my job. Pay close attention.
Alot of people will wish they followed me sooner.

English
ᴍᴇᴍᴏʀɪᴇsɪᴛ retweetet

#Litecoin (#LTC) 🇺🇸
Expected Outlook for the Cryptocurrency on the 1-Hour Timeframe
Reversal Pattern ⚡️
👉 A trailing diagonal pattern is forming, representing wave C of a flat pattern, within a corrective wave of a higher degree. 👌
✨ Upon completion of this pattern through a breakout of a key level and a break 🏹 above the upper boundary, this would confirm a bullish outlook, indicating that we are entering an upward wave 🔥 that may push the price to form a new high, and ideally reach 100% 💸 of the length of the previous wave.
✨ The upside may extend further depending on market developments.
👉 What Supports This Outlook:
1️⃣ A diagonal wave is forming to represent wave C.
2️⃣ A solid reversal pattern that may end at the 79.08 level.
3️⃣ Corrective movements that support the formation of the desired diagonal pattern.
For Our Daily Premium Analysis 👉 : elliottwavesacademy.gumroad.com/l/PremiumAnaly…
For Our Educational Program Analysis 👉 :
elliott-waves-academy.com/products/ellio…
#elliottwave #tradingview #technicalanalysis #swingtrading #waveanalysis #BTCUSD #cryptocurrencies #btctrading #forexdubai #forexeurope #forexuk #ETHUSD #tradingstrategies #priceactiontrader #ethereumtrading #ethereuminvestment #ethereumprice #bitcoinsignals #priceactiontrading #forexmalaysia #forexespanol #forexfrance #tradingacademy #forexaustralia #bitcointrading #Dogecoin #LTCUSDT

English
ᴍᴇᴍᴏʀɪᴇsɪᴛ retweetet

September: Consolidation
October: Up
November: Up
December: Bitcoin ATH
January: Altseason
February: Bear market
March: Down
April: Down
May: Bear market bottom
Bookmark this tweet and compare later 🔖

English
ᴍᴇᴍᴏʀɪᴇsɪᴛ retweetet
In this THREAD I will explain “Basic Trading Indicators”
1. RSI
2. MACD
3. Moving Average
🧵(1/23)

English
ᴍᴇᴍᴏʀɪᴇsɪᴛ retweetet

ᴍᴇᴍᴏʀɪᴇsɪᴛ retweetet
1.Fibonacci
2.Breakout
3.Reversal
4.Elliot wave
5.Fair value gap
6.Candlestick
7.Heikin Ashi
8.Moon Phases
9.Renko
10.Harmonic patterns
11.Support &resistance
12.Dynamic s& R
13.Trend lines
14.Gann Angles
15.Momentum
16.Oscillators
17.Divergence
18.Volume
English