Angehefteter Tweet
PRIME
2.7K posts


PRIME
@Prime_Analysis
Financial Analyst || Operations Analyst
Nigeria Beigetreten Eylül 2017
1.3K Folgt1.2K Follower


A gig from Utiva? Bring 🤭
I’m accepting “Congratulations”
English
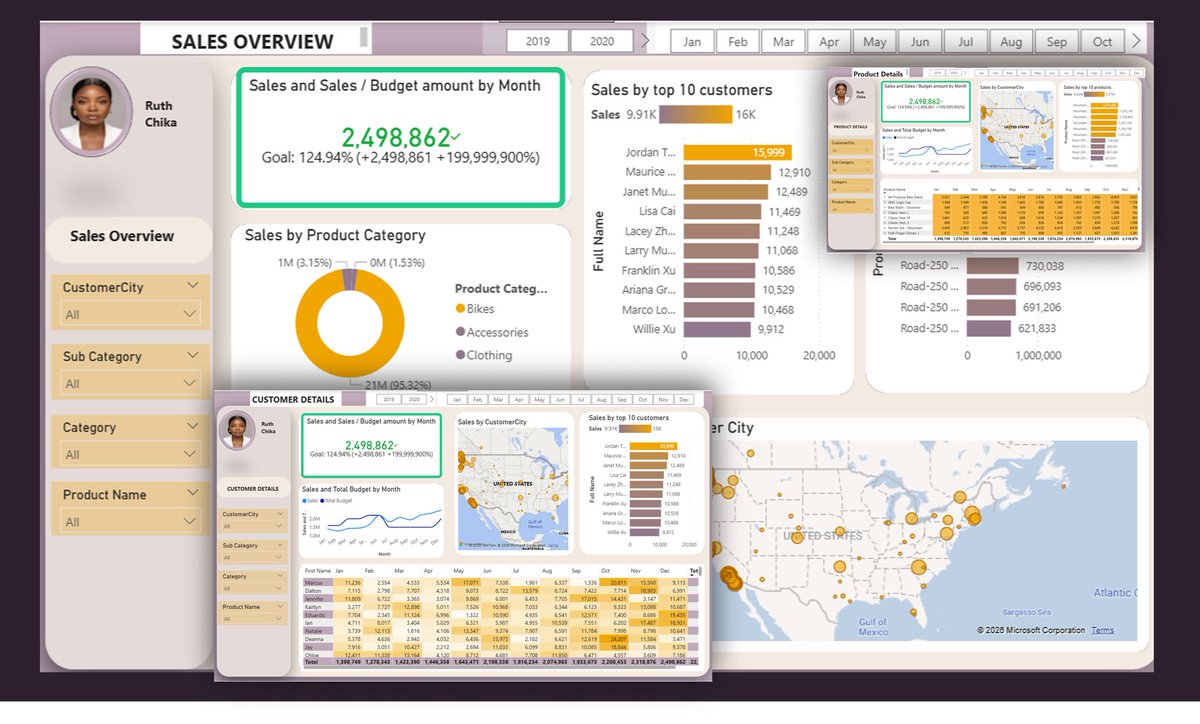
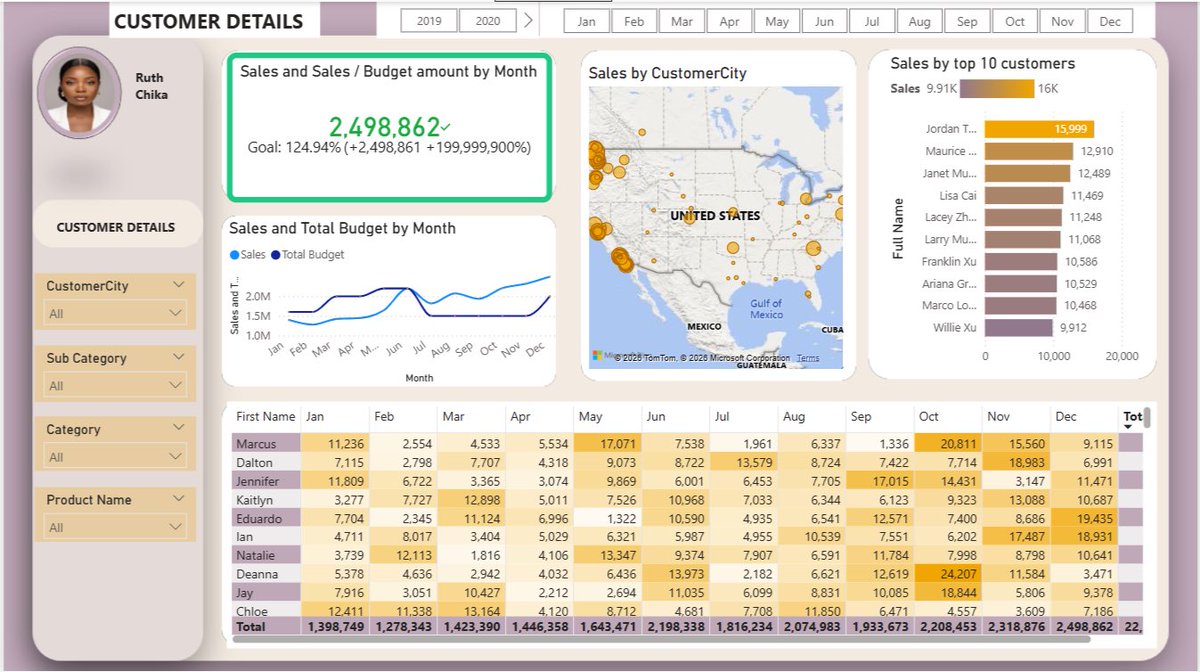
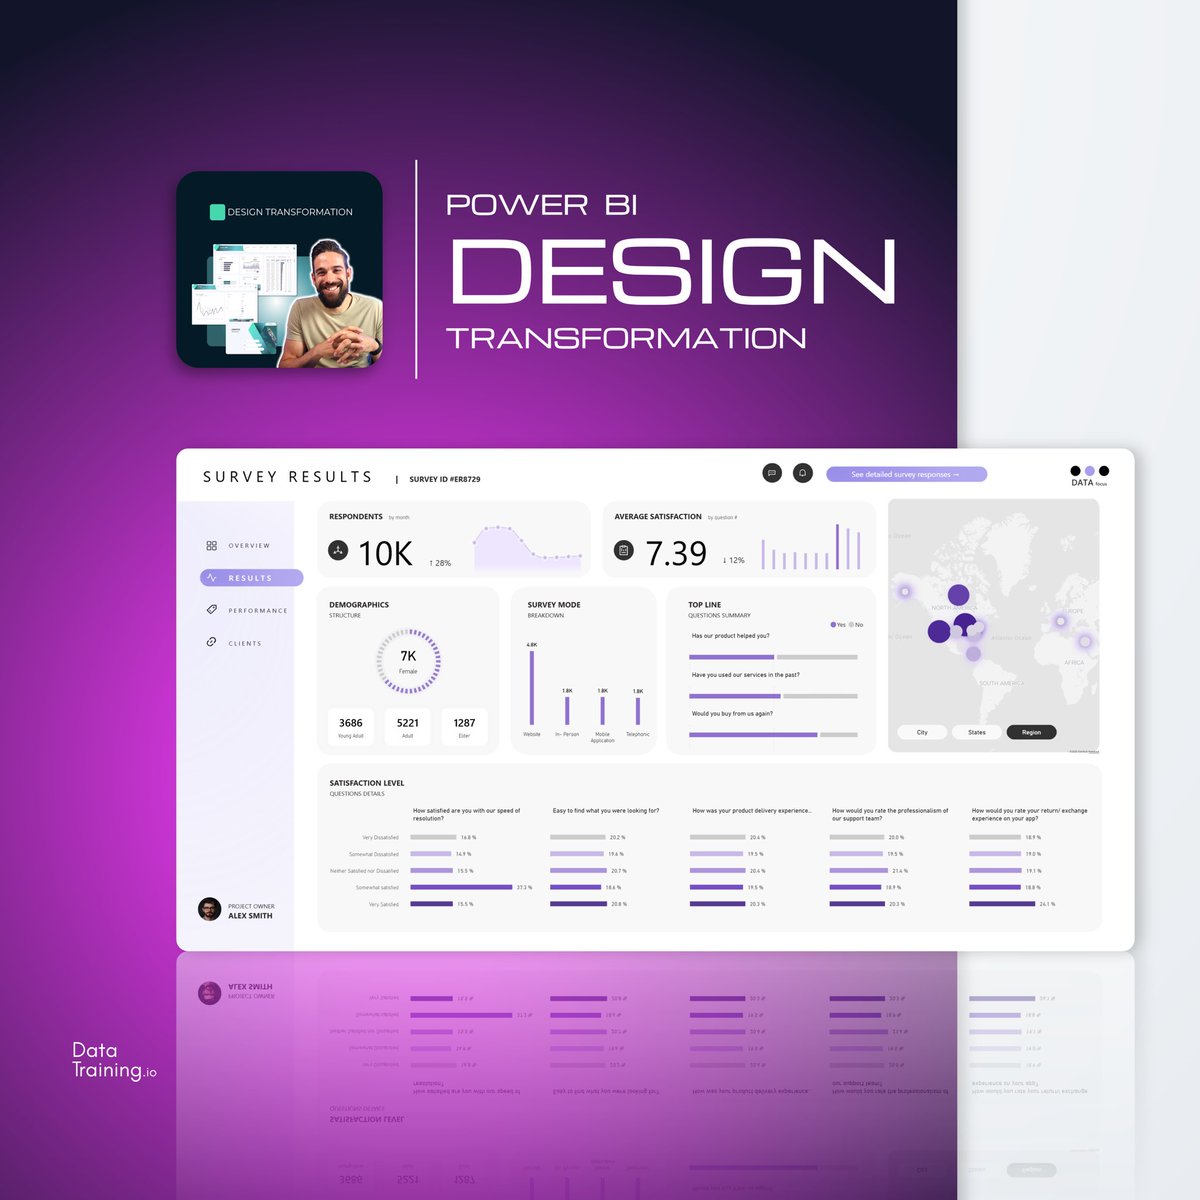
@RuthChika12 😌1280 * 720 >>> 1920 * 1080😌
Gives more space for those names hiding and table.
English

@Prime_Analysis 1280 * 720 the default power bi canvas size
English
Just finished a guided project on Sales Analysis project using SQL Server & Power BI.
I extracted and cleansed data from a real database, then built 3 interactive dashboards to answer actual business questions.
Full project on GitHub 👇
🔗 github.com/Ruth-Chika/sal…
#120DaysOfDataWithTina #SQL #PowerBI #BuildInPublic #dataanalysislockedin


English

What you can slowly add to your Data Analytics skills.
Business Automation,
Data Engineering.
Don’t thank me, act instead.
English

Don't force children to take science if they interested in Arts
Issued in public interest!!
😂😄🤣
#Wisdom

English
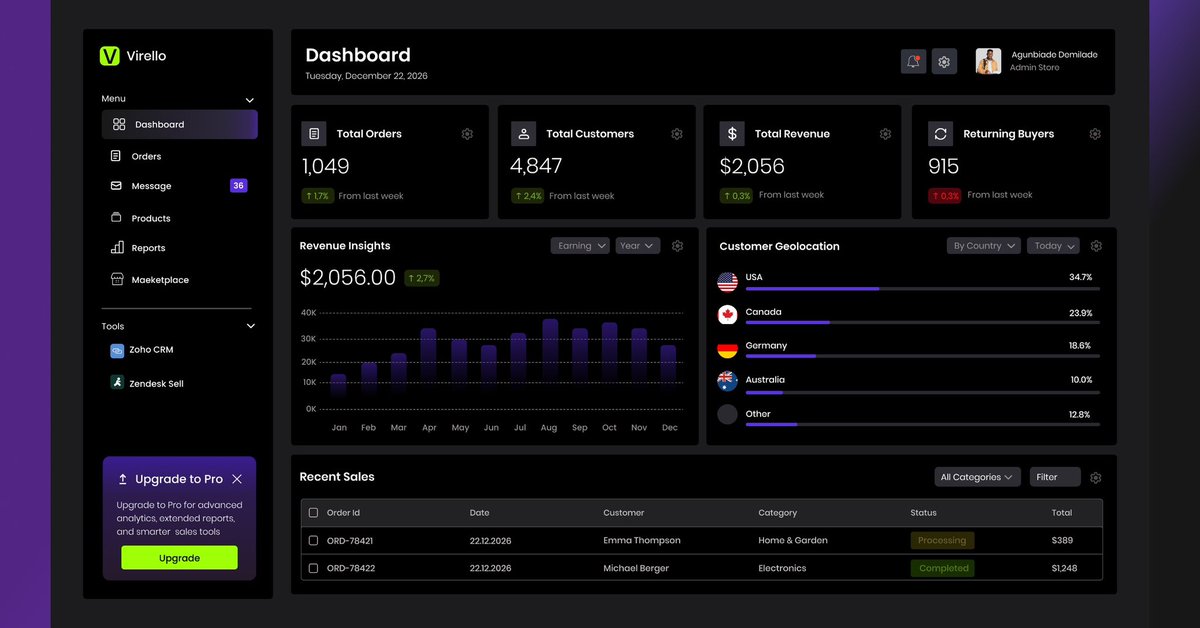
Bi Developers, on avg, how long will this take in Power BI or Tableau?
I know Excel can’t do it so excel people please shit.
Note: this is a UI design by @Agunbiadesina1 not an actual analysis.
Demilade 𝕏 🇦🇸@Agunbiadesina1
I challenged myself to design a modern, clean, and data-driven eCommerce dashboard UI
English
PRIME retweetet

@Prime_Analysis @iam_daniiell This year I say make I dey mind my business, as I see am I pass 😂😂
Make una no put me for talk
English
😂😂😂
Omo na joke ooo, excel can actually do it
My bet on @ObohX and @iam_daniiell
Rahman@Rahm_anda
@Prime_Analysis @Agunbiadesina1 Bro you just read my mind😂, check my recent post😂
English

@Prime_Analysis @Agunbiadesina1 Who said Excel people can't recreate it
English
@dhisaniya @Agunbiadesina1 Hmmm
3-5 days
It’s a 6 page analysis ooo
English

@Prime_Analysis @Agunbiadesina1 It takes 3 to 5 coz thinking of what data to show takes alot of time for me.
English

I challenged myself to design a modern, clean, and data-driven eCommerce dashboard UI
English

You think that you need to learn all tools for you to become a data analyst or job ready?
Guess what, you can be a data analyst and job ready by first learning data analytics concepts, context and Excel.
Many have limit data analytics to Tools and dashboard.
PRIME@Prime_Analysis
I don’t get why this sounds funny. In the right context, you become job ready as a data analyst within 3 months.
English
I don’t get why this sounds funny. In the right context, you become job ready as a data analyst within 3 months.
ìtùnú🍬@ExtracoolBB
You can be job-ready within 3 months as a data Analyst.
English
PRIME retweetet

Data Analytics mistakes beginners should avoid:
1. Jumping Straight to Visuals
- Skipping Data Cleaning (EDA)
- Leads to incorrect charts
- Clean and explore data first
- Understand the "shape" of your data
2. Relying Solely on Excel
- Limited with large datasets
- Hard to automate complex tasks
- Learn SQL for data extraction
- Try to use Python/R for advanced analysis
3. Overcomplicating Visualizations
- Too many colors and chart types
- Confuses the end-user
- Keep it simple and clean
- Use the right chart for the right data
4. Ignoring the "Why" (Business Context)
- Reporting numbers without meaning
- Analysis doesn't solve a problem
- Understand business goals first
- Focus on actionable insights
5. Poor SQL Habits
- Using SELECT * on huge tables
- Writing unreadable, messy queries
- Use aliases and formatting
- Filter data early with WHERE
6. Missing Outliers and Distributions
- Only looking at the "Average" (Mean)
- Outliers can skew your results
- Check median and standard deviation
- Visualize distributions with histograms
7. No Documentation or Comments
- Hard to reproduce your work
- You’ll forget your logic in a month
- Document your data sources
- Comment your code and SQL scripts
8. Correlation vs. Causation
- Assuming $A$ caused $B$ just because they moved together
- Leads to false business advice
- Look for underlying factors
- Use A/B testing where possible
9. Not Validating Results
- Trusting the output blindly
- Logic errors in formulas/queries
- Cross-check totals with raw data
- Peer-review your findings
10. Poor Communication Skills
- Great analysis, but poor presentation
- Getting too technical with stakeholders
- Tell a story with your data
- Focus on the "So What?" for the audience
English
PRIME retweetet

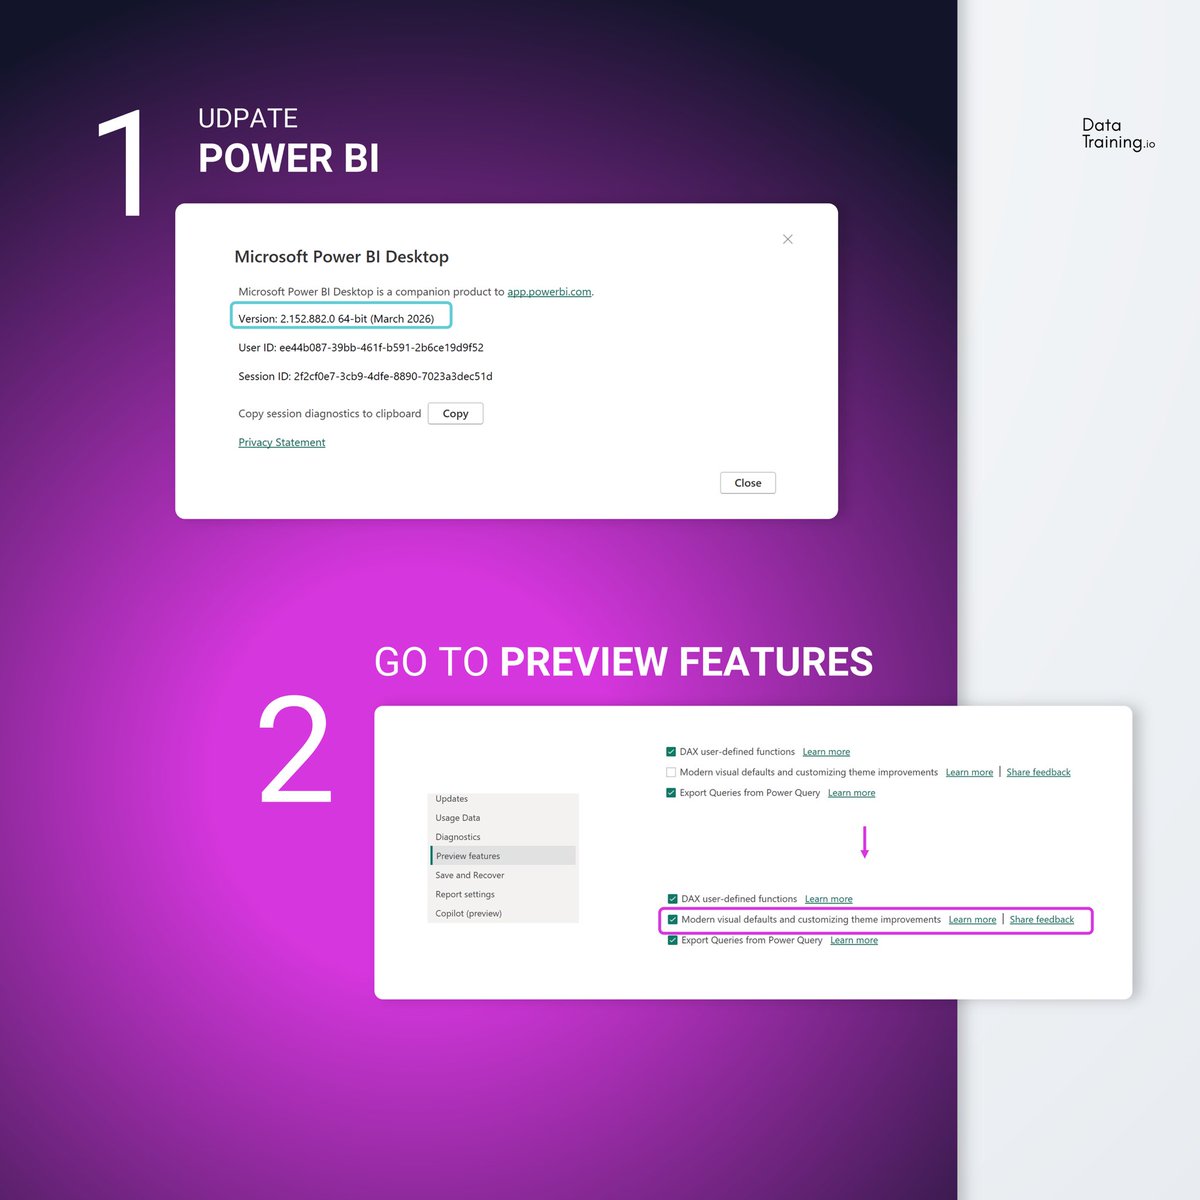
New in the Power BI March 2026 Update ✌🏻
Set the default page size directly in themes
Have you tried it already?
Follow for more Power BI news ✅
#powerbi #update #new #setpage #analytics


English