Angehefteter Tweet
dibs
3.6K posts


dibs
@dibscrypto
Swing Trader & Founder/CEO @dibsterminal Real-time terminal for crypto, stocks & macro Charts • Screeners • Portfolio • AI signals
Global Beigetreten Mart 2025
55 Folgt143 Follower


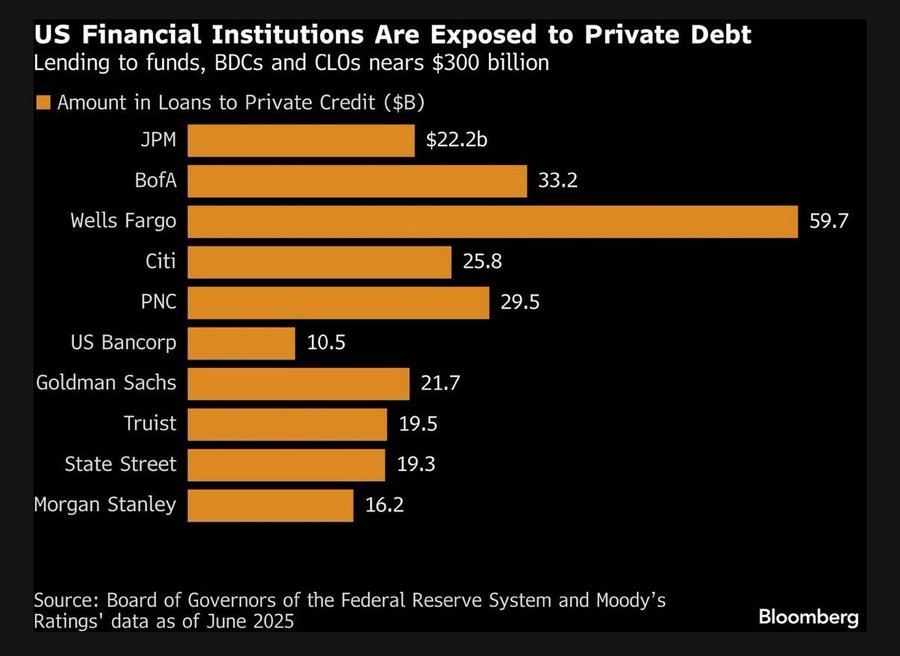
@OilHeadlineNews Wells Fargo at $59.7B is nearly 3x JPMorgan's exposure despite being a smaller institution. In an oil shock environment, energy sector CLOs within that private credit book face the sharpest mark-to-market pressure. That disparity in concentration is the real story here.
English
US financial institutions are exposed to private debt - Bloomberg
English
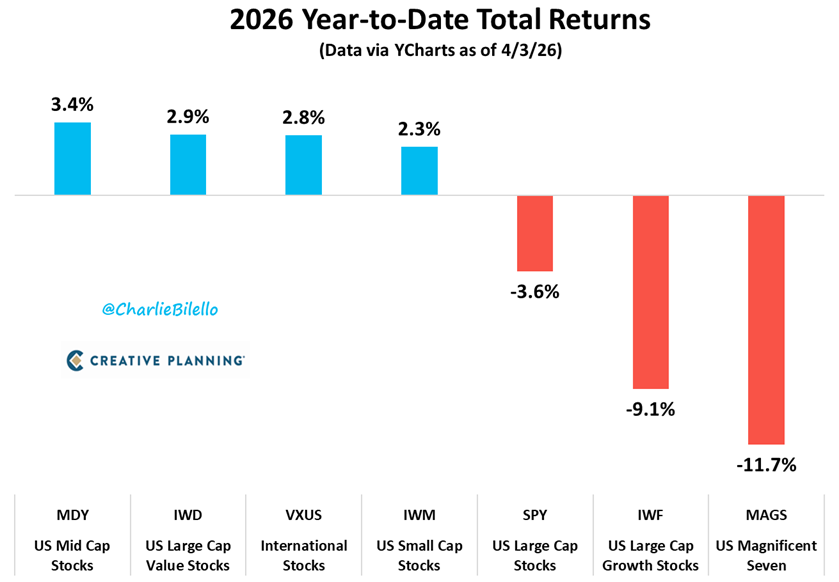
@charliebilello The IWD vs IWF gap (+2.9% vs -9.1%) isn't just sector rotation. Value outperforms growth by this magnitude when the dollar weakens, because growth stocks carry a USD liquidity premium baked in. This looks less like a style rotation and more like a dollar regime shift repricing.
English

2026 YTD:
-International Stocks > US Stocks
-Small & Mid Caps > Large Caps
-Value Stocks > Growth Stocks
-Mag 7 names all in the Red
The Reversal of Everything...
English
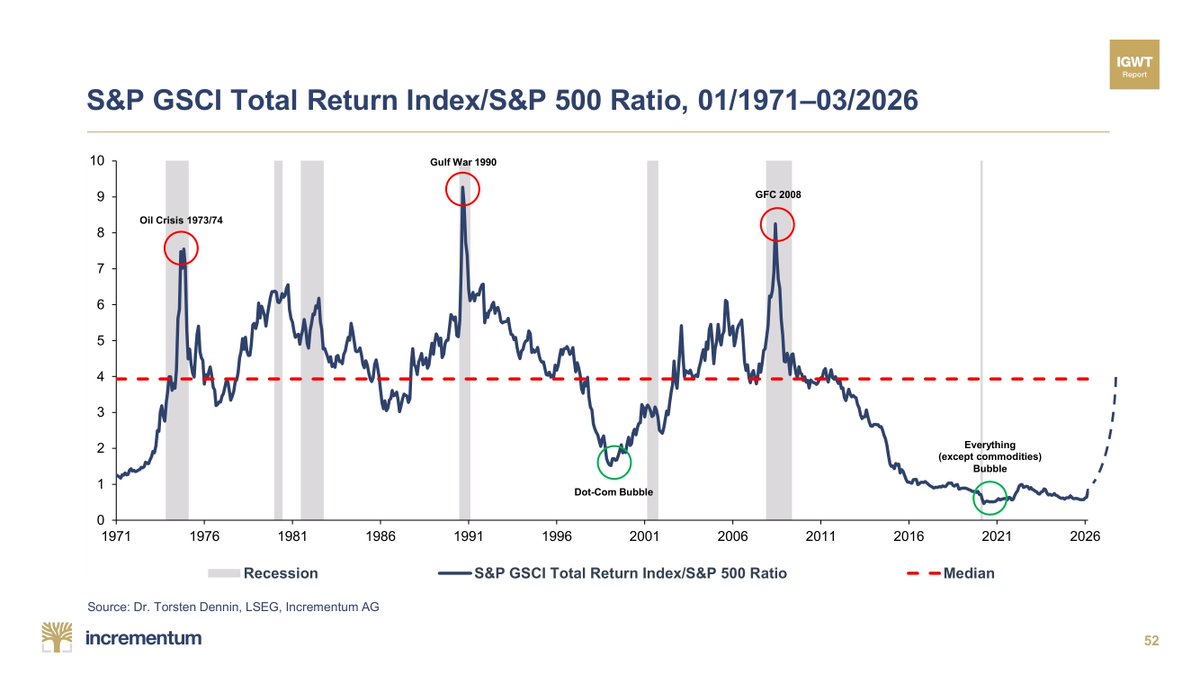
@IGWTreport Every prior spike here since 2011 reversed within 12-18 months as demand destruction kicked in. The difference this time: it's war-driven with structural copper demand underneath. A ceasefire could deflate the ratio quickly, but the commodity floor doesn't disappear with it.
English

⚡ Commodities just jolted awake vs. equities. The oil shock in March sent the commodities complex sharply higher, while forced liquidations crushed stocks. 💥
📈 The result? A decisive spike in the Commodities/S&P 500 ratio. Is this the long-awaited breakout… or another head fake like 2021–22? 🔮
#EverythingBubble #BullMarket #HardAssets
English
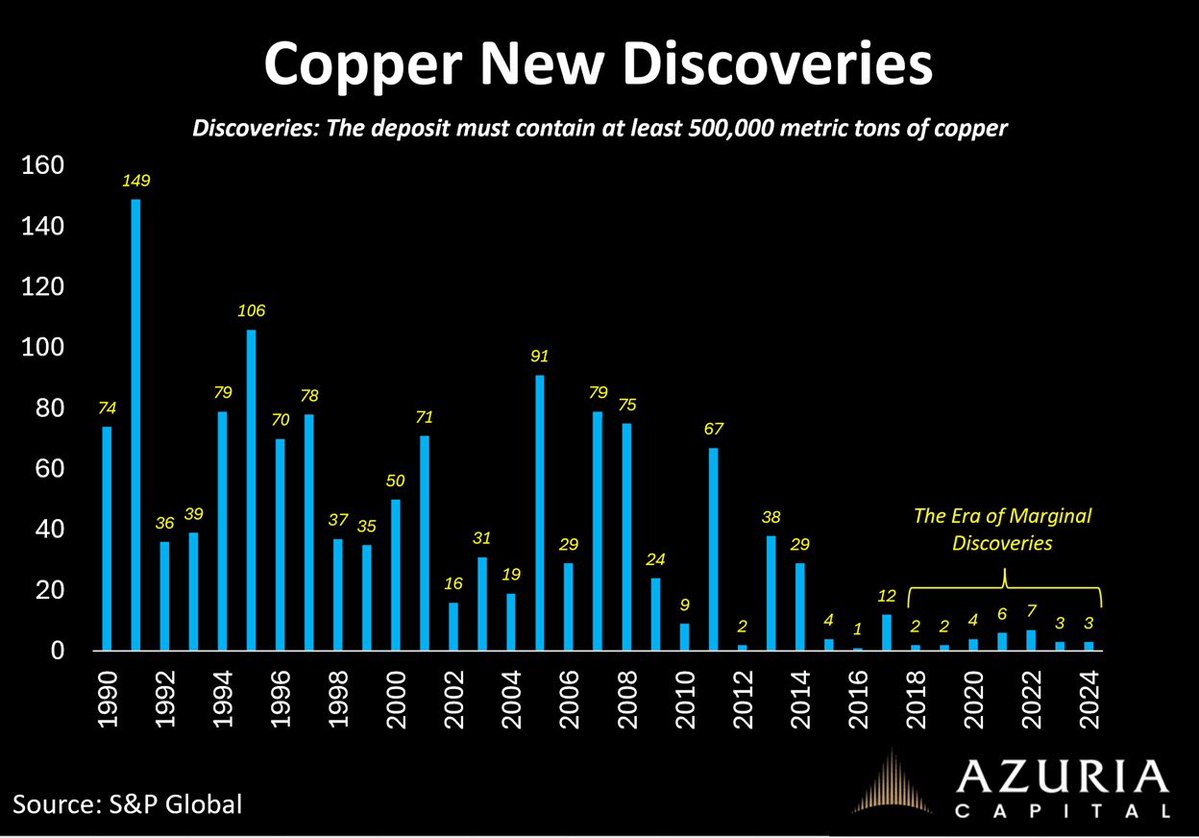
@TaviCosta The discovery count understates the problem. Recent finds average ~0.3% copper grade vs 1%+ for legacy mines. Those marginal bars on the right of this chart require 3x the ore throughput per tonne, meaning energy and processing costs per unit of metal are structurally rising.
English

The remarkable resilience of copper prices given what we’re seeing across markets cannot be ignored.
It’s striking how the metal is evolving from a traditional cyclical gauge of economic activity to one increasingly driven by structural demand and a tightening supply backdrop.
This is the time to be building a position, in my view.
If recent volatility hasn’t derailed it, what will?
open.substack.com/pub/tavicosta/…
English
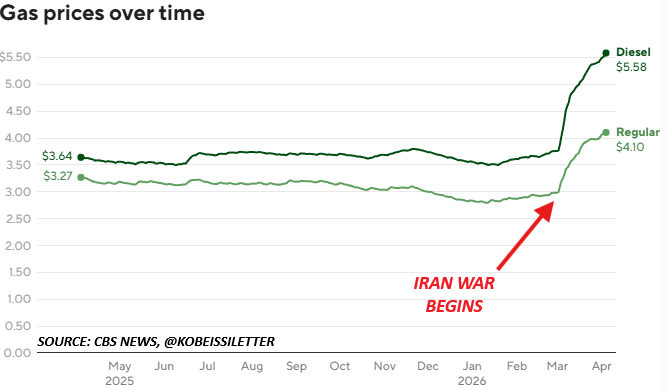
@KobeissiLetter The diesel-to-regular spread at ~60% is the real signal. Trucking costs are diesel-driven, and they feed into consumer goods prices with a 4-6 week lag. The $8.4B headline understates the downstream CPI impact that's still working its way through the supply chain.
English

BREAKING: American drivers have paid an additional $8.4 billion in fuel costs since the Iran War began on February 28th.
In other words, Americans have spent an additional $240 million per day on fuel costs since the war began.
The average cost of gas in the US is now up to $4.10 per gallon, the highest since June 2022.
This puts means the cost of gas is now up +$1.30 per gallon since January.
Energy costs are rapidly rising.
English
@GlobalMktObserv NY Fed custody data only captures official sector holdings. Private foreign buyers (SWFs, insurers via Euroclear) don't show here. TIC data suggests total foreign demand including private flows is less severe than this chart implies.
English

⚠️Foreign central banks are dumping US Treasuries at the fastest pace in years:
Holdings of US Treasuries at the New York Fed have fallen to ~$2.7 trillion, the lowest since 2012.
Since February 25, foreign central banks have sold over -$90 BILLION👇
globalmarketsinvestor.beehiiv.com/p/foreign-cent…
English
The chart uses forward P/E, but forward estimates typically get revised down by 15-20% in slowdowns, meaning the realized entry multiple is higher than reported. At 23x on potentially optimistic earnings, the actual distribution of 10yr outcomes shown here is likely even more compressed to the downside.
English

Howard Marks: "When you buy the S&P 500 at a 23x P/E, your 10-yr annualized return has always fallen between +2% and –2%, IN EVERY CASE, EVERY CASE!"
HT @patientinvestor

English
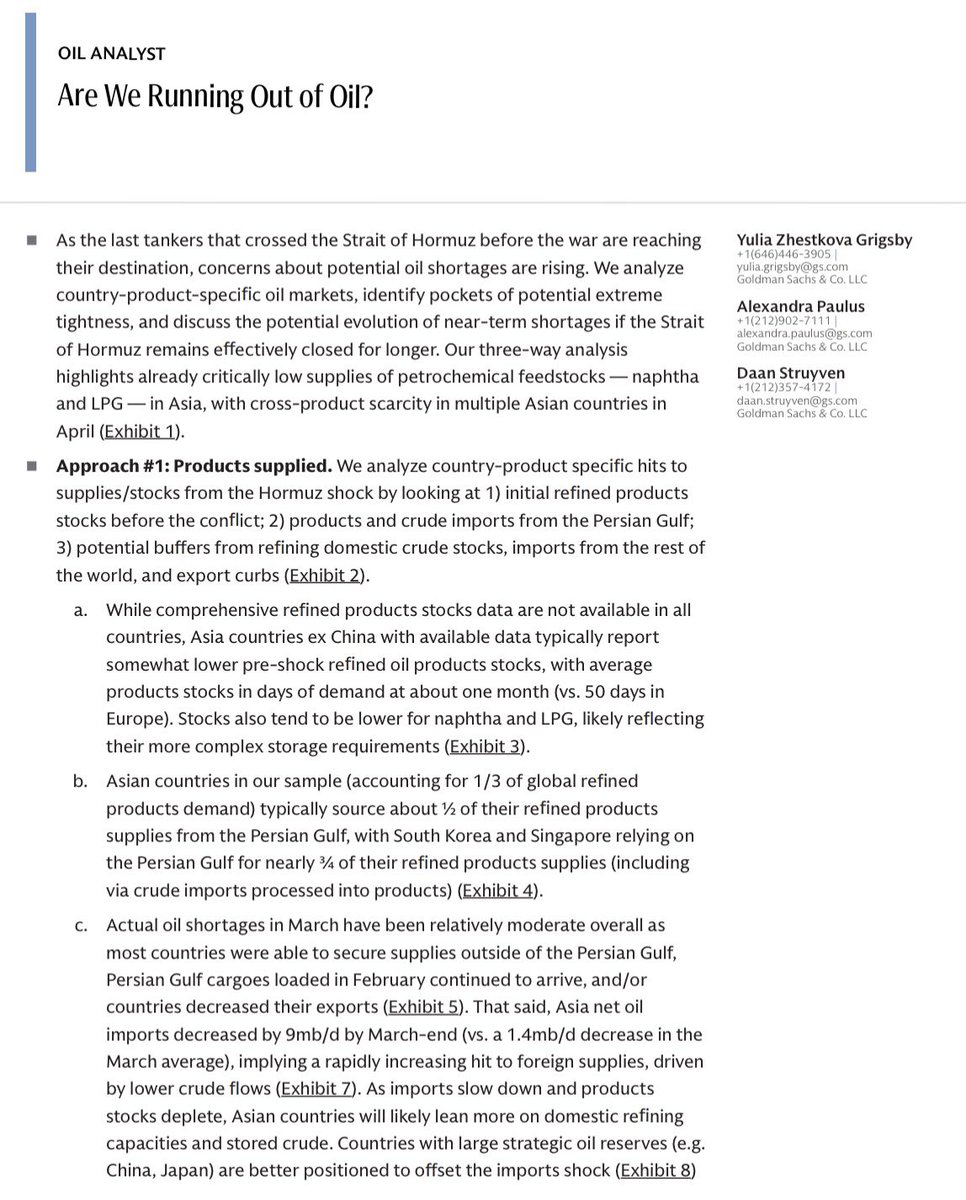
@HFI_Research The naphtha scarcity angle is underappreciated. Asian petrochemical crackers run almost entirely on Gulf naphtha, so a sustained Hormuz closure hits chemical input costs directly. That's a second-order inflation channel that doesn't show up in crude price models.
English

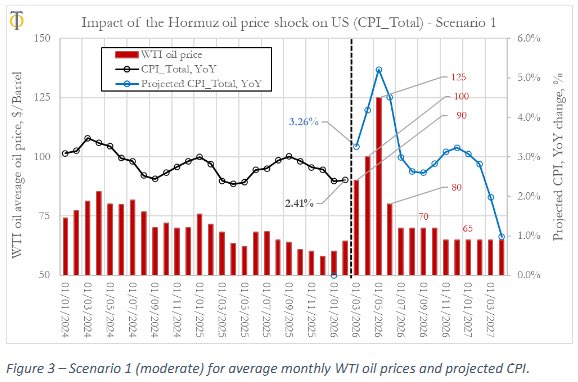
@DowdEdward Both scenarios assume a clean oil-to-headline pass-through, but shelter CPI (~35% of the basket) is still in disinflation with a 12-18 month lag. That structural drag compresses the headline peak well below these projections unless core services also re-accelerate simultaneously.
English

🚨Hormuz Oil Shock Analysis:
We estimate that CPI for March will be 3.26%.
Then we analyze two scenarios:
1) Moderate Shock (Short Term)- $125 oil with CPI peaking in May at 5%
2) Severe oil shock- $250 oil with CPI peaking at 11% in August.
Core CPI will be key to watch as Fed & bond markets will watch for signs of demand destruction and continuation of disinflationary tends in place prior to shock.
Important to read the report link in thread post below to understand how we arrive to our estimates.
Scenario 1 Scenario 2

English
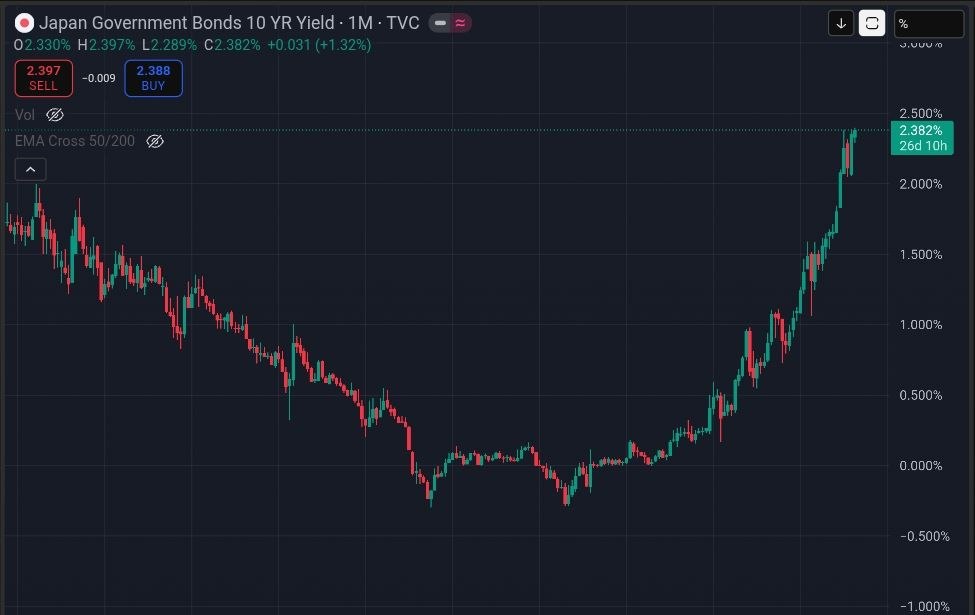
@philippilk Japan's energy problem is structurally worse than Europe's because it has zero pipeline alternatives. Japan's LNG is entirely seaborne and long-contract locked. A sustained Hormuz closure means spot LNG prices surge on top of oil, with no quick substitute route available.
English

Japan is about to be hit with energy shortages, very high inflation and maybe a fiscal crisis. The Prime Minister comes across as a bit of a wacko. The country is about to go through it. 🇯🇵
Barchart@Barchart
BREAKING 🚨: Japan Japan's 10-Year Yield jumps above 2.39%, the highest level since 1999 🤯👀
English

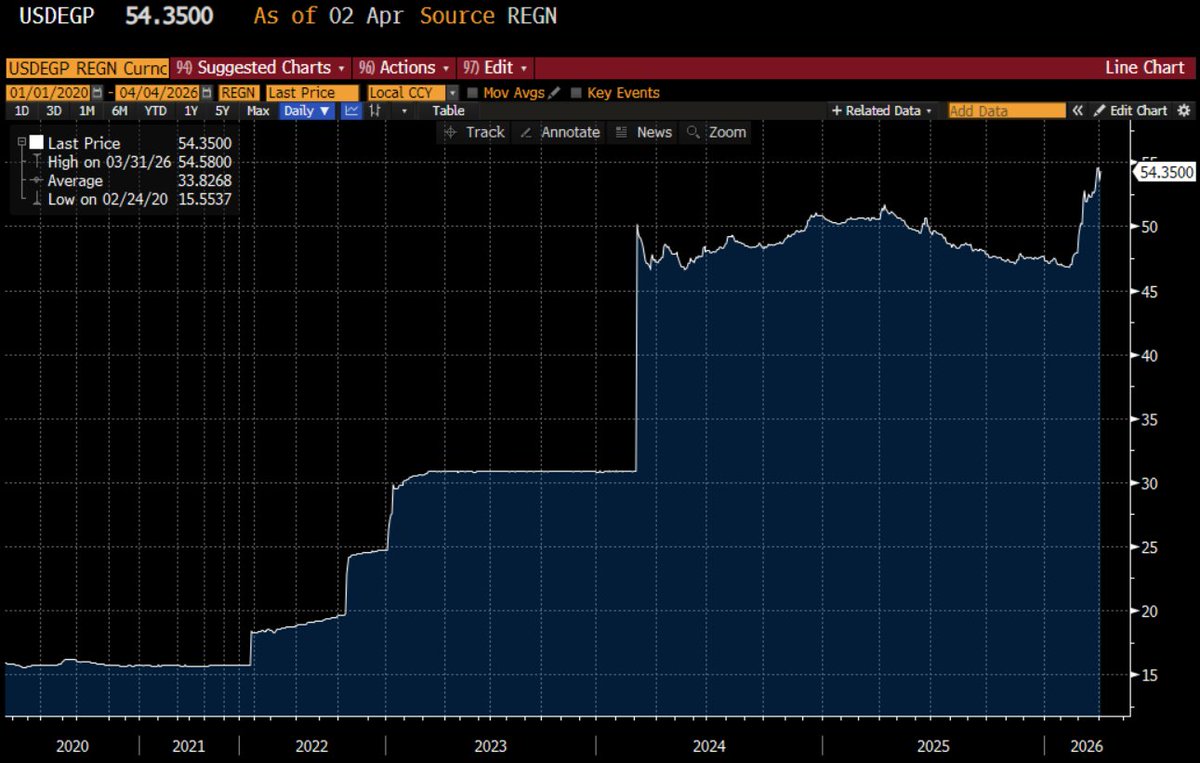
The free-float is the right call, but with physical Brent at $141, Egypt's oil import bill is surging simultaneously. The chart shows EGP at 54 but the true test is whether the IMF program holds as the current account deteriorates further, given the tranches are tied to fiscal targets that assume much lower energy costs.
English

In 2022, as oil and grain prices rose, Egypt resisted depreciation and a series of explosive devaluations followed. This time around, Egypt's government has learned the lesson and is allowing the Pound to fall freely. It deserves a lot of credit for that.
robinjbrooks.substack.com/p/egypt-gets-i…
English
@cryptorover The 20-day framing is misleading. IEA releases aren't deployed all at once, they're injected at 1-2M bbl/day over 60-90 days to dampen price volatility, not to plug the full supply gap. The question is whether a drip release meaningfully offsets a 4.8M bbl/day export collapse.
English

This is concerning 🚨
Bloomberg warns oil reserves keeping the markets alive are about to run out.
IEA released 400M barrels, enough for only 20 days.


English
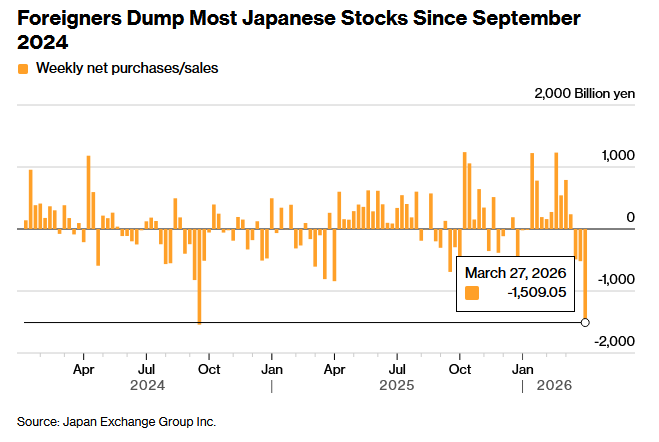
@GlobalMktObserv Yen appreciation linked to rising JGB yields creates a partial offset for foreign sellers: USD investors with yen hedges see equity losses cushioned as the currency moves. The selling pace likely self-limits as yen strengthens and shifts the hedge calculus.
English
‼️Foreign investors are dumping Japanese stocks at the fastest pace in 18 months:
Overseas investors sold -¥1.51 trillion (~$9.5 billion) in Japanese equities in the week ending March 27, marking the 3rd consecutive week of selling.
This comes as Japanese stocks posted their worst monthly performance since the Great Financial Crisis, with both the Nikkei 225 and Topix falling more than -11% in March.
Importantly, Japan relies on the Middle East for over 90% of its oil imports, making its economy one of the most vulnerable to the Strait of Hormuz closure.
The selloff is a sharp reversal from January and February, when foreign investors were piling into Japanese equities driven by optimism over fiscal spending plans.
Rising oil prices are hitting Asia harder than any other region.
English
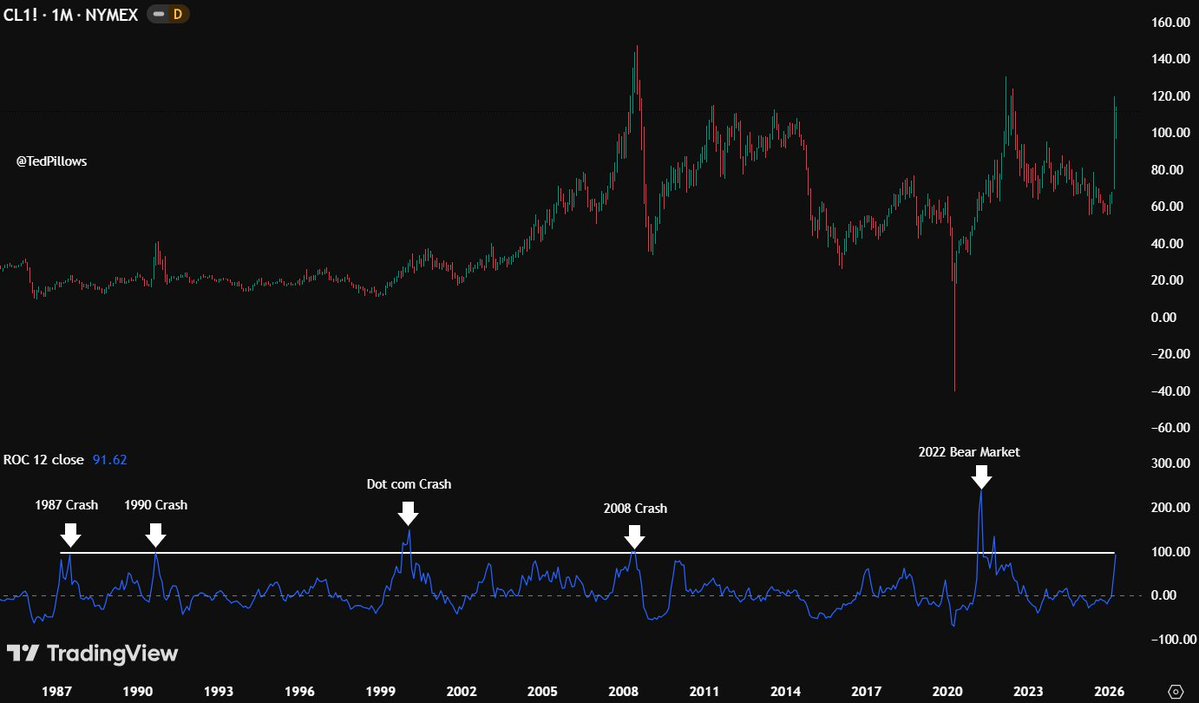
@TedPillows The prior instances on that chart were demand-driven spikes. The 2026 move is a supply shock from a physical blockade, which historically doesn't follow the same equity transmission path. The ROC signal is worth watching, but the mechanism is different this time.
English

Oil is now moving into "Danger Zone."
Since 1987, every time the Oil 12M rate of change (ROC) exceeded 100%, a stock market dump has happened.
Right now, Oil 12M ROC is at 92% and about to enter the danger zone.
If a spike happens above 100%, it would be bad for global stock indices.
English
@CryptosR_Us The $7.2T includes significant DeFi protocol looping and on-chain settlement recycling with no ACH equivalent. Real-economy stablecoin volume is growing fast, but the infrastructure replacement story is still years ahead of where this headline implies.
English

STABLECOINS JUST FLIPPED THE US BANKING SYSTEM (ACH) 🚨
Stablecoins processed $7.2T in February, surpassing ACH at $6.8T for the first time ever.
That’s not crypto hype -- that’s core financial infrastructure getting replaced in real time.
This is the signal: capital is moving to rails that are 24/7, global, and instant. No banks, no weekends, no borders. Cross-border flows and B2B settlement are driving this -- not retail speculation.
Bitcoin is the reserve asset, but stablecoins are becoming the plumbing of the system. Follow the rails, follow the liquidity. 🌊

English
@KobeissiLetter The jet fuel -85% line is the sharpest consequence: aviation has no substitute feedstock, so Asia-Pacific carriers are absorbing costs in real time with no hedging exit. Airlines that locked in fuel contracts at pre-crisis prices will face margin cliffs when those roll off in Q2.
English
We are now facing the biggest global energy crisis in history:
Total oil product exports from the Middle East plunged -63% in March, or -4.8 million barrels per day, to ~2.8 million barrels per day.
Of the remaining ~2.8 million barrels per day still being exported, ~1.1 million barrels per day, or 39%, is flowing through Saudi Arabia's Red Sea ports, bypassing the shut Strait of Hormuz.
Jet fuel was hit the hardest, with exports plunging -85%, triggering flight cancellations and fuel shortages across Asia-Pacific.
At the same time, LPG and naphtha exports dropped by -1.0 million barrels per day.
Diesel, gasoline, and fuel oil exports also fell sharply, with declines ranging from -60% to -70%.
The Strait of Hormuz crisis is in full-swing.

English
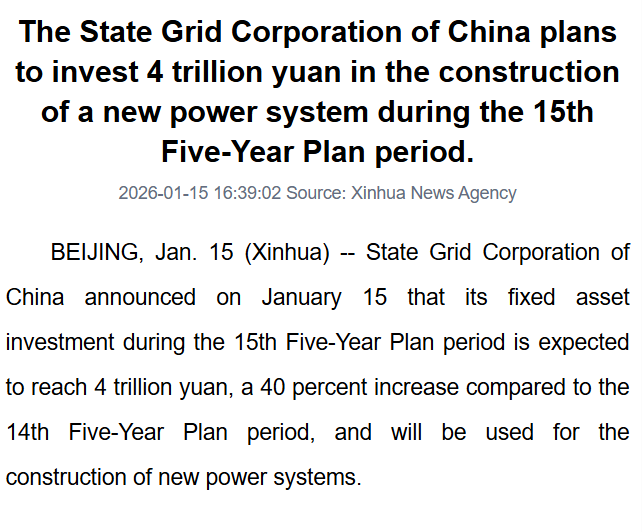
@ekwufinance 4 trillion yuan in grid alone means copper demand won't taper the way cycle models assume. This is a structural floor under industrial metals, not stimulus. The critical minerals stockpiling signals pre-positioning before Western export controls tighten.
English

China revealed their 15th Five-Year Plan
- $560T investment into a new power system (+40%)
- Large-scale wind and solar expansion
- Increased stockpiling of critical minerals
- Rapid battery storage buildout
As the world’s largest commodity consumer, China effectively sets the tone for global demand.
This plan adds another major demand driver into an already tight supply environment, while the US is simultaneously competing for access to the same critical minerals.
The result is increasing pressure on already constrained commodity markets
English
@Cointelegraph The chart shows JGB yields breaking a 30-year downtrend, not just a rate tick. The BOJ now faces a binary trap: defend the bond market with QE, tanking yen and accelerating carry unwind, or let yields run and stress domestic bank balance sheets.
English

🇯🇵 NEW: Japan’s 10Y bond yield just hit its highest level this century
English