Osagi retweetet
Osagi
2.2K posts


@BoringBiz_ That idea cost me 900 days of my life suffering , good luck , that wont work on crypto , and that called gamble
English
Osagi retweetet

📢 An Important Message to Our Community.
Effective immediately, Dogecoin is undergoing a full corporate restructuring.
We are proud to introduce: DogeCoin Financial Solutions LLC™
As part of this transition, we will be:
▪ Retiring the Shiba Inu logo in favour of a tasteful navy blue emblem
▪ Launching a 67-page whitepaper titled 'Toward a Synergistic Decentralized Liquidity Framework'
▪ Rebranding our community from 'the Doge army' to 'Stakeholders'
▪ Discontinuing use of the words 'wow', 'much', and 'very' across all communications
▪ Scheduling the moon for FY26 Q3
Our legal team has advised us not to say 'wow.' as it has been determined to be a forward-looking statement (that should not be taken as financial advice.)
We believe this pivot positions DogeCoin Financial Solutions LLC™ for maximum enterprise scalability and shareholder value optimization going forward.
The dog is still here. She is wearing a tie now. She did not consent to this.
— The DogeCoin Financial Solutions LLC™ Board of Directors
English
Osagi retweetet

Here's a download for RTH VWAP (Sierra Chart study collection) so that you can easily add it to any chart you want with a single click:
drive.google.com/file/d/1JDVnha…
How to use the RTH VWAP study collection:
1. Add it to your "Data" folder that is inside your SierraChart installation folder.
2. Then go to any chart and click on "Analysis" in the title bar and then you will see the collection titled "RTH VWAP+".
3. Click on it to load it to your chart.
Here are the steps for how to set up RTH VWAP from scratch for learning purposes or in case you want to do it yourself:
1. Add the "Volume By Price" study to the chart.
2. Set "Draw Mode" to "POC, VAH, VAL, VWAP Lines Only" (since we only want a VWAP line with no profiles).
3. Set "Volume Graph Period Type" to "Multiple Profiles from Start Time to End Time".
4. Set "Start Time" to 09:30:00
5. Set "End Time" to 16:14:59
6. Go into the "Subgraphs" tab and set any lines such as POC/VAH/VAL to "ignore" so that they are not displayed on the chart.
7. In the Subgraphs tab set VWAP's Draw Style and Line Style to whatever you prefer (Line or Dash are typically best for VWAP).
That's it. Now you are all set! Take care.

Osagi@osagicrypto
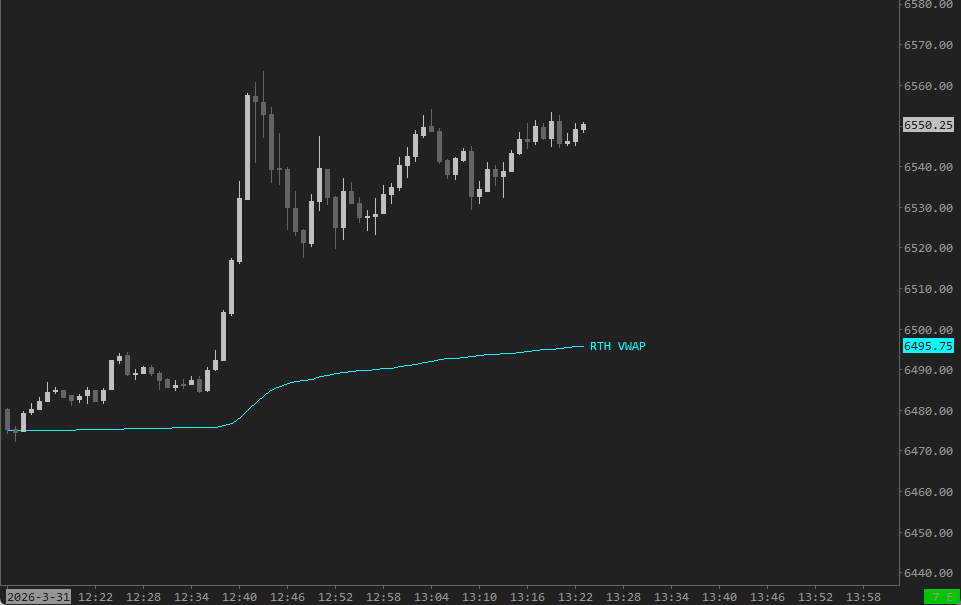
@jestertrading33 How to setup that rth vwap
English

@tradertheory Buying memecoins beliving in the dev or creator or team or market maker
English
Osagi retweetet

$BTC
When comparing the 2022 vs current bear market, the biggest takeaway is that this cycle is unfolding at a faster pace, something I’ve pointed out multiple times. Price action continues to closely mirror the previous cycle, but with increased speed. Currently tracking at roughly 45% faster.
In 2022, it took 217 days to move from the ATH to the wick low, followed by 147 days of ranging above that low before it was finally swept. After that, price entered the bottoming phase, which lasted around 70 days (measured from the sweep of the wick low to the MSS).
In this cycle, price reached the wick low in just 119 days, reinforcing the idea of a faster market structure. If this pattern continues to play out proportionally, it suggests that the bottoming phase wouldn’t begin until after April 20th, meaning the current wick low could likely be protected until then.
Following the same adjusted timeline, the bottoming phase could complete as early as June, aligning with the accelerated nature of this cycle.

English

@JA_Maartun He said its time to get the laser eyes back , do you thinks its bearish ? Are we cooked ?
English
Osagi retweetet

《 Chart: $BTC + Fear & Greed Index < 10 》
Market stuck in prolonged fear.
Are you in that crowd? Could you have prevented it? That's how one grows.
BTC is 47% below ATH+below the 200-day SMA
Of 500 simulated paths over 1 year: 60% end 20%+ lower (by @VynthraQuant).
DYOR


English
Osagi retweetet

$BTC | @Bitcoin
A lot of premature celebrating by Bears.
Everyone posting the same Bear flag.
I’ve been publicly tracking this for a month.
Still following along.
I wouldn’t fade crypto here…

English

@JesseOlson @marketsniperpro Why we should have this massive destruction while the circumstance’s is way better ??? Jane street fractal ?
English

$53K to $59K is the next major Bitcoin support zone.
We are heading there soon.
Below that, $38K to $43K comes into play. Several reasons price could revisit that range similar to 2022.
I'd expect $40K to hold UNLESS we get a 2008 or dot com style crash.
Buy The Right Dip. 🤝

Jesse Olson@JesseOlson
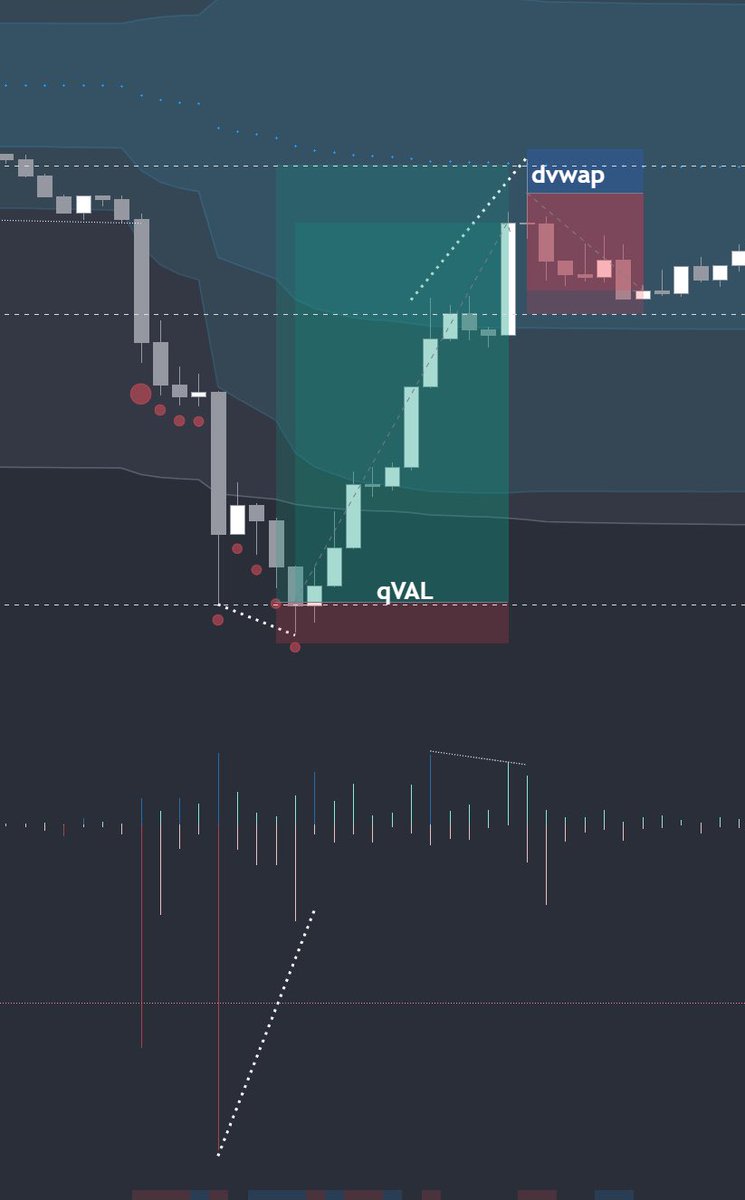
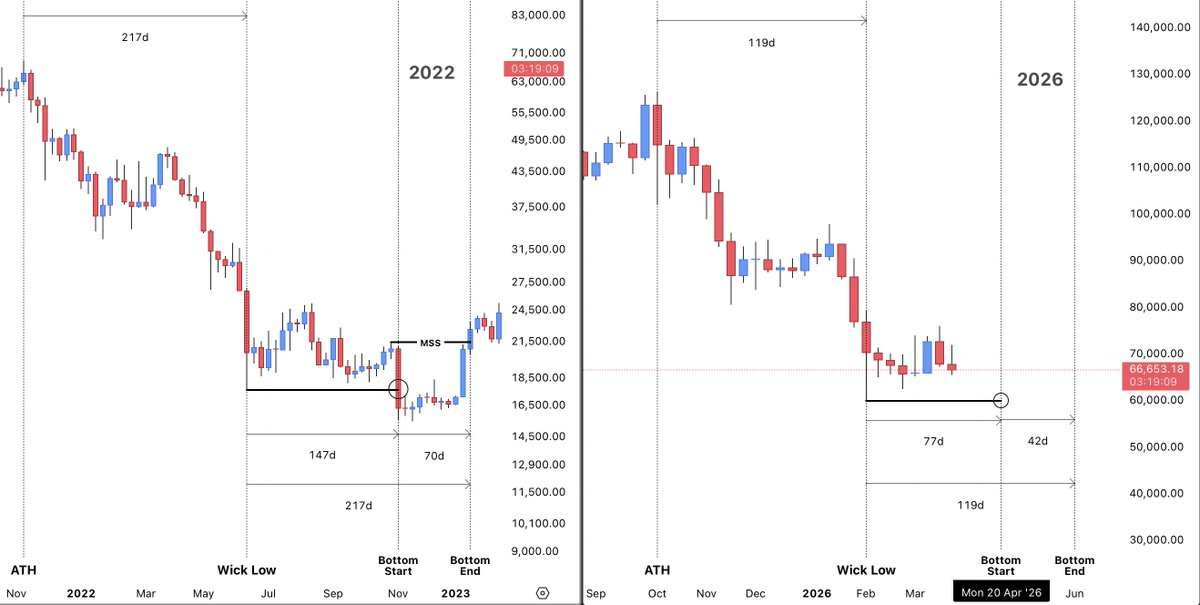
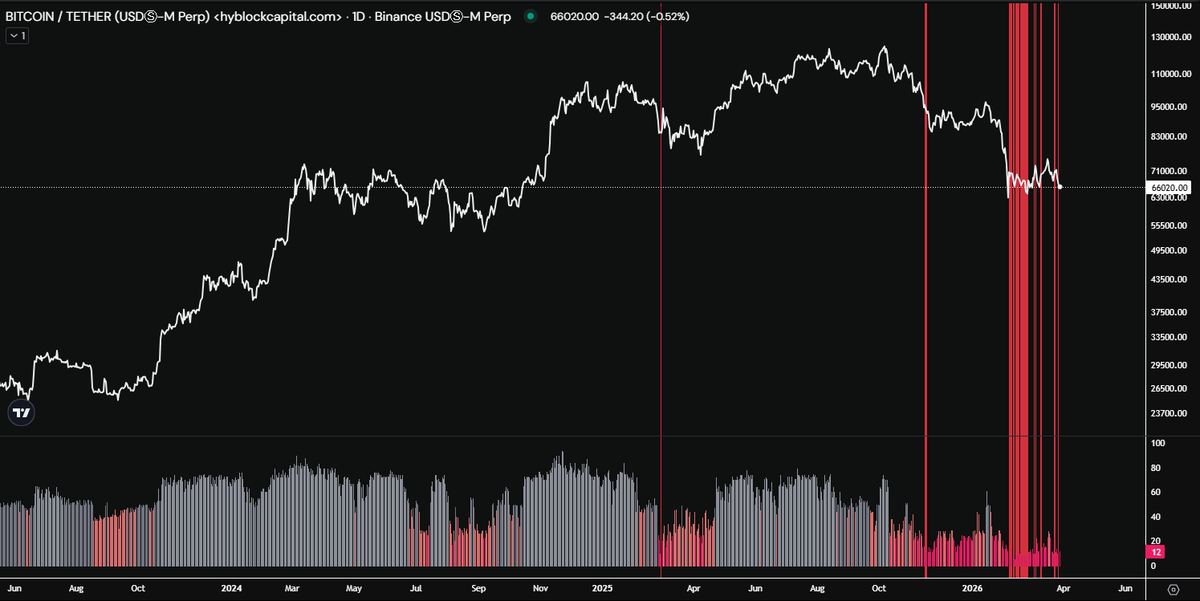
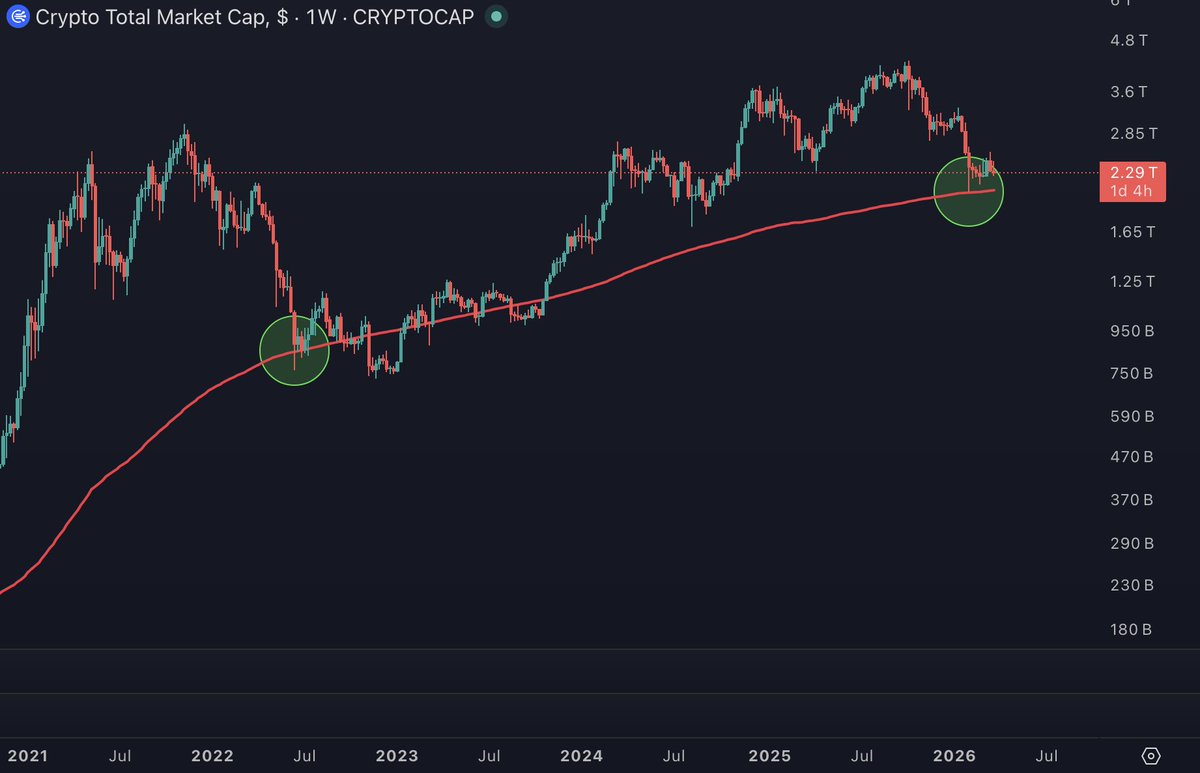
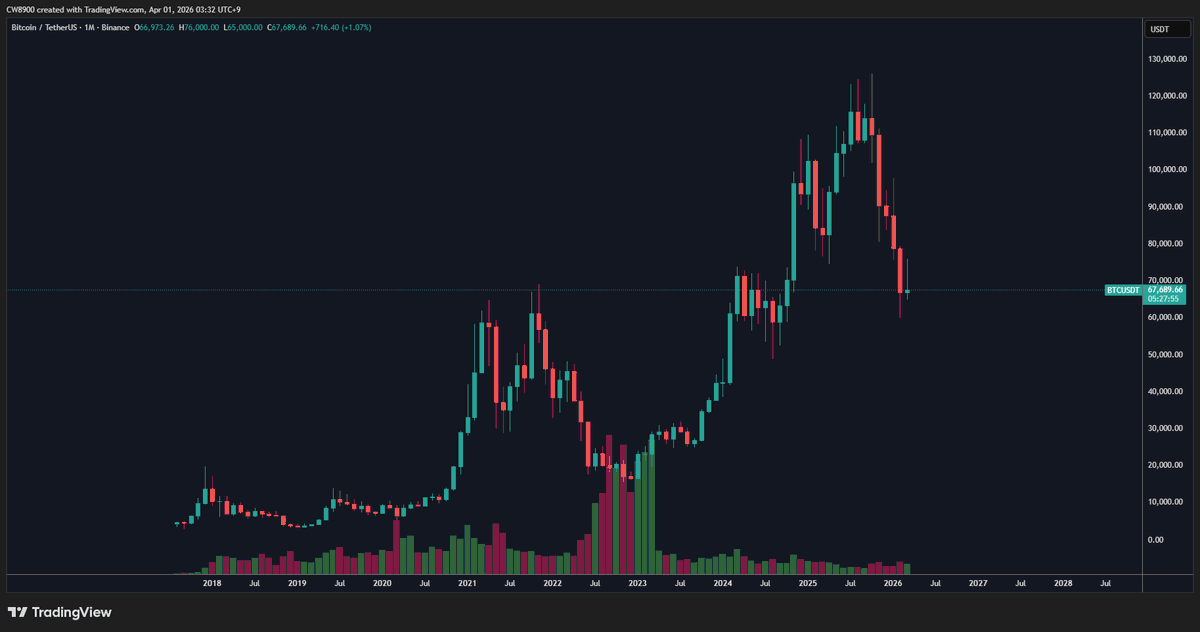
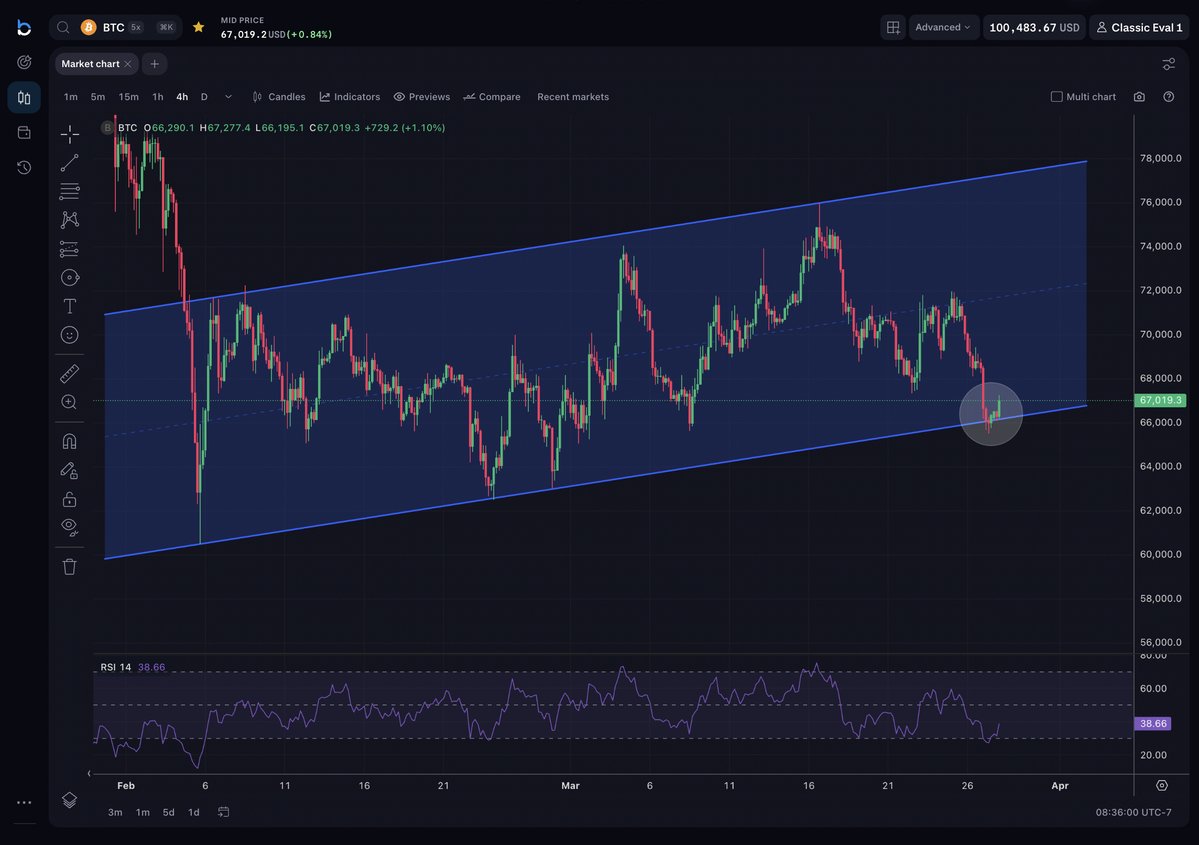
Assuming this is the #Bitcoin peak, and it doesn't mirror the previous cycle, expect different chart patterns. However, some patterns may repeat: - Price gets volatile at creates wicks at the peak - Bearish divergence at the top - Price retests the blue line - Price retests the 5th target box - Bullish divergence at the bottom
English


