cates

17 posts

cates banner
cates

cates

@statsdog

-MS data science 🐮🤘🏻 BS intl business 🐓🤙🏼 -yapping sports analysis and similar

Beigetreten Aralık 2025
48 Folgt3 Follower
cates
cates@statsdog·
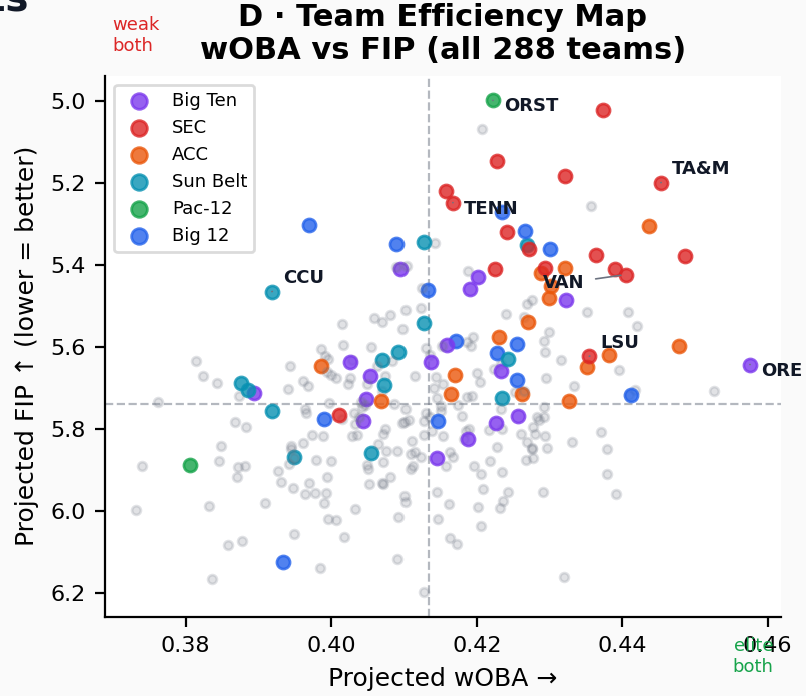
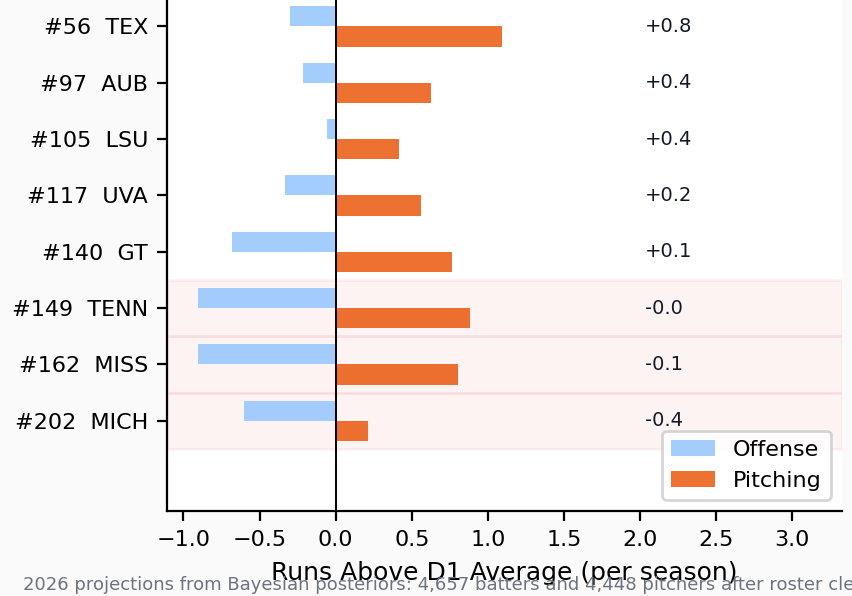
Focusing on a few teams of interest, the model does not like Texas, LSU, or Auburn (#2, #3, #7) in D1 baseball as of this writing. This graphic is a bit of a stray for Tenn but everyone in this group shows the same story with good pitching and below average offense. 
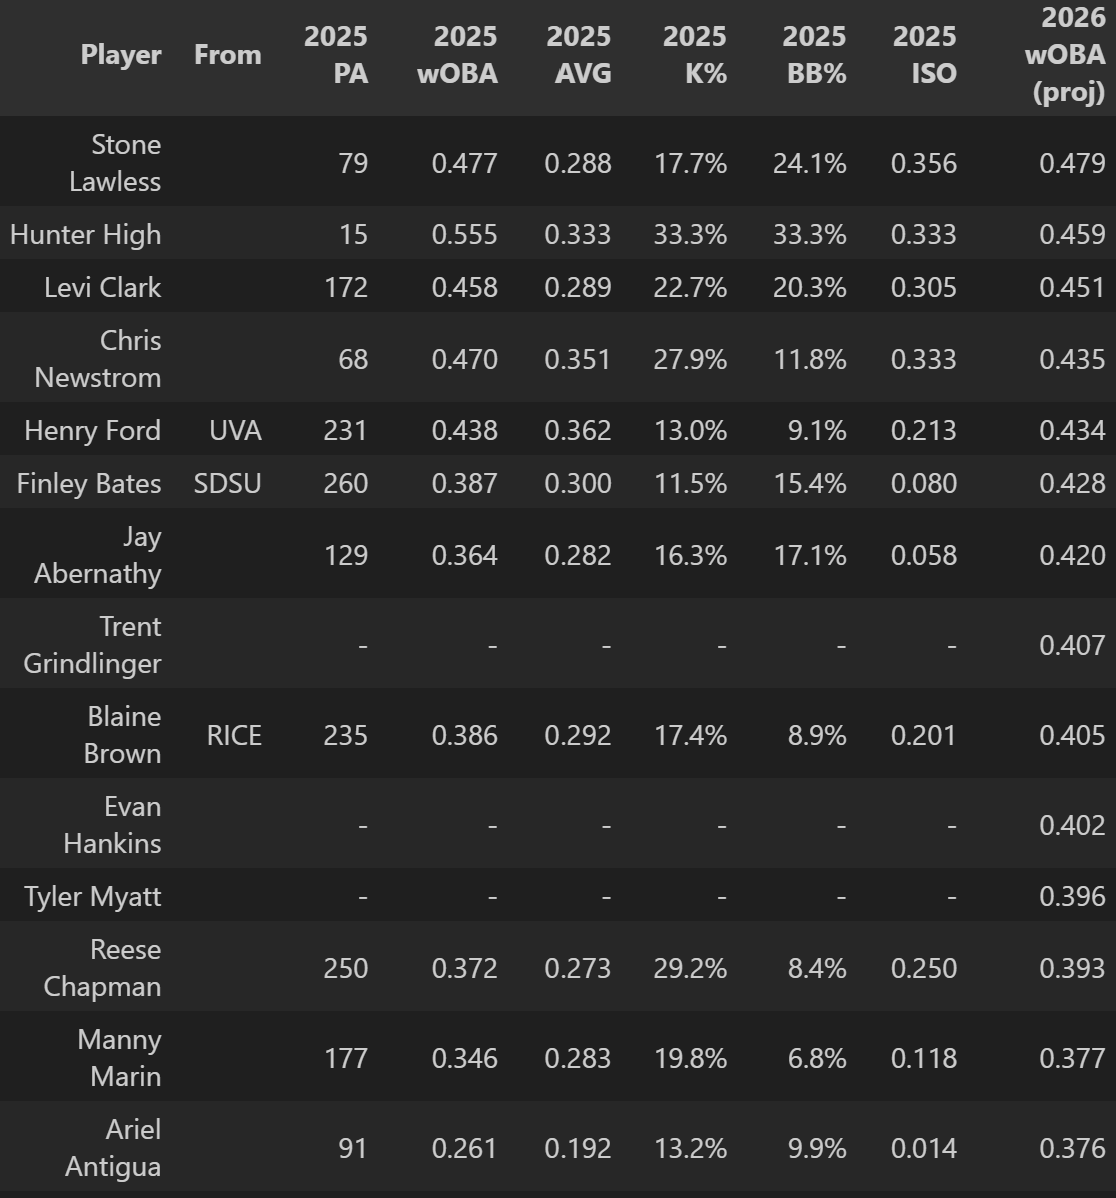
Now using Tenn to show why the projection is so low. Looking at the stats on their roster, it's hard to argue it should be much different. Their returners (blank in From column) are either low PA guys or low production guys. Only 3 additions from the portal is asking a lot from that group. Given the caliber of the program, it would be reasonable to assume some development factor beyond what the pure data shows but I want to capture pure data signal and keep the vibes out. The projection will adjust in a few weeks if the team performs better. 
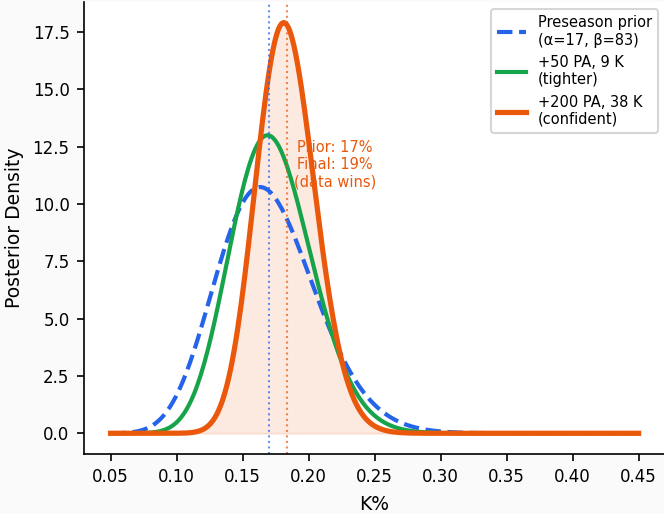
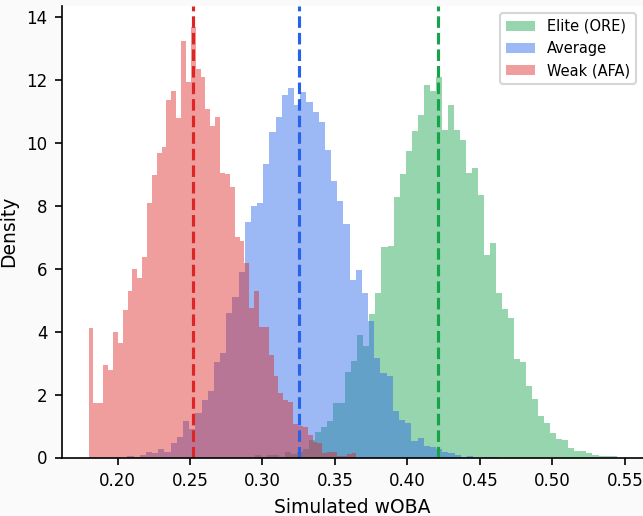
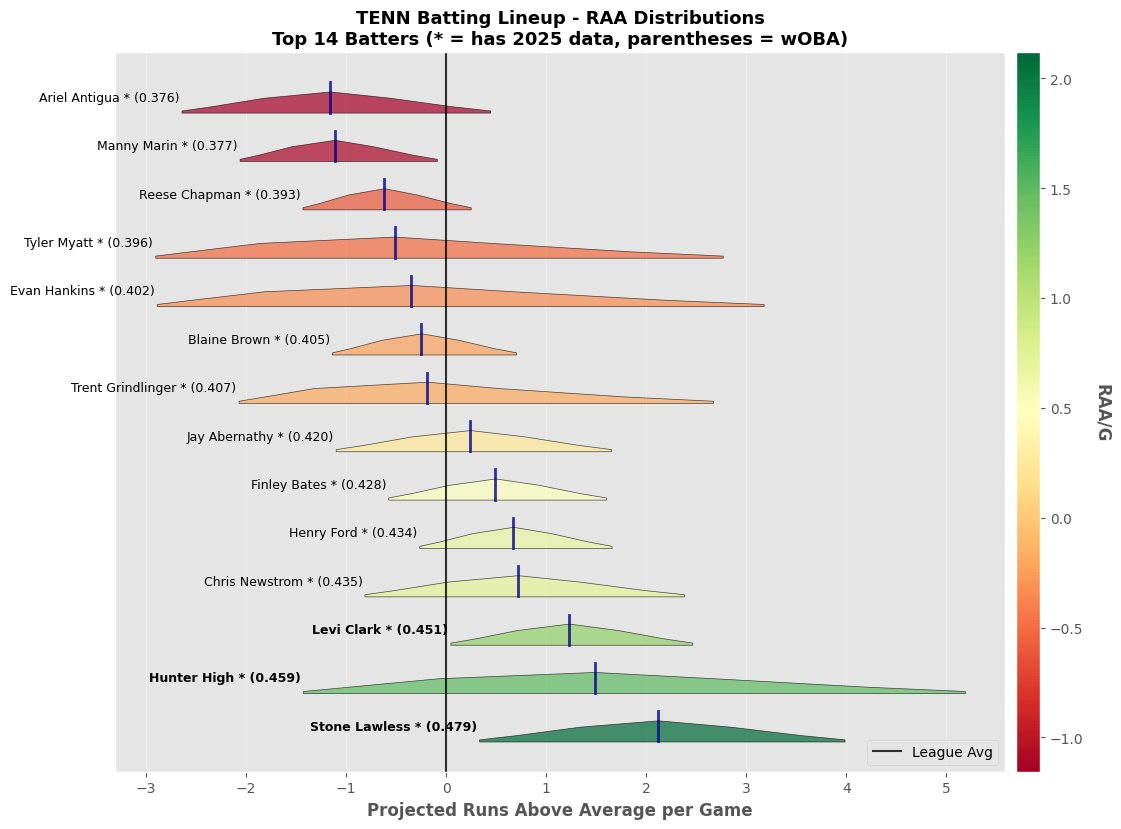
Expanding on the uncertainty component in the model and why the team aggregation is simulation-based, see Hunter High's projection below. His 2025 stats were good (.459 wOBA) but only 15 plate appearances means we can't be very certain of that. Meanwhile, Henry Ford has very strong priors and a relatively narrower distribution for his 2026 runs above average. Overall, the Tenn projection is a function of pitching despite all the batting commentary i've listed. Their 2025 pitching was ELITE and 2026 will probably be much less so.
cates tweet mediacates tweet mediacates tweet mediacates tweet media
English
0
1
0
41
cates
cates@statsdog·
Long time no post since the launch of the stat dog but I been cooking. TLDR I built a college baseball model and the results are interesting. Gonna explain the model and timestamp some "preseason" takes but I will update throughout the spring. Covering the mechanics as briefly as possible: It is conceptually similar the famous MARCEL projection system. Therein, players are projected year to year based on their prior year stats * some regression to the mean (good or bad) * development factor for their age. I used actual prior year stats but specifically focused on "skill" components like K% and BB%. From those pieces, I build up an individual projection for each players' wOBA (batters) or FIP (pitchers). I project at-bat share (batters) and innings-pitched share (pitchers) so I can build team-level projections with sum(wOBA * PA share). I built a player based model very deliberately to try to capture more signal in the transfer portal era. I use real prior stats but add in-season Bayesian increments from observed performance. So the model results start with last year(s) priors and increasingly converge towards current year as data accumulates. Two major disclaimers: 1-freshman are not real people. They will be later in the season (Bayes) but they have no priors and i'm not using recruiting data. So, their priors are imputed as league average 18 yr olds. 2-I only added very basic adjustments for strength of schedule/conference so the team level aggregation is not calibrated to create meaningful cross-conference power ratings like RPI. Long time no post since the launch of the stat dog but I been cooking. TLDR I built a college baseball model and the results are interesting. Gonna explain the model and timestamp some "preseason" takes but I will update throughout the spring. Covering the mechanics as briefly as possible: It is conceptually similar the famous MARCEL projection system. Therein, players are projected year to year based on their prior year stats * some regression to the mean (good or bad) * development factor for their age. I used actual prior year stats but specifically focused on "skill" components like K% and BB%. From those pieces, I build up an individual projection for each players' wOBA (batters) or FIP (pitchers). I project at-bat share (batters) and innings-pitched share (pitchers) so I can build team-level projections with sum(wOBA * PA share). I built a player based model very deliberately to try to capture more signal in the transfer portal era. I use real prior stats but add in-season Bayesian increments from observed performance. So the model results start with last year(s) priors and increasingly converge towards current year as data accumulates. Two major disclaimers: 1-freshman are not real people. They will be later in the season (Bayes) but they have no priors and i'm not using recruiting data. So, their priors are imputed as league average 18 yr olds. 2-I only added very basic adjustments for strength of schedule/conference so the team level aggregation is not calibrated to create meaningful cross-conference power ratings like RPI. Example distribution for K% (narrower with more samples, moving towards in-season results) To generate an actual projection from these distributions, I ran Monte Carlo simulations with 10,000 samples per team. Since each player's projected wOBA/FIP is uncertain, the end result captures expected performance per team but also how certain we should be about that result. Illustrative: So, results. In college baseball, the P4 has been overthrown by.... the Big East!!!! S/o Creighton and Seton Hall. Breaking the conference results down further by team, it is clear that the sports runs through... the pacific northwest.
cates tweet mediacates tweet mediacates tweet mediacates tweet media
English
1
1
0
23
cates
cates@statsdog·
Among the funniest things i've ever created, behold the last decade of actual wins vs vegas win totals, by COACH (min 3 seasons). So many bangers in here but a few highlights: -Cignetti 🤯 -Demon corner in the top right with Saban/Smart/Meyer/Day, outpacing even insane expectations -Scott Frost 🥶 yikes -Norvell in the top left bermuda triangle (one of these is not like the others) -Sumrall deserved a bag 🐊 -Dilfer lol -Dillingham/Tony Elliot/Lea outperforming -Shane Beamer is bottom right FWIW [+0.8] totals from @SOHistory actuals from @cfbfastr
cates tweet media
English
0
1
0
25
cates
cates@statsdog·
the samples are getting smaller left so there's more noise on the right and it's possible this is just random chance BUT it's definitely suggestive. The absolute value is interesting too, we (fans) act like each recruit is life or death but it's hardly that sensitive.
English
0
0
0
10
cates
cates@statsdog·
Quick analysis on how the relationship b/w recruiting rankings and performance has changed Predicted wins as a function of the prev year class with diff cutoffs starting w/ '10-'25 and ending w/ '25 1-only 10-15% of var in wins explained by hs recruits 2-it's actually going UP
cates tweet media
English
1
1
0
33
cates
cates@statsdog·
I will be ending the post-mortem here on NSD but I will be back with more stuff on basically anything football, baseball, weather, idk that I can find the data/time to analyze. Follow the dog!
English
1
0
1
31
cates
cates@statsdog·
After another calamitous season i've decided to launch this little analytics side project with a post-mortem for South Carolina football.
English
1
1
1
87