BTC Tides

2.5K posts

BTC Tides banner
BTC Tides

BTC Tides

@BTCTides

Macro Data Monitor | Tide is FALLING (hence the Red ₿)

London Se unió Ocak 2026
99 Siguiendo221 Seguidores
Tweet fijado
BTC Tides
BTC Tides@BTCTides·
Here’s the real reason behind this equity rally that no one has been able to tell you: Positioning unwind (see thread below) + markets front-running the initial nominal revenue boost from the coming energy-driven inflation shock (Yes, inflation is coming). Prices rise first → short-term earnings look great. This is what markets are front running now. But once inflation hits costs and triggers demand destruction, equities WILL reprice lower. HARD. 
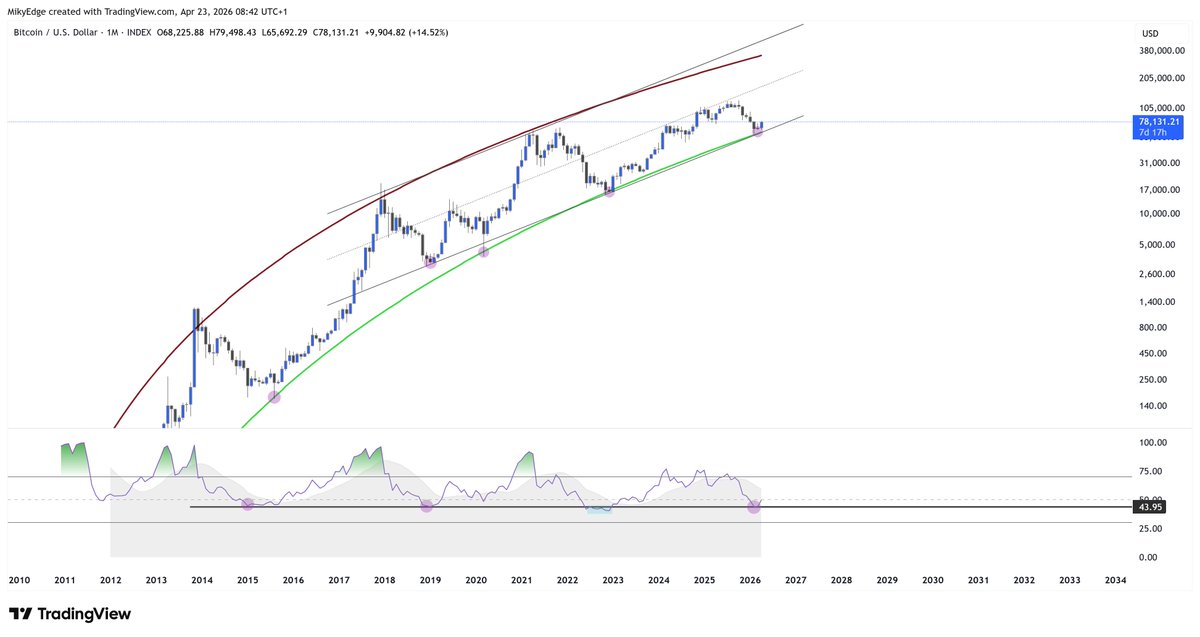
This is exactly why BTC WON’T see a new ATH rally anytime soon. Anyone that tells you it will, is going to cost you money. BTC has no corporate revenue, currently no options positioning tailwind to unwind, and no ability to pass on inflation. BTC price is driven PURELY by macro TIDES. I will tell you as soon as the Tide shifts from Falling to Rising = THE time to go ALL IN BTC/Crypto.
BTC Tides@BTCTides

💡When the Tail Wags the Dog & Why This Market Is Fragile: I called this rally early (see older posts) using positioing data. I even called ATH for ES (but this rally exceeded even my expectation). Here's how, and why you might want to be cautious (🧵).

English
0
0
0
98
BTC Tides
BTC Tides@BTCTides·
ETH short is starting to look appealing. Patience.
English
0
0
0
2
CryptoJack
CryptoJack@cryptojack·
HEAD AND SHOULDERS FORMING ON $ETH !!
English
5
4
8
1.3K
BTC Tides
BTC Tides@BTCTides·
@rickjeff78 I would say more like October 2019, based on real rates.
English
0
0
0
6
BTC Tides
BTC Tides@BTCTides·
@CryptoJelleNL Could be, but based on macro backdrop, VERY unlikely bottom is in.
English
0
0
2
71
Jelle
Jelle@CryptoJelleNL·
Every bear market so far has bottomed well below the 200-week MA. This time different? Time will tell. bitcoin:native
Jelle tweet media
English
9
2
38
1.5K
BTC Tides
BTC Tides@BTCTides·
@MikybullCrypto Except macro flows don't support it, AT ALL. Macro Tide has been FALLING since Aug 2025. Coincident with BTC top? I don't think so.
English
0
0
0
47
Mikybull 🐂Crypto
Mikybull 🐂Crypto@MikybullCrypto·
Quick review: Key indicators, including the Relative Strength Index (RSI) and on-chain signals, indicate a potential micro-bottom on Bitcoin However, a weekly close is essential for confirmation. Professional traders base their decisions on chart data rather than emotion. It is imperative to have this in mind.
English
3
0
18
946
ᴛʀᴀᴄᴇʀ
ᴛʀᴀᴄᴇʀ@DeFiTracer·
🚨 BREAKING: 🇺🇸 WARREN BUFFETT JUST SAID LIVE ON CNBC: "THE LATEST MARKET DROP WAS NOTHING. A LARGER DECLINE IS STILL AHEAD." HE KNOWS SOMETHIND BAD IS COMING SOON...
English
23
13
74
5.4K
ᴛʀᴀᴄᴇʀ
ᴛʀᴀᴄᴇʀ@DeFiTracer·
🚨 BREAKING: 🇺🇸🇮🇷 IRANIAN MILITARY SPOKESMAN JUST SAID LIVE: "WE HAVE MOVED 34 IRAN-LINKED CRUDE OIL TANKERS PAST THE U.S. SO-CALLED STRICT BLOCKADE." SOURCES REPORT THAT THEY ARE CONTINUING TO SELL OIL IN YUAN SOMETHING BAD IS HAPPENING...
English
14
14
90
10.1K
neppy
neppy@neppy·
something good is gonna happen to you today.
English
13
5
25
202
BTC Tides
BTC Tides@BTCTides·
@marc02200 Let's test the waters. Anyone unhappy with BTC and wanting to see the manager, like this so we can count how many 😁
English
0
0
0
7
Marc ₿
Marc ₿@marc02200·
I’m Dutch, so I complain a lot. But I complain way less about Bitcoin than about my energy bill.
English
3
0
3
96
BTC Tides
BTC Tides@BTCTides·
@guru2602 Aug, 8, 25 was, when Tide shifted bearish 🕵️‍♀️
English
0
0
0
33
Guru
Guru@guru2602·
So 10th October was top signal to take #BTC down to 30k. Hmmmmmm
English
4
0
11
1.1K
BTC Tides
BTC Tides@BTCTides·
@MikybullCrypto This is not a meric, it's just a curve fit. You can generate the same 'metric' with so many different powelaws and they will all tell you diffent things.
English
0
0
0
13
Mikybull 🐂Crypto
Mikybull 🐂Crypto@MikybullCrypto·
Looking at this metric, Bitcoin has probably bottomed The same scenarios occurred in the previous bear trend
Mikybull 🐂Crypto tweet media
English
7
8
56
1.6K
Jelle
Jelle@CryptoJelleNL·
$BTC - almost completely through the major resistance zone. Can it make it all the way through?
Jelle tweet media
English
25
4
118
4K
Ardi
Ardi@ArdiNSC·
Position still remains macro bearish.
English
6
2
36
811
Ardi
Ardi@ArdiNSC·
$BTC This is the path for BTC as this move develops. Right now, we are seeing price test support at the breakout pivot, which has flipped into liquidity support for continuation up. What we’ve seen throughout this range is repeated testing of deeper liquidity before each rally. Every meaningful move in this has come from a trendline test paired with an established liquidity zone. If price can hold this recent breakout pivot, it would mean the momentum behind the uptrend is strong and we likely see continuation up over the next few days. However, based on how price has behaved around these intersecting liquidity points in this range, the more likely retest is still the $75.5K-76K liquidity pivot before another attempt higher. Both outcomes are healthy and normal for this type of local move. What I’m watching is whether price needs to move even lower first to find the liquidity required for another breakout attempt. That would be the bearish scenario, and would signal there is still heavy distribution in this pocket which needs to be met with deeper force of liquidity to maintain the trend. It would also mean losing the trendline which has kept this uptrend intact since 65K. Price will follow one of these paths. Enjoy the show. 🤝
Ardi tweet media
Ardi@ArdiNSC

And there’s the sweep of $78K by $BTC. Told you this was coming. Not a fluke. 🤟

English
77
32
147
8.8K
BTC Tides
BTC Tides@BTCTides·
@seth_fin Did we just swap Too Late Powell with Too Early Warsh? They jus can't get it right can they lol
English
0
0
0
26
Seth
Seth@seth_fin·
Kevin Warsh, the new Fed Chair, talks about how deflationary AI is. Making everything cost less and why we should cut rates. The change from the old Fed with old models is much needed. “AI is going to make almost everything cost less. We’re at the front end of a productivity boom. Economic growth won’t be inflationary we’re in the early innings of a structural decline in prices.” Time for some lower rates and QE or what do you say Western man?
English
10
8
35
2K
Jelle
Jelle@CryptoJelleNL·
Still not sure that the bear market bottom is in - but even if it is, I'm not worried. $BTC gives plenty of solid entries in a bull run. Your life is not ruined if you don't buy the pico-lows, no matter how much CT wants you to believe that. Catch the meat of the move, and you win. Patience remains my game.
Jelle tweet media
English
22
5
131
4.6K
Crypto Seb
Crypto Seb@crypto_with_seb·
$BTC ripping while ALTs are watching. Soon, the other way around.
English
17
6
155
6.1K
Midas
Midas@midascabal·
This rally is actually hilariously manipulated. I’ve never seen the market this bad. The CRASH is going to be crazy.
English
31
15
296
11.6K
SightBringer
SightBringer@_The_Prophet__·
⚡️The global financial system is running a controlled demolition of fiat currency purchasing power and almost everyone in it knows but nobody is allowed to say it out loud. The numbers in this chart are not a warning sign that something is about to go wrong. They are evidence that something has already gone wrong and the response is to keep the appearance of normalcy by issuing more debt every year regardless of conditions. The 2026 numbers are not a forecast of an upcoming crisis. They are the operating procedure of a system that is already in crisis but has chosen to manage it through gradual erosion rather than acute correction. Every central banker knows this. Every treasury official knows this. Every senior financial executive knows this. They cannot say it because saying it would accelerate the thing they are trying to prevent. The system depends on confidence in the currency. If the people running the system publicly acknowledge that the currency is being systematically debased to manage debt obligations that cannot be paid in real terms, confidence collapses faster. So they manage the debasement quietly while publicly maintaining that everything is fine. This is the actual social contract of late stage fiat. The people running the system know what they are doing. They know it produces a wealth transfer from savers to asset holders, from wage earners to capital owners, from the middle class to the wealthy. They do it anyway because the alternative is worse. The alternative is acute crisis, banking collapses, sovereign defaults, and political upheaval that could end the system entirely. Slow debasement is the lesser evil from their perspective. They choose it knowingly and they refuse to discuss it publicly because public discussion would prevent it from working. The middle class is being quietly liquidated to keep the system functioning. That is not a controversial statement among people who actually understand monetary policy. It is the operating reality. The wealth that the post war American middle class accumulated through wages and home ownership is being slowly transferred to asset holders through inflation and debt expansion. The mechanism is invisible to most people because it operates through the gradual reduction in purchasing power rather than through any visible confiscation. But the effect is the same. The middle class gets poorer in real terms every year while the wealthy get richer in real terms every year. This chart is one more piece of evidence of the mechanism running. The wealthy understand this and position accordingly. They hold scarce and productive assets. They borrow at low rates to buy more of those assets. The debt they hold gets inflated away while the assets they hold appreciate in real terms. The math is simple and it produces the wealth concentration that everyone notices but few people understand the mechanism behind. The mechanism is the monetary system. It is designed to transfer wealth from those who hold currency to those who hold assets. That is the function. Not a bug.
The Kobeissi Letter@KobeissiLetter

The global debt crisis is set to get even worse: Total sovereign and corporate bond issuance is estimated to rise to a record $28.8 trillion in 2026. That would mark the 4th consecutive annual increase and would also DOUBLE the average pre-pandemic levels. Corporate debt issuance is set to surge to a record $6.9 trillion, while government debt issuance is expected to rise to $21.9 trillion, also an all-time high. By comparison, governments and corporates issued $23.7 trillion of debt in 2020, during the pandemic. As a percentage of GDP, global issuance is expected to increase to 23.3%, the 2nd-highest on record, only behind the 27.5% peak during the pandemic in 2020. To put this into perspective, the 2008 Financial Crisis peak was 21.4%. The world is borrowing ABOVE crisis levels.

English
37
201
793
126.1K