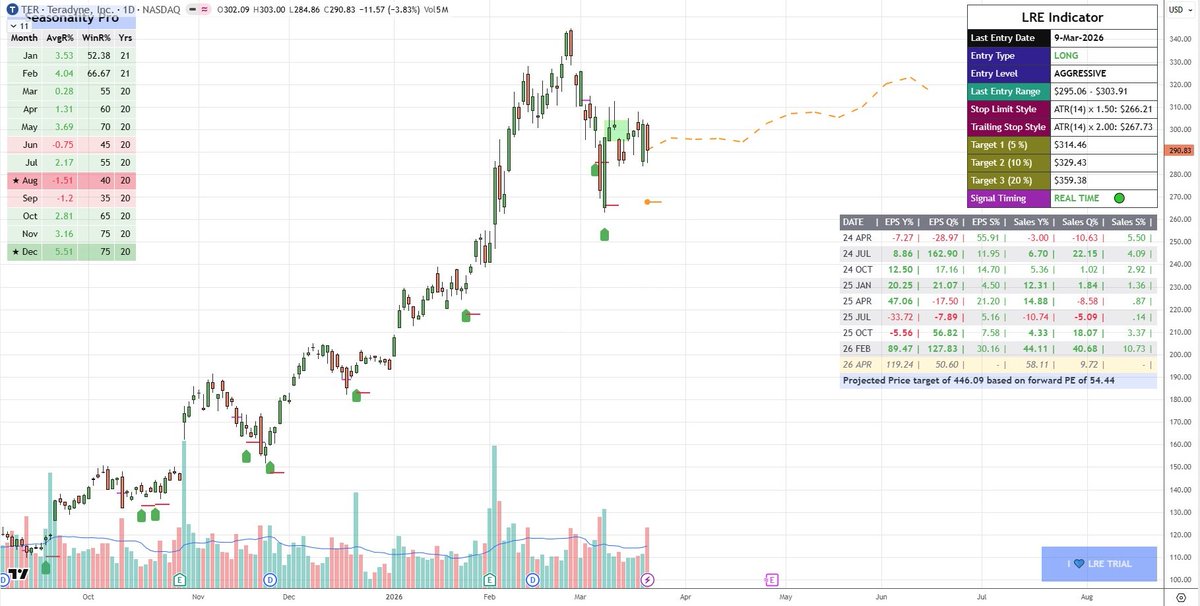
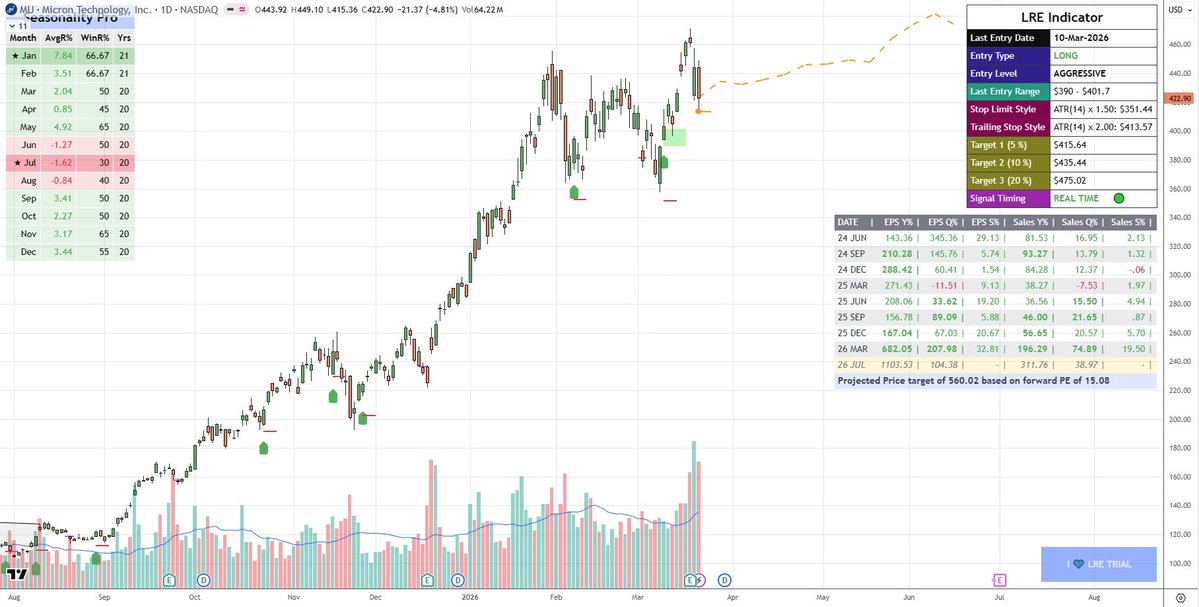
Trading Insights

783 posts

Trading Insights banner
Trading Insights

Trading Insights

@ChartStudy_US

Min # of trades, Max % of gains Right stock selection, Better trading performance

Se unió Mart 2010
129 Siguiendo380 Seguidores
Trading Insights
Trading Insights@ChartStudy_US·
@MrMikeInvesting "Sell stocks when $VIX hits $14." --- A blanket statement like this and you would miss entire rally in 2016-2017, again in 2024.... 2006/2007, 2013
English
2
0
1
52
Mike Investing
Mike Investing@MrMikeInvesting·
This simple rule will almost guarantee that your portfolio outperforms the S&P 500 year after year… Buy stocks when $VIX is $30. Buy even more stocks when $VIX is above $45+ Sell stocks when $VIX hits $14. Straightforward plan which has proven to be successful…
Mike Investing tweet media
English
96
286
2K
157.2K
Trading Insights
Trading Insights@ChartStudy_US·
@ZTheTrader By any chance, have you also done a similar historical study for prior periods!!!!
English
0
0
1
96
⚡️The Traveling Trader⚡️
Since Liberation Day, every red $SPY candle that produced at least 110M in volume saw a local bottom and multi-day bounce. We put in 123M today.
⚡️The Traveling Trader⚡️ tweet media
English
74
91
1K
125.2K
Trading Insights
Trading Insights@ChartStudy_US·
@MarketMike Thanks but many folks have done this manually as well so we do not need AI for this! However, the real value of any such study will be at what point in the market decline we have higher probability of severe downside & how can we take adv of that!
English
0
0
0
86
Mike
Mike@MarketMike·
15 bear markets in ~100 years. What they all have in common: • Everyone thinks "this time is different" • The top always looks obvious in hindsight • Bear markets tied to recessions are deeper (-34% median) • The market has recovered every single time History doesn't repeat, but it rhymes. Save this thread. You'll need it.
English
17
11
178
12.1K
Mike
Mike@MarketMike·
I used AI to chart every single bear market top in $SPX history going back 100 years so I could study how tops form before -20%+ crashes. It came out so cool I had to share it with all of you. 15 bear markets. Every topping process. One thread 🧵
Mike tweet media
English
62
143
838
121.5K
Elite Swing Traders
Elite Swing Traders@1ChartMaster·
@cicadatrades $SPY inverted with the candle colors flipped. Looks like a rounding bottom breakout. 👀
Elite Swing Traders tweet media
English
7
6
106
11.8K
Elite Swing Traders
Elite Swing Traders@1ChartMaster·
This is the Inverted QQQ chart. Tell me what you see?
Elite Swing Traders tweet media
English
105
24
373
102K
jasminedang72
jasminedang72@jasminedan59568·
@ZeeContrarian1 For retail investors who can’t sell naked calls, any other idea suggestions? Thank you Z for all you do!
English
5
0
2
2.9K
Z
Z@ZeeContrarian1·
I went over yesterday with a fund on what kind of $UVXY trades to put on today and how to structure them. $590,000 profit two hours later.
Z tweet media
English
34
12
357
93.5K
Trading Insights
Trading Insights@ChartStudy_US·
@ZeeContrarian1 Correct, in theory eventually we shall make money. But you mentioned not to use leverage. $UVXY instrument itself is leveraged & using options is further leverage. Since we are selling naked calls which is essentially unlimited risk which we should be comfortable with!
English
0
0
0
94
Z
Z@ZeeContrarian1·
Think about it this way. Let’s say you don’t use leverage, which, for some reason, everybody on X implies that’s what I tell people to do. Let’s say you sell the $UVXY 70 call, and with that money you buy the $UVXY 42 put. That basically means that if you’re wrong and you’re not leveraged you’re effectively shorting the $VIX curve at 30, which probably means you’re shorting the $VIX at around 50. Even if you get assigned and it reaches that level, you’re guaranteed to make money eventually. You will be losing money at that moment, but you’re basically short the $VIX at 50, which means that position that’s losing money will eventually turn profitable 100%. The only thing I say is: do not use leverage.
English
1
0
1
652
Z
Z@ZeeContrarian1·
𝗠𝗢𝗡𝗨𝗠𝗘𝗡𝗧𝗔𝗟 𝗦𝗛𝗢𝗥𝗧 $VIX 𝗢𝗣𝗣𝗢𝗥𝗧𝗨𝗡𝗜𝗧𝗬 𝗨𝗣𝗢𝗡 𝗨𝗦 We are about to get an opportunity to enter what I believe will be the best trade of the next 12 months. The $VIX is spiking toward 30. Before doing anything, it is important to understand why. The spike is driven by the current situation around Iran and the Strait of Hormuz, with crude oil approaching $100 per barrel. Whenever volatility spikes like this you must ask a simple question: Is this a systemic crisis or temporary panic? During the Global Financial Crisis and COVID, $VIX was effectively uncapped. Why? Because nobody knew what would happen next. The system itself looked like it might break. In those environments $VIX can go anywhere. But the current situation is completely different. If you believe, like I do, that the spike in oil and $VIX is driven by temporary panic over a solvable geopolitical situation, then the conclusion becomes obvious. All the largest powers on Earth have a massive interest in keeping the Strait of Hormuz open. This situation will be resolved. Could it take a week? A month? Sure. But that does not change where volatility will be a year from now. And that is the timeframe that matters. I am very close to guaranteeing that over the next year, shorting $VIX will generate at least a 30% return. The best way to express this trade is through $UVXY / $VXX option risk reversals. I will explain the exact structure later. For context On May 8, 2024, when $UVXY was trading at $55, I guaranteed that volatility would collapse. Since then $UVXY has undergone a 1 for 5 reverse split. Adjusted for the split $55 is equivalent to about $11 today, even after the recent 60% spike in $VIX. That represents roughly an 80% collapse. This is exactly how long-term short volatility trades work due to contango and mean reversion. Do yourself a favor and use the weekend, if you don’t know what those are, to learn how they work and why $VXX and $UVXY are guaranteed to go to zero unless the world ends. Now we may be getting another entry point. I do not guarantee what happens next week. I do not guarantee what happens next month. But I can say with extremely high confidence: six months to one year from now $UVXY and $VXX will be much much lower than today. And if you position correctly this trade has a very real chance of becoming the best trade in your portfolio over the next 12 months. I currently have a small position, next week I plan to enter a larger position using $UVXY / $VXX put(buy) and call(sell) option risk reversals. Opportunities like this do not appear often, I plan to pull the trigger next week.
Z@ZeeContrarian1

- Two years from now, the $UVXY will be below 10 (currently 55). - While I can't guarantee it, I do. - If you short volatility at $VIX 30, it's only a matter of time until you start printing money. - Put a SMALL part of your portfolio here in short $UVXY and leave it alone.

English
85
60
729
136.2K
Trading Insights
Trading Insights@ChartStudy_US·
@ZeeContrarian1 absolutely 💯%.... even 6 months out to be on safe side... considering a scenario like 2020 when volatility remained high for lot longer than normal....
English
0
1
5
428
Z
Z@ZeeContrarian1·
@ChartStudy_US Sure, but if you are doing that go at least 3 months out.
English
1
1
11
2K
Han Akamatsu 赤松
Han Akamatsu 赤松@Han_Akamatsu·
Whatever you do, do not trade without volume on. Only then you can understand at what phase a stock is currently at.
Han Akamatsu 赤松 tweet media
English
10
68
566
50.8K
Vishal Mann
Vishal Mann@Indian_Psycho_·
@Han_Akamatsu i have the volume indicator but the height of the bar does not really help me in understanding if the volume is high. Should i be using some other indicator? Any specific time frame volume is more useful at for swing trading?
English
7
0
1
1.1K
Mike
Mike@MarketMike·
The same things I was watching in 2021 that led me to say I wouldn’t be surprised if we saw a big news event in the coming months are lining up again. I wouldn’t be surprised if we’re right around the corner from another “big news” event.
Mike tweet media
English
10
5
109
11.8K
Trading Insights
Trading Insights@ChartStudy_US·
@SoJustFollowMe $TGT & $NKE: Both are trying to establish base as in support, some accumulation is visible in volume print. However, don't you think it might stay range bound for another Qtr before making any meaningful move upwards!!!!
English
1
0
3
354