

Mike
17.3K posts

Mike
@MarketMike
I find the signals Wall Street hopes you miss. Trader. Risk manager. USIC Verified. Coco's human. #1 Dad. YouTube: Figuring Out Money
Katılım Mayıs 2009
565 Takip Edilen47.3K Takipçiler

@MarketMike The daily expected move keeps shifting throughout the day for me and is not static. Are you getting these levels from yesterday's close?
English
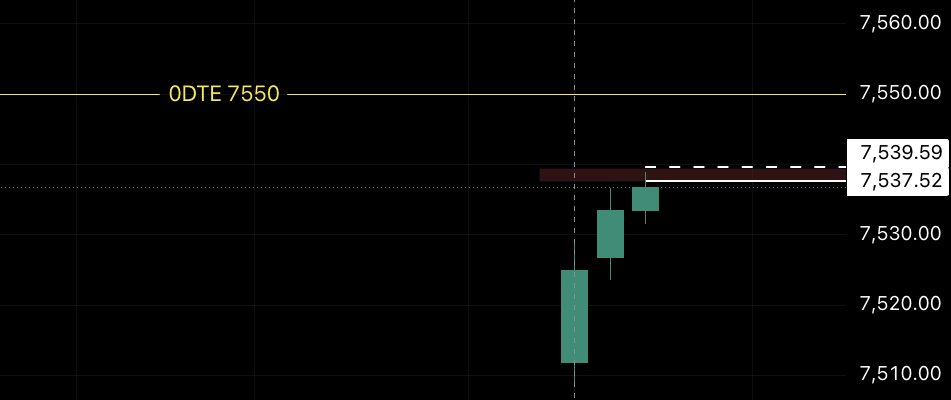
Nice little breather after tagging the upper daily expected move. You are operating at a disadvantage if you do not know market expectations. $SPY

Mike@MarketMike
$SPY just came into tag its upper daily expected move.
English


@elteslaengineer @MarketMike Saying its flat after earnings came out already when price is flat is not a call. Thats just stating exactly whats currently going on. Hahahahhah this guy is not real
English

you said "not really", but infact the expected move is exactly what I said. the market could move 25 bucks and that wouldn't change the fact that the expected move is what I said. lol
I provided actual data that you cannot argue with. it doesnt matter that price is flat or higher. if the price of NVDA moves 13 bucks by friday thats still within the expected move because there is 2 days till that expiration
My goodness man. you are something else LOL
English

@MarketMike I called flat. NVDA went flat. You’re now mad that I explained why the EM doesn’t contradict that. Backtracking from what, exactly?
English
@elteslaengineer WTF are you talking about, lol. So, now you know what an expected move is and oyu are backtracking LOL
English
@MarketMike An expected move is a ±1σ band, not a forecast. NVDA AH is sitting between your own white lines, that IS the EM being respected. You posted the proof and called it a counterargument. Impressive work.
English


@elteslaengineer you just made no sense again. if you are going to talk shit, then you need to atleast know what the fuck you are talking about
English
@elteslaengineer 1. There was no call yet.
2. there is a cash session tomorrow.
3. was the current move within markets expectations or out?
Dumbass
English
@elteslaengineer Yes really. You need to learn what an expected move is and what the expiration is on this EM haha
English

One chart that explains why the average consumer stock can't catch a bid.
Black = 10-year yield.
Red = equal-weight Consumer Discretionary, inverted.
The correlation has been pinned near -1.0 for two months straight.
Cap-weight $XLY hides this, $AMZN and $TSLA mask the damage. Equal-weight tells a different story: the average consumer name has been hating this run up in rates.

English
@TradingLogica There is always an unknown. Thats why we look at this in terms of probabilities. Doesn’t matter if its this product or another
English

+/-$13.55 implied move on a $5.4T market cap. That's $378B swinging on one earnings call.
The iVOL levels are clean. But there's a variable the options market can't fully price: whatever Jensen says about China. With the RTX 5090D V2 banned this week, the forward revenue guidance is the real unknown - and that's not in the implied move calculation.
The number tonight is priced. The narrative isn't.
English



@MarketMike IMO that's about to change. 10Y won't going meaningfully higher, Housing looks constructive, Capital rotation plausible. $LULU $MCD
English
@CalebFranzen @Cjtweets333 Glad to see you’re still thinking about me cupcake.
English
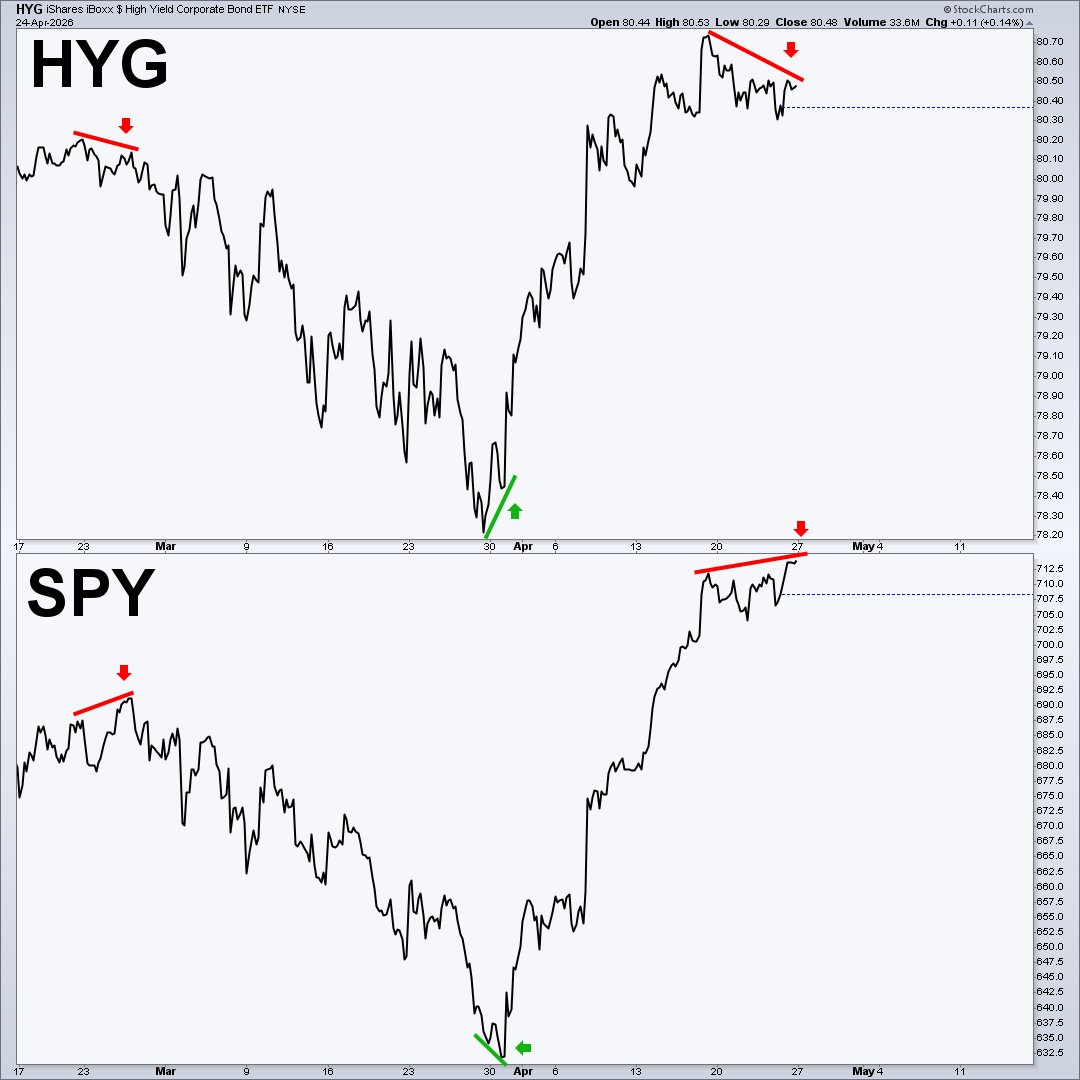
Almost nobody looks at this chart… but it’s one of my favorite ways to spot when a move may be running on fumes.
This is a simple 60‑minute line chart of high yield vs SPY. I use it to track divergences between “smart money” (bonds) and “dumb money” (equities).
The last major signal was at the bottom, high yield quietly started putting in a higher low while stocks were still puking. That helped flag the turn.
Fast‑forward to now: $JNK and $HYG are not confirming this latest push in SPY. Stocks are pressing higher, high yield is stalling out.
That doesn’t guarantee a top, but when "Smart Money" refuses to play along, I take note.
English