@jeremymorrell.dev retuiteado
@jeremymorrell.dev
17.2K posts


@jeremymorrell.dev
@JeremyMorrell
Migrated to @jeremymorrell.dev on the sky site
Squamish, BC Se unió Nisan 2012
756 Siguiendo2.5K Seguidores


@jeremymorrell.dev retuiteado

This has been what I've been working on for nearly a year now, super excited to finally do the first release of Automatic Tracing. Starting today anyone with Observability enabled will automatically get traces generated for their Workers that are present in the Cloudflare dashboard and can be sent to third party observability providers. We've had internal teams and select customers using this for a while and they've been able to make good performance gains through the increased understanding of what's happening in their Worker.
But, today's release is only the first of many. There are several things that we didn't have time to include in this first release like context propagation for distributed tracing, user-created spans, even span events, or even some CF bindings we didn't get to instrument. All of these gaps are on the tracing roadmap and will be released as they're ready, but in the meantime there's still a lot of useful data for those that have Workers in production.
Cloudflare@Cloudflare
Cloudflare Workers' support for automatic tracing is now in open beta! Export traces to any OpenTelemetry-compatible provider for deeper application observability, no code changes required. cfl.re/4oHQeBu
English
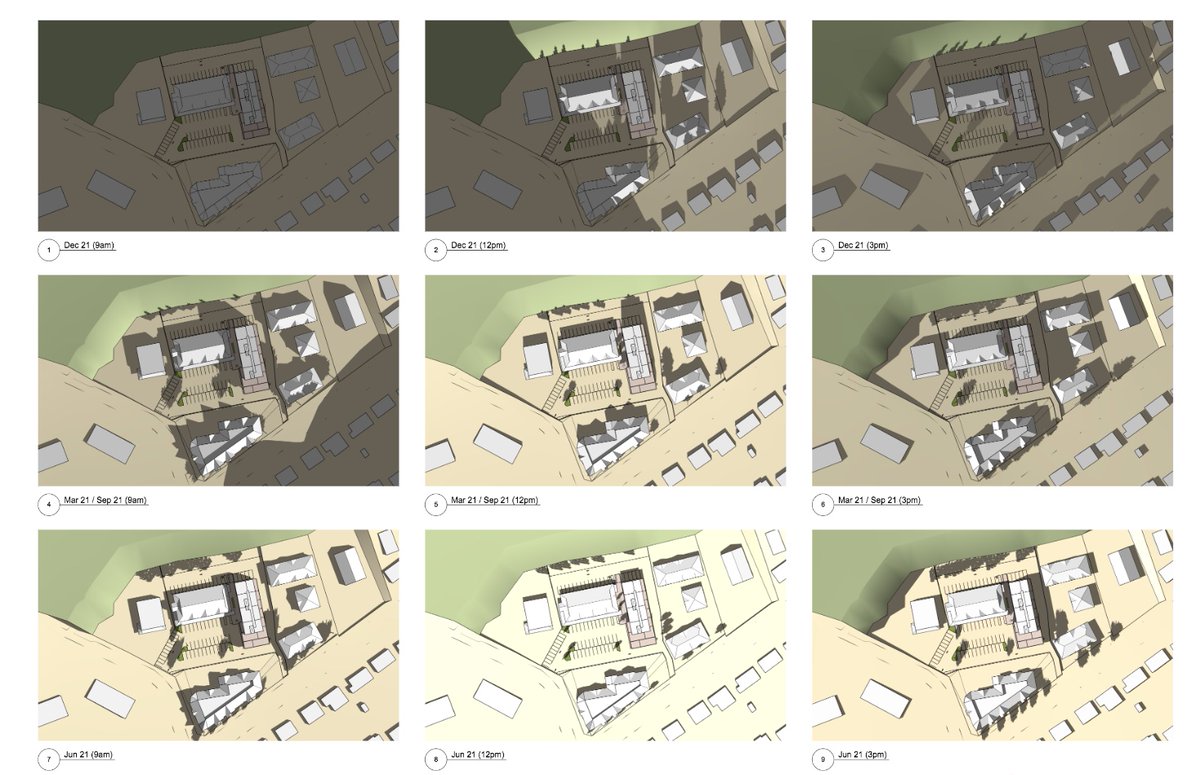
@johnsqfrench Four different responses from four different councillors who all shrugged at the mayor's attempts to get you to agree and clarify direction to staff. No shadows, but also bigger units, and farther from the river, don't displace tenants, and don't give up any parking or go taller.
English

@JeremyMorrell It was clear to me. Developers can’t cut off sunlight for the neighbouring properties. The owners are now assessing what they will do next.
English
On Jan. 7 Squamish Council voted 4-3 (Hurford, Stoner & Andersen) to send the 5-storey apartment proposal at Westway Centre back for further evaluation. My top concern is the shading on a townhouse development next door. Developments in Valleycliffe can't rob neighbours of sun.
English
@calvinalkan Verbose spans could help here, but I *think* you might be trying to use tracing as a replacement for profiling
English

More complex to implement since each child middleware happens in between the start/end of a parent middleware, like an onion.
But middleware was just an example, it could have also been the total time spent rendering views in the backend, broken down by child view / partial with view props as span attributes.
Now, you could store the render time for each view on wide event, something like:
app.timing.view. = 1ms
Maybe the sweet spot is aggregated timings on wide event and optional dynamic tracing via feature flags or similar solution.
tersesystems.com/blog/2021/08/2…
English
There have been some good posts on what "wide events" instrumentation is but not as many on how to go about it, what attributes you should add, or how to work with OpenTelemetry
I put everything I've learned in the last few years into one guide jeremymorrell.dev/blog/a-practit…
English
@calvinalkan re: middlewares. My experience is that if your middlewares are not performing any I/O (like auth / caching), just doing some computation, they are very unlikely to have interesting timings. If they are doing I/O, then that would already be captured in spans. YMMV
English
@calvinalkan Why only add a global middleware timing? Vs a timing attribute for each? The data encoded in each span here is three values: a name, a timestamp, and a duration
I've implemented verbose traces on a platform team, but no one adopted them. They do seem like a good idea!
English
@calvinalkan What additional information are child spans giving you in this scenario?
Ultimately you do have to look at your code to debug. Tracing helps you skip to "I know it happens in this section under these circumstances". It's not meant to be equivalent to a debugger.
English
Yes, I have high-level timings on the root event, as per your article.
But without per-middleware spans, how'd you, for example, debug why global middleware takes 5 secs for one group of requests, compared to 10ms baseline.
The wide event seems great for answering "where is the issue", but without sufficient child spans, the "why" seems more complicated?
English
@calvinalkan You can break across dimensions and see if there are correlations. Honeycomb's bubbleup can do this for you. "What do these slow requests have in common?"
English
@JeremyMorrell It is....
Though, if you don't have that, then how do you figure out a "why".
Ex: Okay, for X subset of request, we spent 5 seconds in middleware compared to 20ms, why? Which one it is, and why is it slow, etc.
English
@calvinalkan And when you end up with traces of 100k+ spans it becomes really hard to see much of anything.
English
@calvinalkan Ex: if there is a correlation between a specific user (or maybe region... or...) and long middleware execution, you're going to struggle to see that if they are their own spans.
English
@calvinalkan I'd also encourage you to write up about your experience here! There's not enough out there
English
@calvinalkan The guidelines are more about avoiding initial antipatterns before you've really understood your tools
English
@calvinalkan Wide events + tracing can work really well together! But I find people tend to get lost in the the tracing bits and waterfall diagrams before they learn to query across spans, which is where a lot of the leverage is
English
@calvinalkan That said, sometimes it's useful to wrap a chunk of important functionality in its own span w/ its own attributes, so this is more of a guideline
English
@calvinalkan @mipsytipsy Having one “wide” event doesn’t mean it’s the only event you emit for a request! You can still emit child spans and see your tracing view. When you put attributes on the “main” span you’re designing the schema you want to query against
English
Thanks, your shared article cleared up some major points of confusion:
My struggle with 1 event = 1 request has always been that I can't see the timeline of what happened inside a request (trace view).
jeremymorrell.dev/blog/a-practit…
---
For clarification, when I mention "debug logs," I refer to structured logging, maybe to Sqlite/duckdb, etc.
Will Sargent has a lot of good stuff on this.
tersesystems.com/blog/2019/10/0…
English

It's a little-known fact that should be MUCH better known: that AWS has been using arbitrarily-wide structured logs internally to understand core services for AGES.
They don't use the term "canonical logs", so it's just about impossible to find them talking about it. But true.
Victor | priv/acc@vcastellm
@mipsytipsy I remember an AWS post from like 4 years ago about the exact same topic. For me it made total sense but there's a big stopper, we use DataD in my last 2 companies and metrics are super cheap but logs are super expensive so this approach is more difficult to adopt. Still the case
English
