Colin Raymond

420 posts

Colin Raymond banner
Colin Raymond

Colin Raymond

@regclimo

Climate scientist at Univ of California, Los Angeles & the Jet Propulsion Laboratory

Pasadena, CA, USA Inscrit le Haziran 2016
203 Abonnements746 Abonnés
Colin Raymond
Colin Raymond@regclimo·
Happening in two days!
English
0
0
0
79
Colin Raymond
Colin Raymond@regclimo·
The Gulf region sits at the very vanguard of climate-change-driven heat threats. How humid heat plays out there, in all its complexity, is essential for planning heat resilience across impacted people and sectors — particularly for risks that may have counterintuitive elements.
English
0
1
1
280
Colin Raymond
Colin Raymond@regclimo·
Metrics (WBGT, UTCI) with radiation have a typical afternoon peak. But Tw & HI, widely discussed in recent years, apply well to indoor/shaded conditions. We consider them incomplete yet valuable signposts on the way toward a full, locally relevant portrait of heat-stress risk.
English
1
1
1
275
Colin Raymond
Colin Raymond@regclimo·
No matter how intense the humid heat, it might be thought that sunset and a refreshing sea breeze will always bring some relief. But close examination of the Persian/Arabian Gulf region dispels these assumptions, as explored in our new @CommsEarth paper: rdcu.be/dWXl5
English
1
0
6
297
NWS Phoenix
NWS Phoenix@NWSPhoenix·
Another record high temperature broken in Phoenix with a high of 108°F. This breaks the previous record of 104°F set back in 1987. This is now the 15th consecutive day that a daily record high has been tied/broken in Phoenix. #azwx
NWS Phoenix tweet media
English
11
66
171
19.6K
Colin Raymond
Colin Raymond@regclimo·
In a peaks-over-threshold sense it's shaping up to be less singular, but still likely in the global all-time top 20 (~35C of cumulative record margins). Being the tail end of summer makes it a bit more bearable, but also causes more intersection with fall activities like sports.
English
0
0
0
69
Colin Raymond
Colin Raymond@regclimo·
@NWSPhoenix's streak of consecutive record-setting days, already 13, would reach 20 if the current forecast holds. Among all global locations with 50+ years of data, the only comparable streaks have been on various tropical Pacific islands, plus the Russia 2010 mega heat wave.
Colin Raymond tweet media
English
1
0
0
110
Colin Raymond
Colin Raymond@regclimo·
@robsobs A few spots in TX/LA might have done it last Aug (haven't fully verified though). On a global scale, for places with long periods of record, the only remaining competitor for continuous record-setting length will be Russia 2010 if Phoenix keeps this up much longer
English
0
0
0
39
Rob's Obs
Rob's Obs@robsobs·
Nothing to see here.. just another 5 days of record highs for Phoenix. That would make 14 straight days of record highs for them. I don’t think I’ve ever seen such a prolonged stretch of record heat anywhere in the US climate record.
Rob's Obs tweet media
English
5
14
44
8.6K
Colin Raymond
Colin Raymond@regclimo·
Helene's aftermath is rightly drawing much of the attention in the US, but the ongoing heat wave in Phoenix is truly shaping up to be one for the record books. Today was the 7th consecutive record-tying or -setting max temp, with nearly all the next 7 days expected to do the same
Colin Raymond tweet media
English
1
1
1
281
Colin Raymond
Colin Raymond@regclimo·
@DonSuth89069583 The heat in Phoenix has really been outperforming this week. A quick search suggests today at Sky Harbor might well be the latest 117F/47C ever recorded in the US.
English
2
0
2
103
Don Sutherland
Don Sutherland@DonSuth89069583·
#Phoenix has reached 117F (47.2C). That breaks the September monthly record of 116F (46.7C) from September 1, 1950 and September 5, 2024. It is equal to the August monthly record. #azwx
English
7
4
15
1.5K
Colin Raymond
Colin Raymond@regclimo·
Urbanization + extreme weather + climate change = probably time to move the Arizona State Fair to a cooler month
Colin Raymond tweet media
English
0
0
4
207
Colin Raymond retweeté
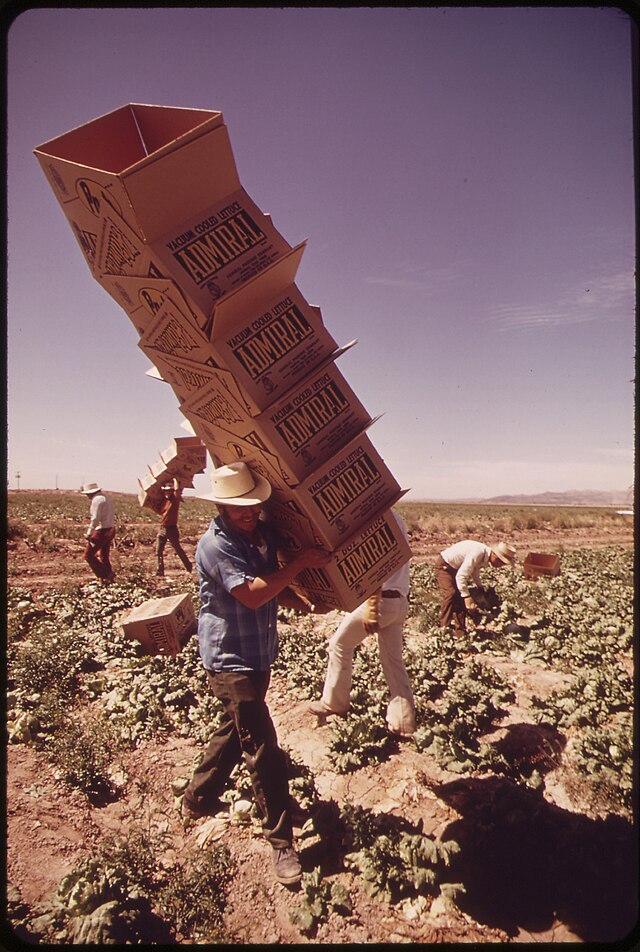
Xaida Project
Xaida Project@XaidaProject·
🆕Special Webinar | In one month, XAIDA and @CLINTH2020 will be holding a webinar on compound weather and climate events. Meet our two speakers, @Bevacqua_E (UFZ) and Niklas Luther (JLU). 🔎Abstracts & registration 👉url-r.fr/zYfUQ 🗓️October 25th ⏰10:30am (CEST)
Xaida Project tweet media
English
0
4
4
1.2K
Colin Raymond
Colin Raymond@regclimo·
Encouraging to now see humid heat spotlighted in the 2023 State of the Climate report climate.gov/news-features/…, but alarming to track its inexorable rise. Great work summarizing this hazard in our subsection led by Kate Willett
English
0
0
5
338
Colin Raymond
Colin Raymond@regclimo·
@sunil_nagaraj Yes, stickiness tau can be expressed as the following, which we then solve numerically to yield the results shown in Table 1. Stickiness is designed to vary across equal values of a given humid-heat metric, so in your table its isolines would track from lower left to upper right.
Colin Raymond tweet media
English
0
0
1
88
Sunil Nagaraj
Sunil Nagaraj@sunil_nagaraj·
@regclimo So, from an operational perspective, for a given Tw at T,RH we can compute a Tsticky? Are values of Tsticky correlated to HI? I created this table to see ‘same Tw but diff HI) x.com/weathersightio…. Thanks.
weathersight@weathersightio

Humid heat stress. Heat Index (℃/F) and Wet Bulb Temperature(℃/F) are used to measure the combined effects of air temperature and humidity on human discomfort. Dew point (℃/F) is affected by moisture content, so muggy days have a higher dew point. 🧵

English
1
0
0
86
Colin Raymond
Colin Raymond@regclimo·
A fundamental problem in humid heat -- as a bivariate quantity, what does it mean if places or times have the same humid-heat value (choose your favorite metric) but different combinations of temperature and moisture?
English
3
1
4
608