My younger son (16 Years) came to me 2 weeks ago: "Dad, I want to learn how to be a systematic trader"
One hour a day. He loves it. I love it :-)
First sessions:
• What is money / inflation
• Why is it behaviorally hard to invest in assets that beat inflation?
• Point-in-time data (fundamentals, technicals, estimates/actuals)
• Ranking systems via @P123Finance
• "Which house would you buy?" — €500k (no rent increase) vs. €1M (20% rent increase per year possible). He picked the right one. Lesson: Value is fine, but it needs growth.
Next up:
• Connecting P123 with @IBKR
• Bid-ask spreads & order algos
• Size effect (smaller AUM = better edges)
• Macro — which countries to invest in (you guessed it: #SecularBullMarketUSA)
• Cynefin model — complicated vs. complex, Taleb, Black Swans, survival vs. hiding left-tail risk
• Long vs. short — payout asymmetry
• Building his first model on P123
• Building his first AI Factor model on P123
• TA --> VCPs, Episodic Pivots
The 10k → 100k Challenge:
I'll give him a size-restricted small-cap model. He trades the signal via P123 → IBKR.
Stocks listed in a weakening currency, outperform.
That means: investing in Turkey, Poland, Sweden.
The more weakening the currency, the better.
Unhedged that is.
Crazy, right?
Testing robustness across scenarios in Canada, universes, and regimented markets — because real strength shows up everywhere. 🚀📊
So tradable btw
More info and different trading systems in profile
#portfolio123#cad#tsx#sp500
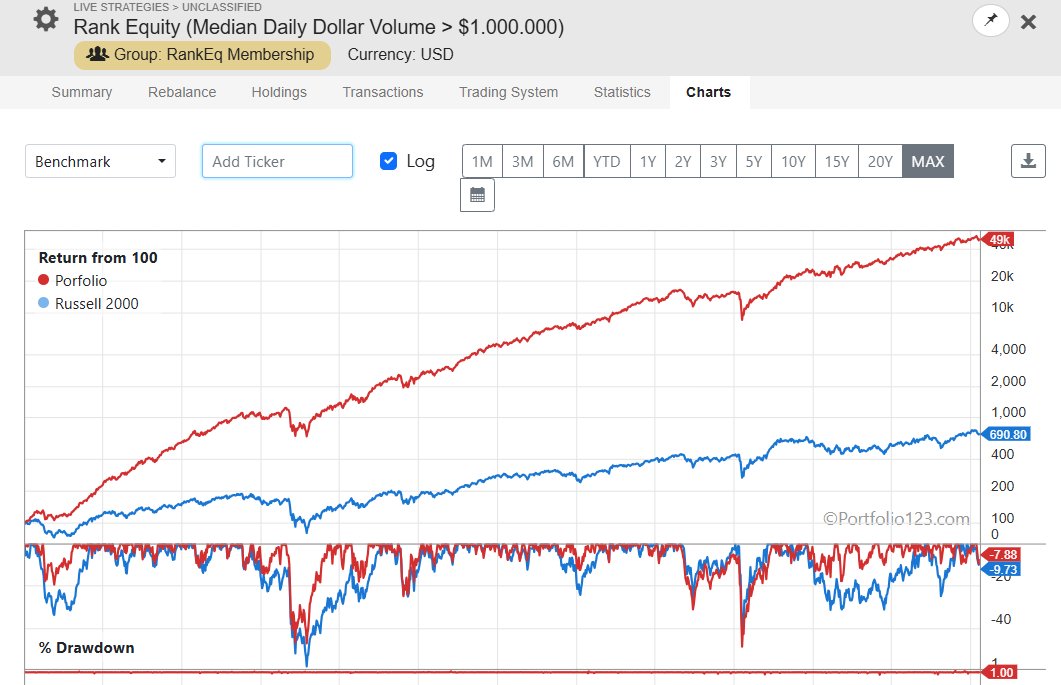
A subscriber wanted to link one of my example portfolios with their broker.
So I offered it.
10 minutes to set up. $1M+ median dollar volume — liquidity is no issue here.
Outperforming every year since 2002, except 2020.
Another happy member.
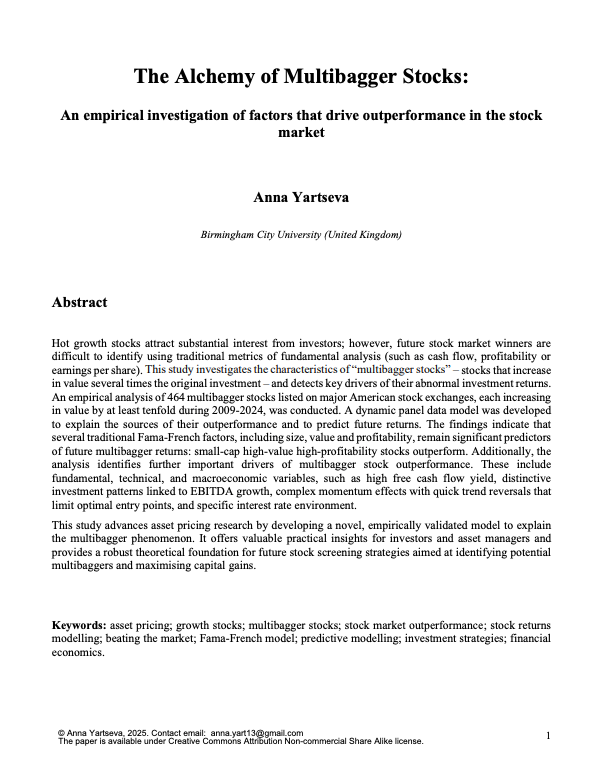
The secret of hedge funds is revealed in a 41-page PDF:
This paper analyzed 464 stocks that 10X-ed over a 24-year period.
Here are the best factors that drive outperformance: (number 3 is the best 🧵)
🚨BREAKING: A new Python library for algorithmic trading.
Introducing TensorTrade: An open-source Python framework for trading using Reinforcement Learning (AI)
If analysts are raising their earnings forecasts, why doesn't the stock price immediately reflect that?
In an efficient market, a consensus EPS revision should reprice the stock instantly. But the evidence shows it doesn't.
Earnings revision momentum is a distinct, persistent return anomaly, independent of price momentum. The mechanism is analyst under-reaction. Forecasters update conservatively, one quarter at a time, anchoring to prior estimates. Each upward revision signals the prior estimate was too low and statistically there are more revisions follow. The market reprices, but incompletely and slowly.
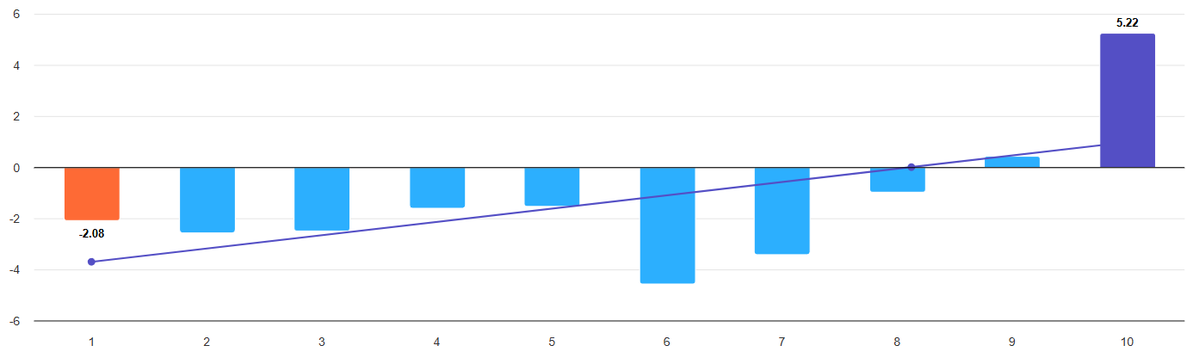
We tested the 13-week change in the current fiscal year EPS consensus on the Russell 2000 back to 1999. The quintile spread is clean and monotonic. Well, you'll notice the middle 2 buckets underperform and that's because we set NA's to neutral so the middle portion represents stocks without coverage.
But the more interesting finding is where the effect concentrates: it's strongest in the least-followed, least-liquid names in the index — exactly the stocks where information diffuses slowest and institutional coverage is thinnest.
This fits the theoretical prediction from Elgers, Lo & Pfeiffer (2001): delayed price adjustment to analyst revisions is an information friction problem, not a risk premium. Less coverage means slower diffusion means a longer window to act.
For small-cap quant strategies, earnings revision momentum is a structural inefficiency still available in public equity markets. But will it last?
linktw.in/MariosCF
I gave a mini masterclass on the Parabolic Shorts setup in an episode that just dropped on @chartfanatics & @Wordsofrizdom .
If you wanna have an A-Z way of how to trade things like $SMCI, $MSTR, $SLV, etc, I recommend watching the full episode, it's full of nuggets
This strategy is a setup that I've used since my early trading days, and it's great both for quick injections of capital into the equity as well as, even more importantly timing your partials if you're already on the long side!
Hope you enjoy!
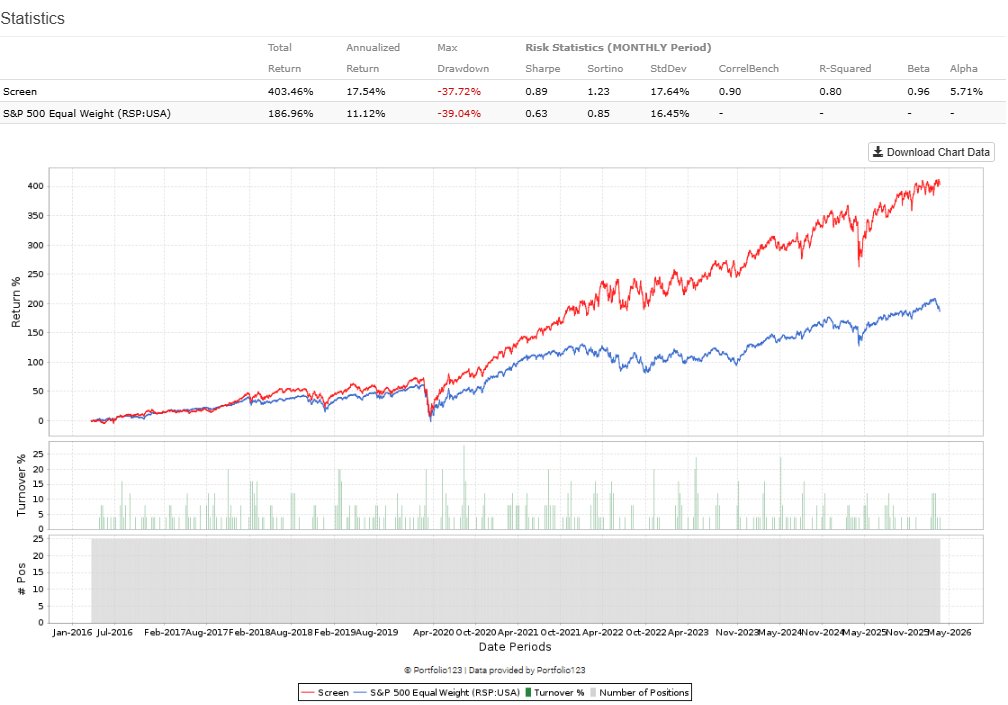
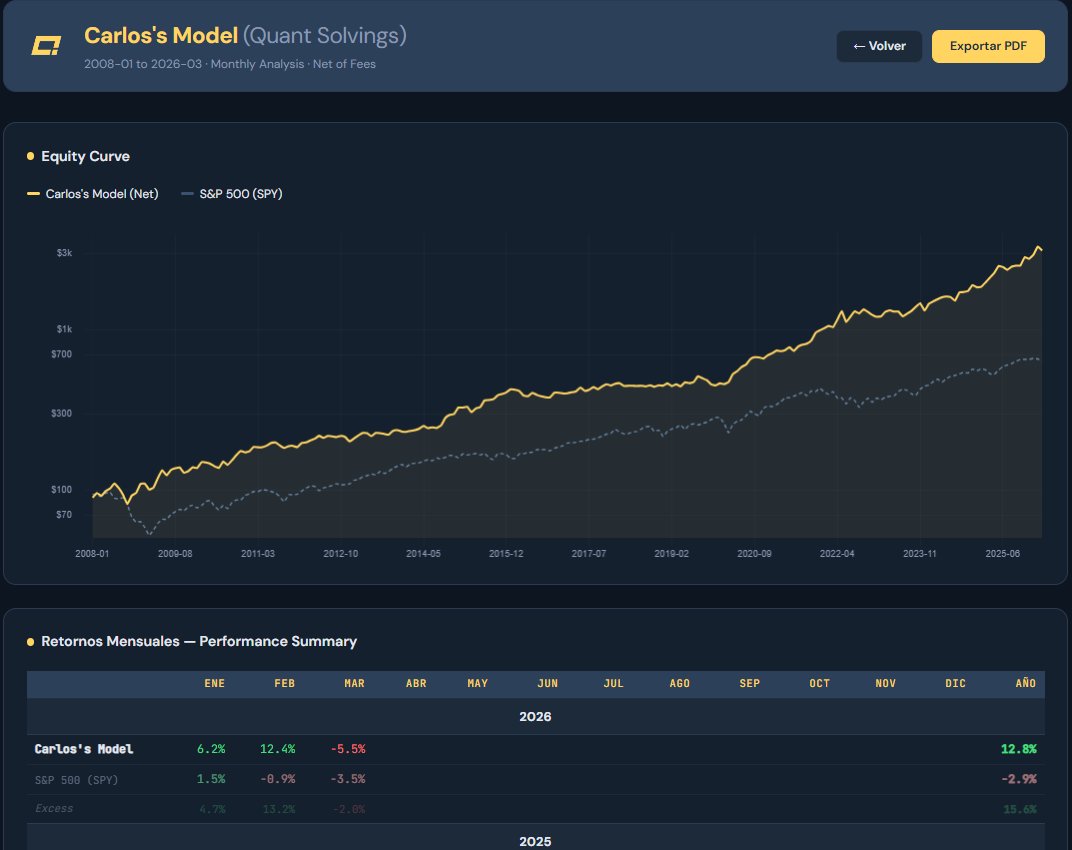
A 10-year backtest on S&P 500 large caps proves that filtering for earnings quality creates a significant edge.
The strategy focuses on companies where operating cash flow exceeds reported net income. When cash collected outpaces earnings on paper, the accrual component is negative. This means the company is not relying on accounting estimates to hit its numbers.
The strategy applies five rules:
▪️ Positive operating cash flow.
▪️Positive net income.
▪️Cash flow greater than net income.
▪️Accruals to assets ratio below 5 percent.
▪️Financial firms excluded.
The remaining names are ranked by the accruals to assets ratio and the best 25 names are held. The results are compelling.
Over the decade ending March 2026, this 25-stock portfolio returned 17.54 percent annualized. The S&P 500 Equal Weight benchmark returned 11.12 percent. Better Sharpe ratio as well.
Current holdings include Meta, ServiceNow, Datadog, and Devon Energy. These firms represent a cash fortress across different sectors. They are held together by one shared trait: their cash earnings match or exceed their reported earnings.
Are accruals still relevant?
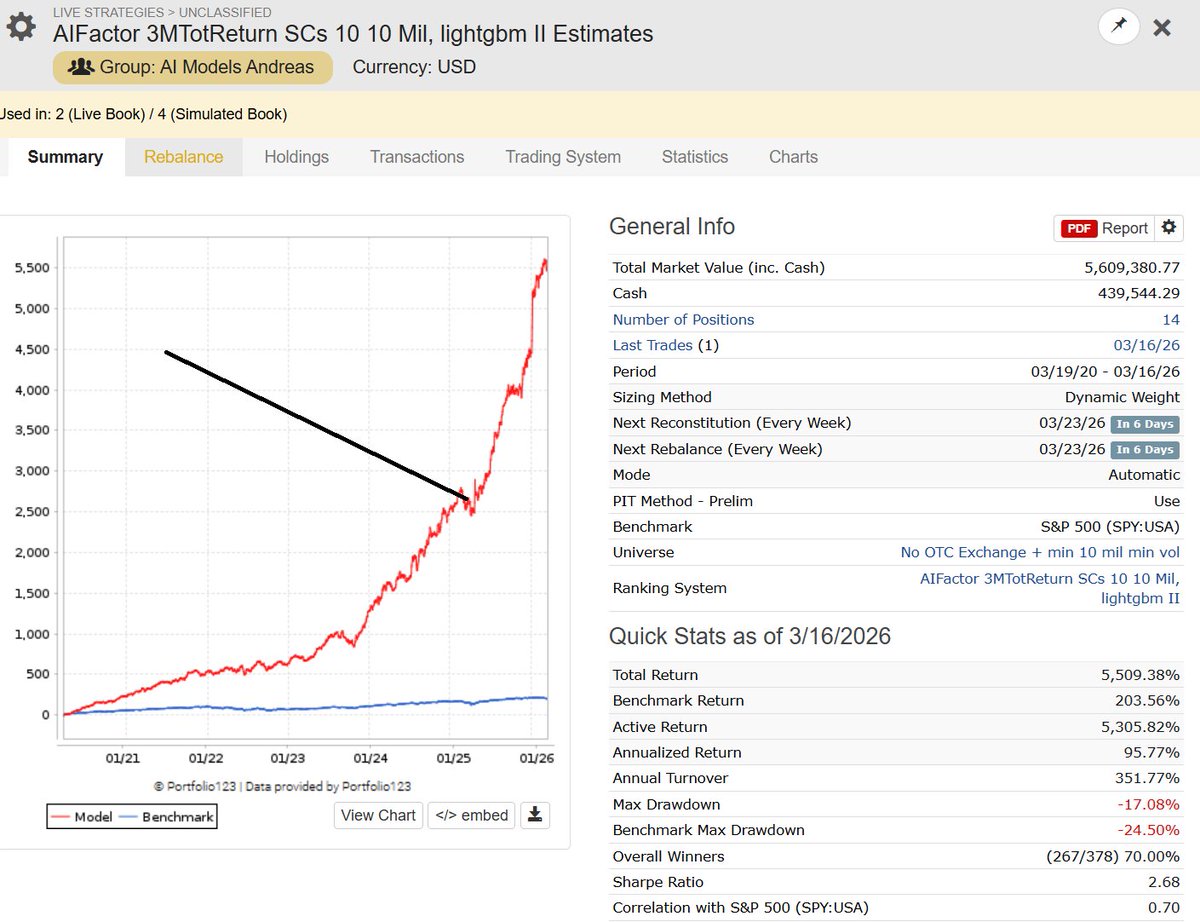
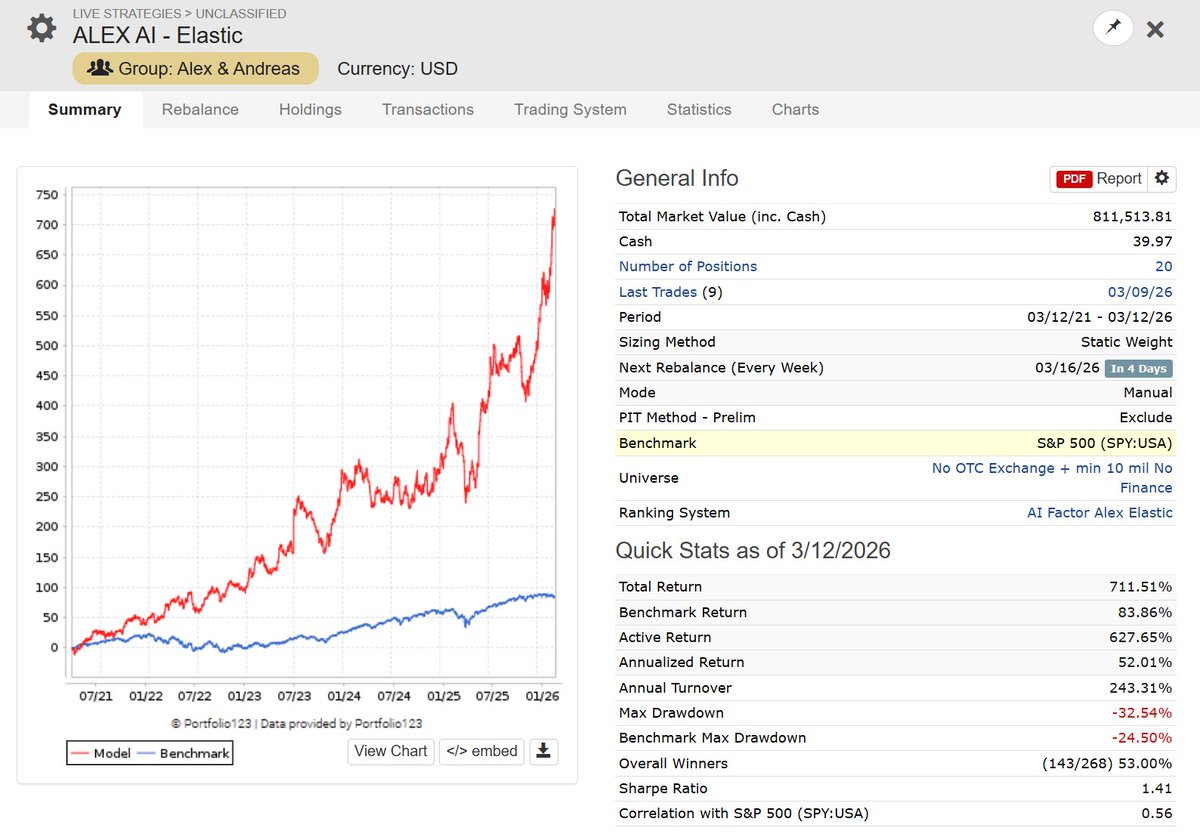
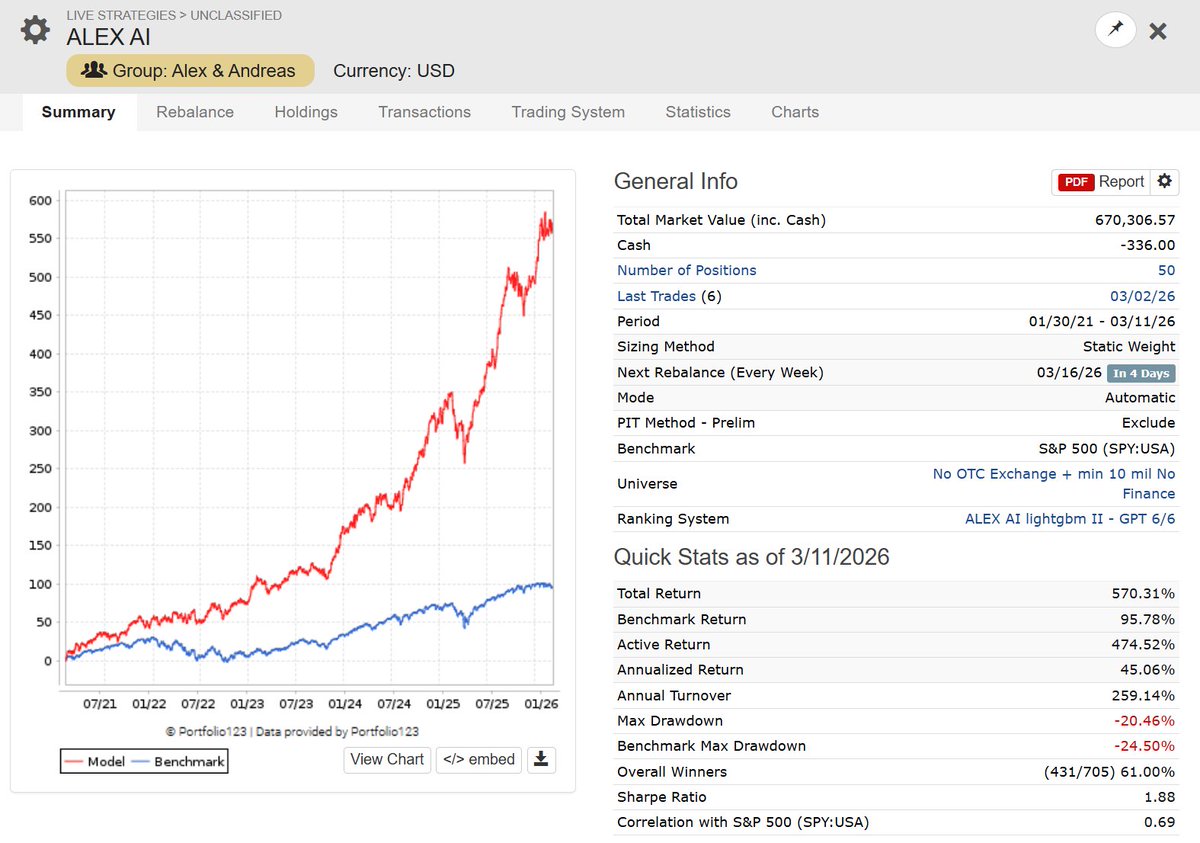
About a year ago, I started publishing my AI Factor Small Cap Strategies. The response? My first real shit storm.
Critics were quick to point out the obvious: "This stuff is highly capacity constrained."
They weren't wrong. But here is the point:
Today, we are running Strategy Books with up to 27 Small Cap Strategies, with a (book) capacity ranging from $5 –25 Million — depending on how you scale in and out of positions.
For those who need scale, our Large Cap Strategy Books (S&P 500) currently find capacity far north of $500 Million.
So no — I am not claiming we are revolutionizing the business of @BlackRock.
But for Institutions / Family Offices willing to operate in the lower volume threshold parts of the market:
Welcome to the party ;-)
I just built a custom Skill for Claude that knows the entire Portfolio123 platform.
Every formula. Every function. The full API. Ranking systems, universes, screens, all of it.
You can now ask Claude to write P123 formulas, debug your ranking nodes, build screens from scratch, or pull data through the API with Python.
It's like having a P123 expert available 24/7 inside your chat.
I'm giving it away for free.
To get it:
→ Like + Repost this post
→ Follow me
→ DM me "P123 Skill"
I'll send you the full pack.
Hedge funds are worried.
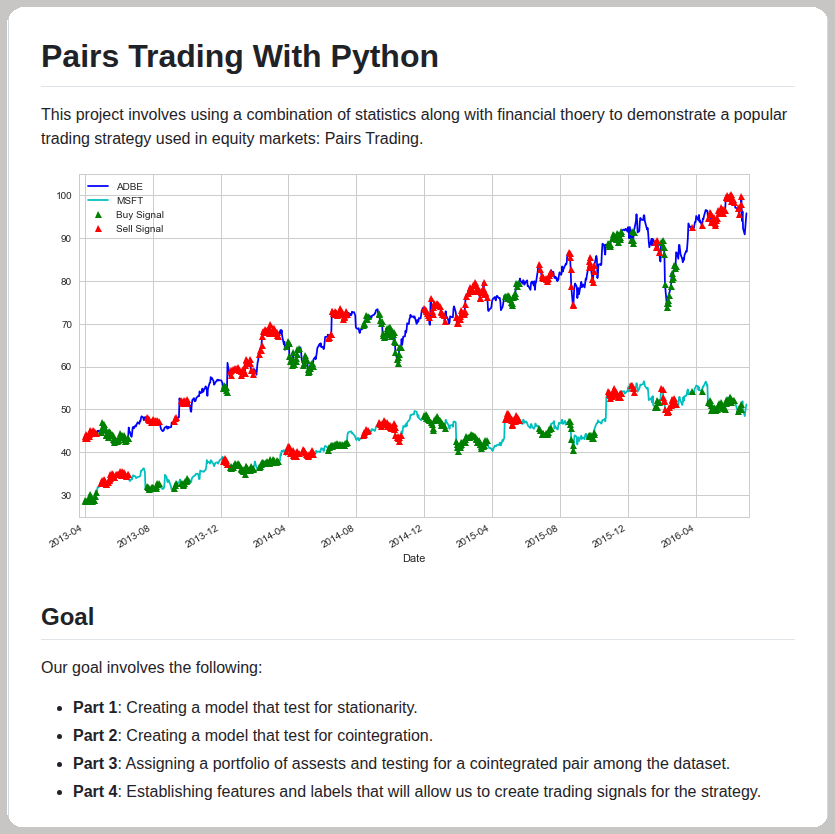
Stat arb is now available to the masses.
Some guy just published the most in-depth pairs trading strategy I've ever seen.
100% free
The Opening Range Breakout is one of the oldest ideas in active trading.
Toby Crabel documented it in the early 1990s, and the concept has since been used and refined by many experienced practitioners and Market Wizards, including @LindaRaschke, who presented a version of the strategy in the well-known book "Street Smarts".
Yet despite decades of real-world use, a rigorous backtest using intraday data granularity had never been published with a focus on the needs of active traders.
Three years ago, together with my friend Andrew Aziz, we decided to fill that gap.
The paper became our most-read research piece, downloaded by over 40,000 traders and researchers.
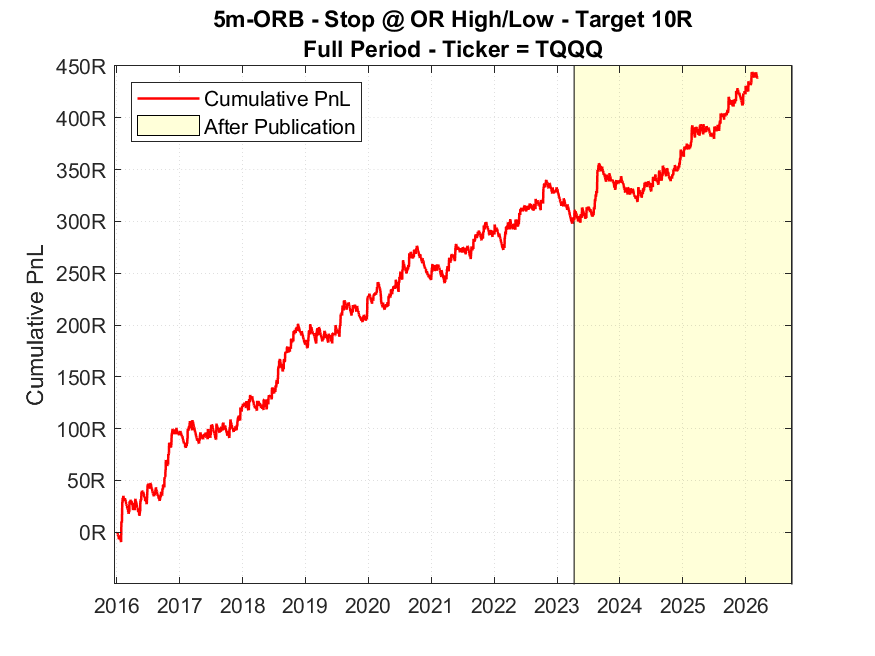
The most persistent question we received since publication: is the edge still there?
Since publication, the model has continued to perform positively across many of the variations we documented. The out-of-sample behavior has been consistent with the historical backtest, which is arguably the most important test any systematic strategy can pass.
The chart attached displays the updated cumulative net P&L expressed in R-units of the base model proposed in the paper.
We have now been working on a natural extension of this research.
This time, we tested something closer to a pure Opening Range Breakout system on SPY, the most liquid and widely traded equity instrument in the world.
Based on 20 years of data, the edge exists. But to make the strategy robust and resilient to slippage and transaction costs, it is essential to filter out market noise and trades with minimal conditional profitability.
The introduction of daily price-pattern filters and other simple intraday features improves substantially the efficacy of the strategy, making it a strong candidate for a well-diversified portfolio of intraday systems.
At Concretum|Research we are finalizing the full paper now. Publication is expected in the coming weeks.
If you have not read the original work yet, it remains freely available on our website and on SSRN. Given what is coming, it is a good time to revisit it.
Link to the paper in the first comment 👇
#SystematicTrading#DayTrading#QuantitativeResearch#AlgoTrading#OpeningRangeBreakout#Backtesting@BearBullTraders
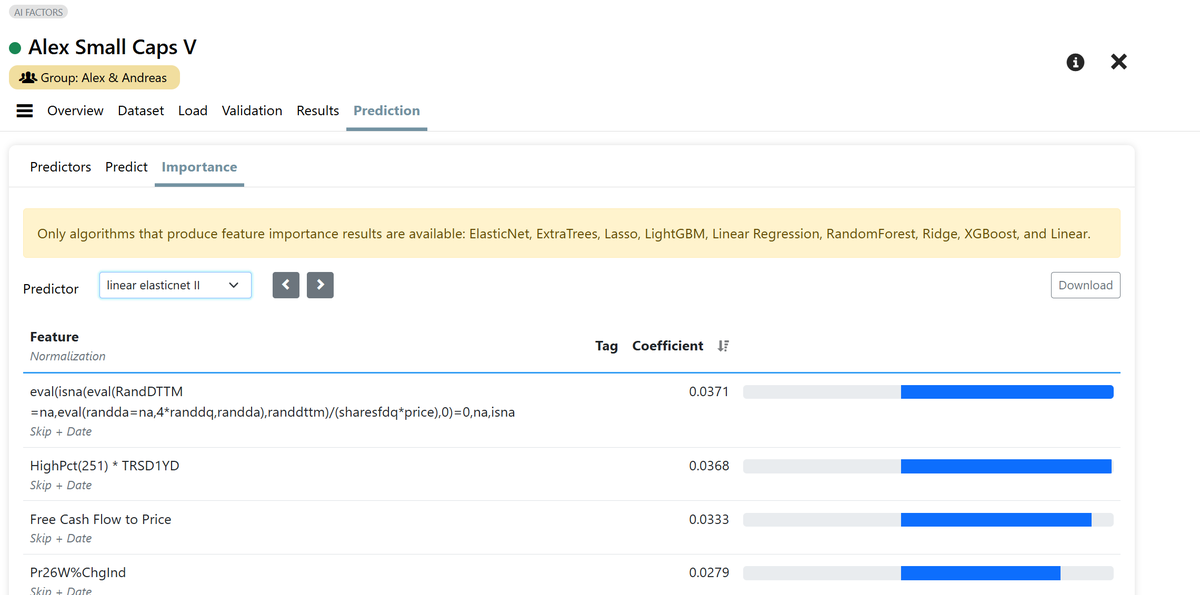
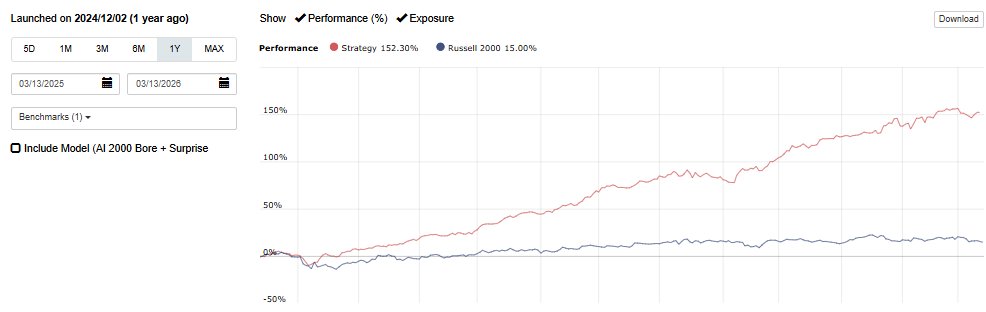
AI Factor robustness test: "Linear Elasticnet II" 📊
It’s not as strong as LightGBM or ExtraTrees, but if your cap curve looks solid, you know a simple linear ML model is successfully extracting alpha from your features.
Plus, you get 100% transparency. You can see exactly how the ranking system is being built via feature importance! 💡
"Description: Linear model with ElasticNet regularization, slightly favoring L2 regularization (all features contribute to the prediction). High number of iterations to ensure convergence. #singlethreaded
Hyperparams: {"fit_intercept": true, "alpha": 0.01, "l1_ratio": 0.2, "max_iter": 25000}"