
JasperCHBS
1.1K posts

The wait is finally over. My Orderflow Bubbles PRO v1.9 indicator is officially live for MMT! 🫧📊
✅It is completely FREE to use until MMT officially integrates its subscription system for custom indikators.
I can proudly say this is the best and most comprehensive Orderflow Bubble indicator in the game right now, pushing every single limit the current MMT platform has to offer. ‼️
And yes — with MMT v5, this indicator will get another massive update to push the new limits, incorporating Time & Sales, Net Long/Short, Open Interest data, and much more. $BTC $ETH $SOL $HYPE
Weeks and even months of development, backtesting, and optimization went into this, and it definitely paid off. The settings are incredibly extensive, so please make sure to read the documentation and work your way through the options step by step.
I’ll admit it: the thing is overengineered. 🤪
But if you actually have high standards and the trading experience to match, you are absolutely going to love it.
If you want to support my work and don't have an MMT account yet, feel free to use my partner link to sign up for free:
▶️ mmt.gg/?atp=BigBoyKev
If you have any questions, let me know! Tag me in your trades and posts on X using the indicator — I will repost and comment on all of them.
Thank you for the insane support and almost 1,000 followers in such a short time. Have fun with the indicator and always trade safe! 🫶
English
@phscbasel Es muss immer fundiert sein. Interpretation kostet Geld und ist fehleranfällig.
Die Kontrolle lag in diesem Fall mit höchster Wahrscheinlichkeit bei den passiven Verkäufern, die den aggressivem Käufern entgegen standen. Kurz und knackig.
Deutsch
$BTC 📉
Trading doesn't have to be more complicated than necessary. It really just comes down to whether you want to overcomplicate it or not.
Locate the price or price range, read the data, and use 2-3 A+ patterns to determine who currently has the stronger hands.
That's it. 🤷♂️

English
@BigBoyOrderflow Du interpretierst es dann als Absorption und bei 66k hatten die Verkäufer die Kontrolle
Deutsch
@phscbasel Stell dir vor es wird, nachdem der Markt bereits grob 1.000 Dollar gelaufen ist, mit aller Kraft (Volumen, Delta) gekauft zu einem wichtigen Preis und es passiert nichts.
Hoher Aufwand, kein Ergebnis.
Deutsch
@BigBoyOrderflow Das freut mich sehr! Vielen Dank für deinen free Content, ist nicht selbstverständlich 🙏🏻
Deutsch
We are just getting started, traders. 🚀
I have so many more projects on the table right now that will bring insane value to your individual trading.
$BTC $ETH $SOL
This Sunday, the highly anticipated Orderflow Bubbles are officially dropping — complete with full documentation!
Get ready. @MMT_Official_ @anthdm 👀🫧
Aureus@CTTraderx
@BigBoyOrderflow Man, thank you for the hard work ! This is OP imo. Play around with it today & its clean af. GG goat Thank you again
English
Show me some support on this quoted post. 🫶
Quick heads-up on the recent and upcoming MMT indicator drops: Every indicator im working on is completely FREE right now. You get full access to the indicators and toolkits until the teased MMT subscription model goes live.
The value packed into these indicators is priceless. Test them, learn the orderflow, and build your edge.
ℹ️Incoming next week:
- Initial Balance: Frame your day, define the opening range, and catch the daily trend early.
- Orderflow Bubbles: Yes, the "holy grail" you’ve all been asking for is finally dropping. 🫧
English

@BigBoyOrderflow Another brilliant post. Thanks a lot for sharing your insights!
English
What exactly happened in the $BTC orderbook? Let me break it down for you and explain why this created a textbook trade entry! 🔍📈
1. The market is in a dynamic upward wave, and aggressive buyers manage to hold the price multiple times. A BID limit positions itself passively below an ASK cluster of spot buys (Green, 21). The market holds, stacks, and absorbs at this price level, sending it a step higher above the key $62,250 strike price.
2. The passive liquidity on the ASK above 62,250 is systematically eaten up at a high pace by aggressive buyers. The market gets exhausted and leans into a pullback. This pullback reveals who actually has the stronger hands. In this case, it’s still the buyers. In the exact zone where aggressive buying previously took place, they start placing fresh BID limits to catch and absorb the selling pressure.
3. This is where the buyers' defense against the sellers peaks. After the market successfully backtests the 62,250 level, more BID limits are quickly placed, stacking the market and absorbing the selling pressure (visible via the red bubbles). Because the price is held at the exact same tick level over an extended period, we are looking at Iceberging: Liquidity is constantly reloaded on the BID to absorb selling pressure and passively build a long position. A large buyer is feeding off the sellers. The actual limit order on the BID is significantly larger and stronger than what initially appears in the order book — classic iceberg action!
4. The market breaks the highs and runs toward the $62,500 mark — another major strike price with even more significance than the 62,250. The rounder the number, the greater its importance and volume from options and market making. Multiple resting orders on the ASK sit exactly at this price and get filled completely and swiftly. This would be the perfect moment to take your first partial exit on a long trade. The market manages to print one more high before a larger pullback occurs. Extreme selling pressure follows (Red, 572). After the market gets passively blocked and suppressed multiple times on the ASK, it returns to the base of the previous breakout and the level of the earlier aggressive buyers.
5. Volatility and selling pressure get absorbed, $62,500 is crossed again, and the market begins to frontrun (evident from the bullish candle and bullish momentum despite a negative delta/negative bubbles). Frontrunning in this form is a clear sign of strength, and the market proceeds to attack new highs.
Entry: Stacking or breakout at $62,250
Stop: Below $62,150, below the stacking
Breakeven: After the breakout above $62,400 or the iceberg action around $62,300
Targets open (aim for resting ASK limits, major highs, strike prices, or historical orderflow events). Actively manage the position based on fresh buyers and counter-signals.

English
@BigBoyOrderflow Incredible work! Congratulations 💥
Unfortunately, I can’t find the indicator in the Community Indicators list. Could you please send me the link? Thank you🙏🏻
English
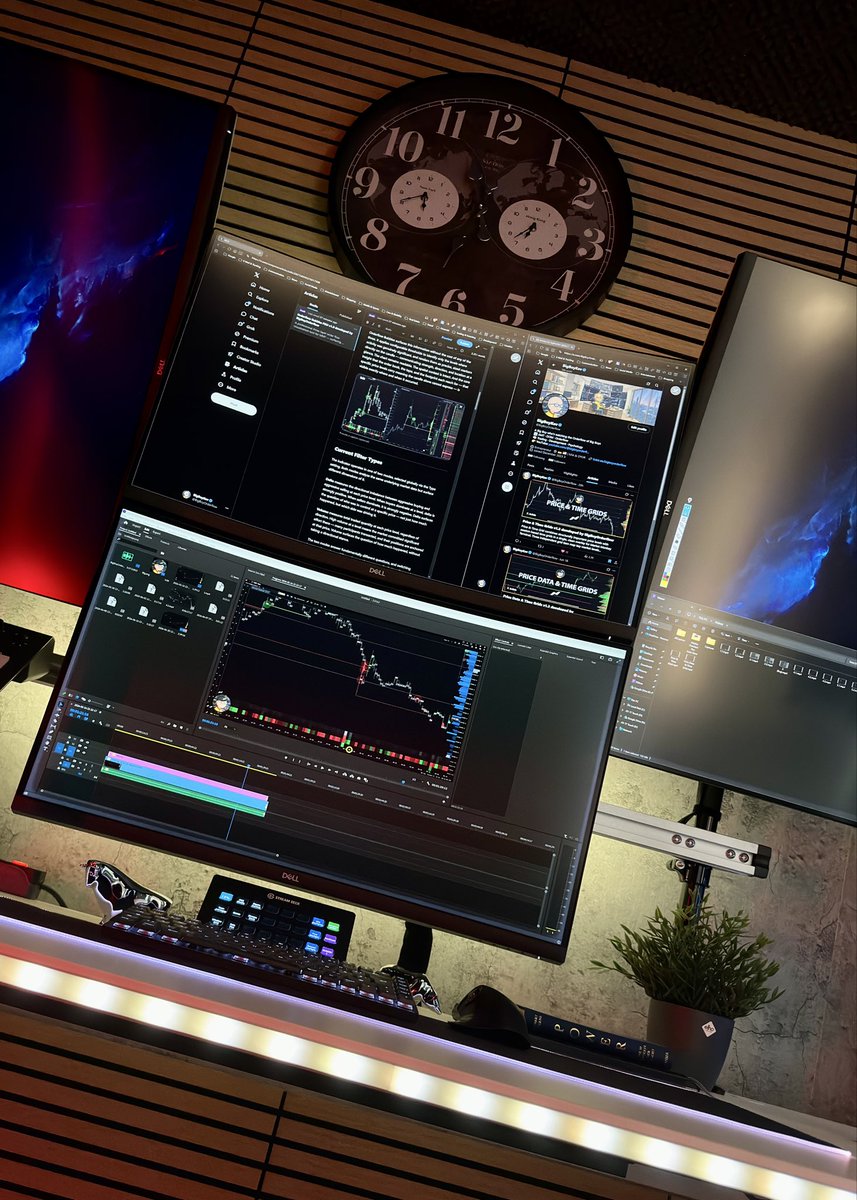
The only $BTC heatmap template you’ll ever need. Clean, structured, and absolutely zero indicator overload. ✅
Bundled and perfectly organized: Aggregated data, Spot vs. Perp splits, Hyperliquid heatmaps, plus DOM and T&S.
Just search for BigBoyOrderflow or BigBoyKev in the MMT Community Layouts. Alternatively, just shoot me a DM here on X and I’ll send you the direct link. 🤝
English
@The_JDK99 I’m trying to learn and recently followed you. You make great Content. Can you explain where on your chart I can see the Spot CVD falling? On MMT Spot is increasing. Thank you.

English

$BTC OrderFlow 📊
OI expanding into highs + rising CVD
→ aggressive new longs chasing
Spot CVD falling
→ real BTC selling into the move.
OI remains elevated
→ aggressive longs remain exposed.
(I'm still waiting for a proper sweep of the highs & clear rejection - SFP/FA)

English
@YugoBetrug0 Top vielen Danke! Ich freue mich auf die Footprints Serie 😅😉
Deutsch

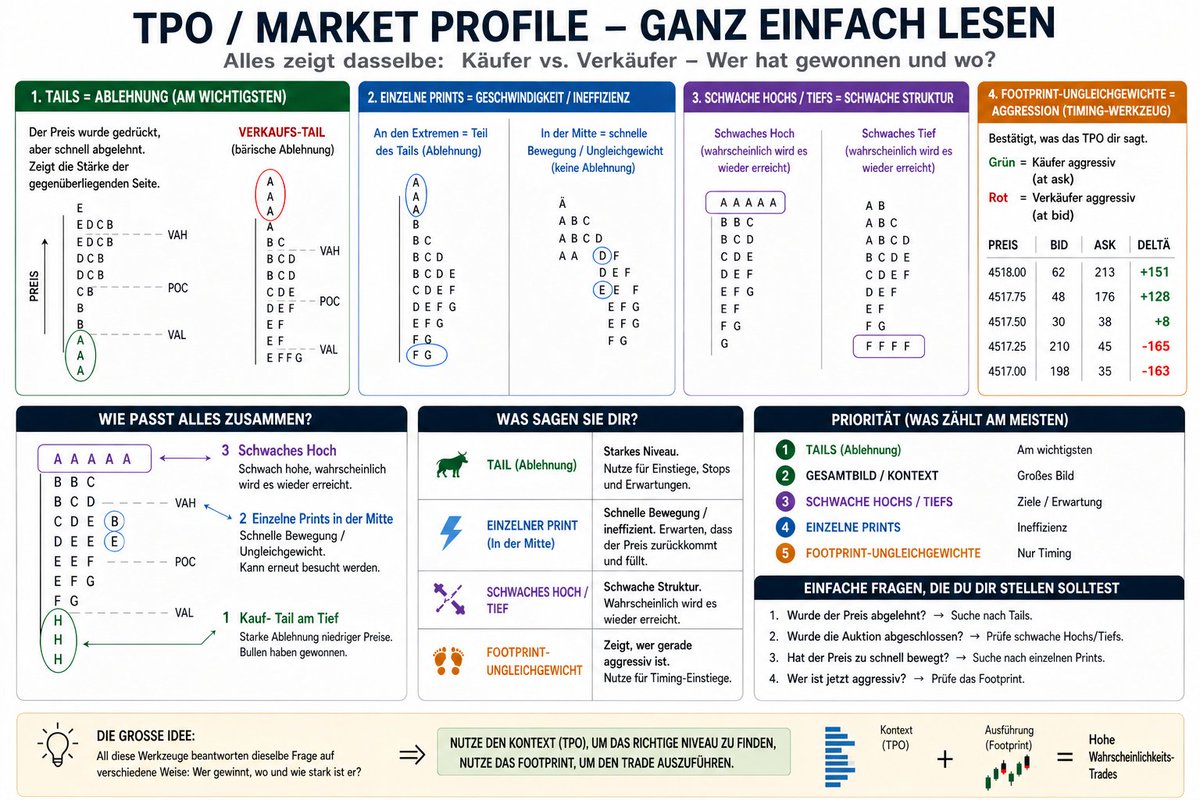
Falls ihr Probleme habt und nicht ganz versteht wie TPO zu lesen ist,dann speichert euch diesen post ab.
Damit wird es einfacher den nächten bitcoin move zu lesen.
Deutsch
Falls ihr bock habt auf noch mehr lernen könnt ihr gerne auf den Discord kommen:
discord.gg/UbhuvCDG4P
Der Discord ist noch im Aufbau und wird mit der Zeit ergänzt und ausgebaut aber das Grundgerüst steht.
Deutsch
@YugoBetrug0 Monthly: stark, Preis hält sich klar über VAH, übergeordnete Stärke bleibt intakt. Weekly: leicht unter POC eher Balance, kein klarer Trend
Daily: Lower Value Migration nach 3 Tagen, erste Akzeptanz tieferer Preise
OI CVD: zeigt langsam Schwäche
Zielzone Single Prints im Daily +
Deutsch
Guten Morgen Bitcoin 👊
Ich würde gerne eure Bitcoin Analyse hören!
Unten sind 4 Bilder vom monthly,weekly und daily + CVD und OI.
Analysiert bitcoin für mich, was sagt ihr?

Deutsch
@YugoBetrug0 @4buAce Es sieht gleich anderst au 😅 so stimmt es mit der Auswahl aller exchanges?

Deutsch

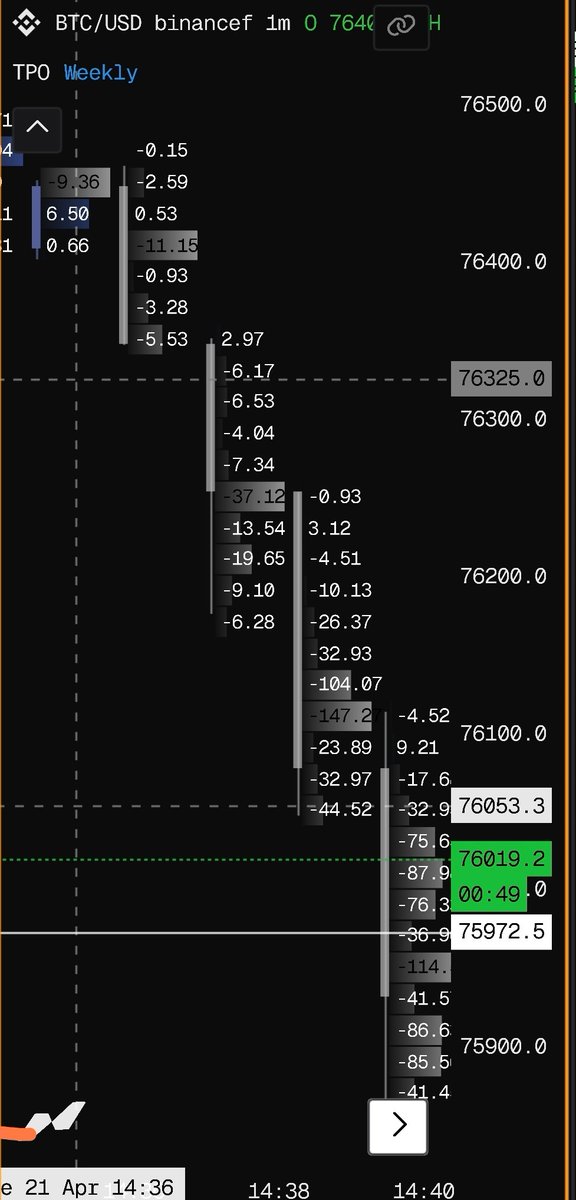
Was macht Bitcoin heute?
Ich musste etwas weiter rauszoomen und wir sind jetzt ziemlich nah an einigen wichtigen zonen:
-Wir haben ein PH bei 79.2
-Sinlgle Prints zwischen 80.6 und 79.5
Letzte Woche waren wir auch schon hier und wurden ziemlich stark abverkauft.
Hier kommt dann das OI und CVD ins spiel,wenn sich bitcoin diesen Zonen nähert achtet darauf und ihr werden ein besseres Bild bekommen ob Btc es schafft diese Zonen zu halten oder nicht.

Deutsch
@YugoBetrug0 @4buAce Bei mir fällt das OI. Sind meine Einstellungen falsch? Kannst du deine Ansicht teilen?

Deutsch
@4buAce Der flow ist gerade absolut bullish,hier zu shorten kann zwar aufgehen,aber wiederspricht jeder Regel.
Preis ↑ + OI ↑ + CVD Spot ↑ + CVD Perps ↑ gegen so etwas zu shorten ist einfach nur gamble
Deutsch
Guten Morgen Bitcoin Liebhaber und shitcoiner.
Speichert es euch ab in die Lesezeichen oder am PC. Schaut es euch so oft an bis ihr es nicht auswendig gelernt habt.
Hoffen wir das die USA und der Iran sich einigen und wir uns mehr auf die Analyse konzentrieren können

Deutsch
Was auch immer das Gekritzel bedeuten soll,ich kann euch mit Sicherheit sagen das in dem Footprint mehr nützliches steht.
Traden nach Linien ist blindes traden
Deutsch