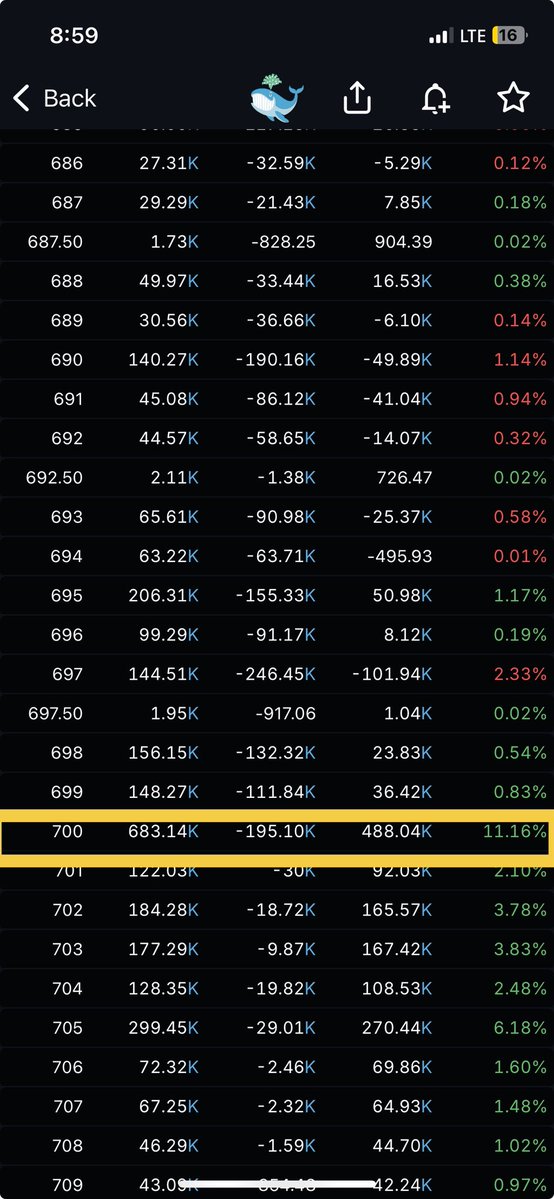
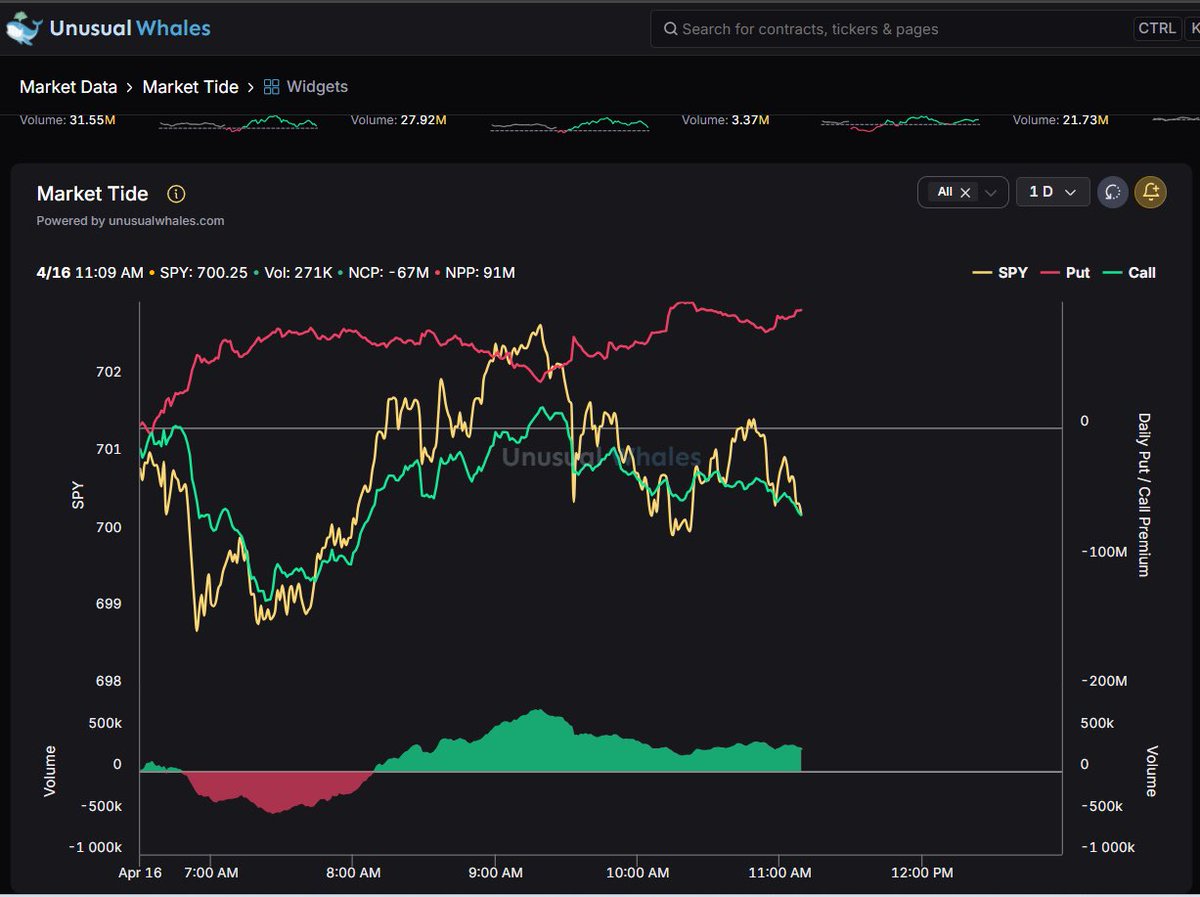
Scholar

30.9K posts

Scholar banner
Scholar

Scholar

@Limitlesss1

Jesus| | 🇺🇸 | $SPY Options Enthusiast| Gamma Guy| NFA|

$7 Discord 参加日 Eylül 2009
977 フォロー中10K フォロワー
Scholar
Scholar@Limitlesss1·
$SPY 💡GEX LEARNING POINT Anyone check Normalized GEX on SPY premarket? 700 WAS A MAGNET 🧲 Using @unusual_whales data, 700 strike normalized GEX went from +5% → +11% overnight ‼️ Yesterday, that +5% level helped us call 694 → 700 🎯 But today? Premarket dipped… and we missed the tell. If we had checked Norm GEX at Premarket , we would’ve seen: ➡️ 700 exposure got stronger (5% → 11%) ➡️ More strength concentrated there ➡️ That level was still a magnet → dip was buyable Normalized GEX = hedging strength relative to total shares (as a %) So when that % jumps… the level gains influence. Higher % = stronger pull/support depending on positioning. Don’t just look once — check it premarket. That’s where the edge is. 📊 Checkout this ticker on Unusual Whales: SPY unusualwhales.com/stock/SPY/over…
Scholar tweet media
Scholar@Limitlesss1

$SPY HOW I USE NORMALIZED GEX TO TRADE SPY seeing 5% Norm GEX at 700 Checkout this ticker on Unusual Whales: SPY unusualwhales.com/stock/SPY/over…

English
8
6
82
109.7K
Scholar
Scholar@Limitlesss1·
$SPY — How to actually trade GEX vs price action 🎯 Only using @unusual_whales #1 question: “Where is exposure relative to price?” Negative GEX → low liquidity • Resistance above • Magnet below (size matters) Positive GEX → high liquidity • Magnet above • Support below Simple framework—now apply it.
Scholar@Limitlesss1

$SPY $SPX CURRENT SPX TAKE 📊 LEARN HOW TO READ MARKET MAKER EXPOSURE Market makers were long gamma on key SPX strikes today since market open 🟢 Price tends to move toward the largest gamma area. Using Periscope, MM positioning stayed long gamma most of the morning and price rose ⬆️ Few negative red sticks and many positive green sticks was a good sign to begin exiting puts unusualwhales.com/flow/super

English
0
3
32
3.3K
Scholar
Scholar@Limitlesss1·
$SPY VIDEO on how to actually trade GEX exposure relative to SPX price action. Number 1 question: “what is exposure where price is” Negative GEX =low liquidity , resistance above, magnet below. (Size matters) Positive GEX=high liquidity, magnet above, support below. Easy.
Scholar@Limitlesss1

$SPY Most traders chase price. I study where price has to go. Using Friday Oct 3rd data, Here’s A step by step breakdown on how I use Market Maker Exposure on Periscope to track SPX & SPY with precision. Understand the why behind every move. 🎓📊 Let me know your thoughts unusualwhales.com/periscope/mark…

English
1
2
14
1.7K
Scholar
Scholar@Limitlesss1·
$SPY I know traders don’t want to hear this, but— T̴H̴E̴R̴E̴’̴S̴ ̴A̴ ̴N̴E̴W̴ ̴W̴A̴Y̴ ̴O̴F̴ ̴L̴O̴O̴K̴I̴N̴G̴ ̴A̴T̴ ̴T̴H̴E̴ S T O C K M A R K E T most people just haven’t seen it yet VIDEO below on how I used @unusual_whales MARKET MAP data to predict $TSLA 13% move in 1 week
Scholar@Limitlesss1

@unusual_whales forecasted $TSLA —+13% after this video on April 8th. Take a look ! On April 8, I posted a full video explaining this exact read using @unusual_whales data. Market Map breakdown: •X-axis → price movement •Y-axis → net premium When premium builds on the Y-axis but price stays near 0 on the X-axis, that’s ACCUMULATION + PRESSURE. That imbalance led to the move. Get access to all the tools here: unusualwhales.com

English
0
2
12
1.9K
Scholar
Scholar@Limitlesss1·
$SPY VIDEO—HOW I USED @unusual_whales TO FORECAST $TSLA +13% MOVE SINCE APRIL 8th 💰📈 Learn how to use MARKET MAP !
Scholar tweet mediaScholar tweet media
Scholar@Limitlesss1

@unusual_whales forecasted $TSLA —+13% after this video on April 8th. Take a look ! On April 8, I posted a full video explaining this exact read using @unusual_whales data. Market Map breakdown: •X-axis → price movement •Y-axis → net premium When premium builds on the Y-axis but price stays near 0 on the X-axis, that’s ACCUMULATION + PRESSURE. That imbalance led to the move. Get access to all the tools here: unusualwhales.com

English
0
1
2
1.3K
Scholar がリツイート
Scholar
Scholar@Limitlesss1·
@unusual_whales forecasted $TSLA —+13% after this video on April 8th. Take a look ! On April 8, I posted a full video explaining this exact read using @unusual_whales data. Market Map breakdown: •X-axis → price movement •Y-axis → net premium When premium builds on the Y-axis but price stays near 0 on the X-axis, that’s ACCUMULATION + PRESSURE. That imbalance led to the move. Get access to all the tools here: unusualwhales.com
English
0
1
13
8.7K
Scholar
Scholar@Limitlesss1·
$SPY LEARN HOW TO ACTUALLY TRADE WITH GEX 💰 At Pre-Market, I used @unusual_whales GEX to predict SPY to climb to 700 today Net GEX is the focus, shows the hedger positional “strength,” but stocks aren’t all the same size in total number of shares, … So Normalized GEX divides that strength by total number of shares, showing how much said hedging “strength” actually matters when compared to total shares. (It will be a Percentage number) High percentage positive normalized GEX = strong support if at or below price, and can act as a magnet if above price, High percentage negative normalized GEX=weak support if it’s at price…, or a magnet if it’s below price, …or a resistance if above price.
Scholar@Limitlesss1

$SPY HOW I USE NORMALIZED GEX TO TRADE SPY seeing 5% Norm GEX at 700 Checkout this ticker on Unusual Whales: SPY unusualwhales.com/stock/SPY/over…

English
4
3
59
14.2K
Scholar
Scholar@Limitlesss1·
$SPY HERE IS TODAYS MARKET MAP (image) There are many more exceptional tools by @unusual_whales other than FLOW Expand your horizons and learn a REFORMED way of looking at the market—looking INSIDE the the market One secret to the reformed outlook of the stock market using data on @unusual_whales is understanding that Data points are plotted on an X–Y axis to show the relationship between two variables—most commonly time (X) and value (Y). Time acts as the stable reference, while the value changes, letting you see trends, momentum, and patterns clearly. Without this structure, the data is just numbers with no visual story or actionable insight. HERE IS TODAYS MARKET MAP I teach you how to read it in the previous video Checkout the market map on Unusual Whales: unusualwhales.com/stock/SPY/over…
Scholar tweet media
Scholar@Limitlesss1

@unusual_whales forecasted $TSLA —+13% after this video on April 8th. Take a look ! On April 8, I posted a full video explaining this exact read using @unusual_whales data. Market Map breakdown: •X-axis → price movement •Y-axis → net premium When premium builds on the Y-axis but price stays near 0 on the X-axis, that’s ACCUMULATION + PRESSURE. That imbalance led to the move. Get access to all the tools here: unusualwhales.com

English
0
0
3
1.2K
Scholar
Scholar@Limitlesss1·
$SPY WHY THE MARKET WAS PINNED AT 700 TODAY How to use GEX on @unusual_whales
Scholar@Limitlesss1

$SPY 💡GEX LEARNING POINT Anyone check Normalized GEX on SPY premarket? 700 WAS A MAGNET 🧲 Using @unusual_whales data, 700 strike normalized GEX went from +5% → +11% overnight ‼️ Yesterday, that +5% level helped us call 694 → 700 🎯 But today? Premarket dipped… and we missed the tell. If we had checked Norm GEX at Premarket , we would’ve seen: ➡️ 700 exposure got stronger (5% → 11%) ➡️ More strength concentrated there ➡️ That level was still a magnet → dip was buyable Normalized GEX = hedging strength relative to total shares (as a %) So when that % jumps… the level gains influence. Higher % = stronger pull/support depending on positioning. Don’t just look once — check it premarket. That’s where the edge is. 📊 Checkout this ticker on Unusual Whales: SPY unusualwhales.com/stock/SPY/over…

English
0
1
10
2.5K
Scholar
Scholar@Limitlesss1·
$SPY HERE’S A TRADING TIP 💡 Sometimes data isn’t telling you what to do — it’s telling you what NOT to do. Overall market tide net volume on @unusual_whales sitting under +250K → may not be enough to for continuation on SPY — But it’s still net positive… so no edge on puts either…don’t short the SPY with net positive overall market tide. This is where discipline matters. Historically, strong upside continuation comes when net volume clears +400K and can expand toward 1M+. Anything below that? Be careful. No real bullish flow to fuel continued bullish price . But still No bearish confirmation. Checkout this ticker on Unusual Whales: SPY unusualwhales.com/stock/SPY/over…
Scholar tweet media
English
3
4
25
2.9K